
 Open Access Article
 This Open Access Article is licensed under a
 Creative Commons Attribution 3.0 Unported Licence
Fluorescent probe with aggregation-induced emission characteristics for targeted labelling and imaging of cancer cells†
Na Peng‡
ab,
Rui Xu‡a,
Michelle Sic,
Amanda Victoriousc,
Emily Hac,
Chun-Yu Chang*ab and
Xiao-Ding Xu *a
*a
aCollege of Chemistry and Molecular Sciences, Wuhan University, Wuhan 430072, China. E-mail: changcy@whu.edu.cn; xd-xu@whu.edu.cn
bGuangdong Provinivial Key Laboratory of Sugarcane Improvement and Biorefinery, Guangdong Provincial Bioengineering Institute (Guangzhou Sugarcane Industry Research Institute), Guangzhou 510316, China
cDepartment of Chemical Engineering, University of Waterloo, Waterloo N2L 3G1, Ontario, Canada
First published on 13th February 2017
Abstract
We report a new peptidyl boronic acid-based fluorescent probe with an aggregation-induced emission (AIE) characteristic. Through specific recognition between the boronic acid group and the cancer-associated sialic acid (SA), this fluorescent probe shows an ability for targeted labelling and imaging of cancer cells.
The over-expression of specific cell-surface carbohydrates is associated with the development and progression of many cancers, and their changes have been demonstrated to affect the ability of cancer cells to grow, divide and metastasize.1–5 Among the diverse structures of carbohydrates, sialic acid (SA) is a representative that is over-expressed in ovarian, pancreatic, breast and hepatic cancers.2,3,6,7 The development of sensors to rapidly detect cancer-associated SA is of great importance for cancer diagnosis or biomarker-mediated delivery of therapeutic agents. In the past decades, biomolecules such as antibodies and natural lectins have been used to detect carbohydrates with high affinity and selectivity.8–11 However, their application in cancer diagnosis and therapy is much restricted due to the difficulty in synthesis, high cost, poor stability and immunogenicity.12,13 Arising from the unique capacity of boronic acids to form boronic esters reversibly with the 1,2 and 1,3 cis-diols presenting on many carbohydrates, boronic acid-based fluorescent sensors are widely proposed for carbohydrate detection,14–18 with the advantages of easy synthesis, flexibility in molecular design and inherent stability toward rigorous use.19–22 However, in most cases, the high fluorescence background and severe emission self-quenching are the key bottlenecks for their widespread applications.
Aggregation-induced emission (AIE) is a unique photo-physical phenomenon that has been widely employed for applications in chemical sensors, biological imaging and optoelectronic devices.23–27 Propeller-shaped fluorophores, such as tetraphenylethene (TPE), are non-emissive when they are well dissolved in solution but become highly fluorescent in aggregation state.23,25 For example, Liu et al. recently reported that boronic acid-modified TPE can use its AIE characteristic to selectively detect D-glucose with improved performances.28
Inspired by the unique photo-physical characteristic of AIE, in this communication, we report a new TPE-tagged peptidyl boronic acid (TPBA) with AIE characteristic for targeted recognizing cancer-associated SA and imaging cancer cells. As shown in Fig. 1A, we designed and prepared three TPBAs with different peptide sequences. These probes show extremely low fluorescence when molecularly dissolved in solution but turn highly fluorescent in aggregation state resulting from the binding between boronic acid group and the cell-surface SA (Fig. 1B). Through examining structure-selectivity relationship using the fluorescence spectroscopy (fluorescence intensity change TPBAs upon the addition of SA and other carbohydrates),13,20,29,30 we demonstrate that TPBA1 with a peptide sequence of GKGKGKK can recognize SA with high specificity, and thus shows high selectivity to targeted label and image cancer cells.
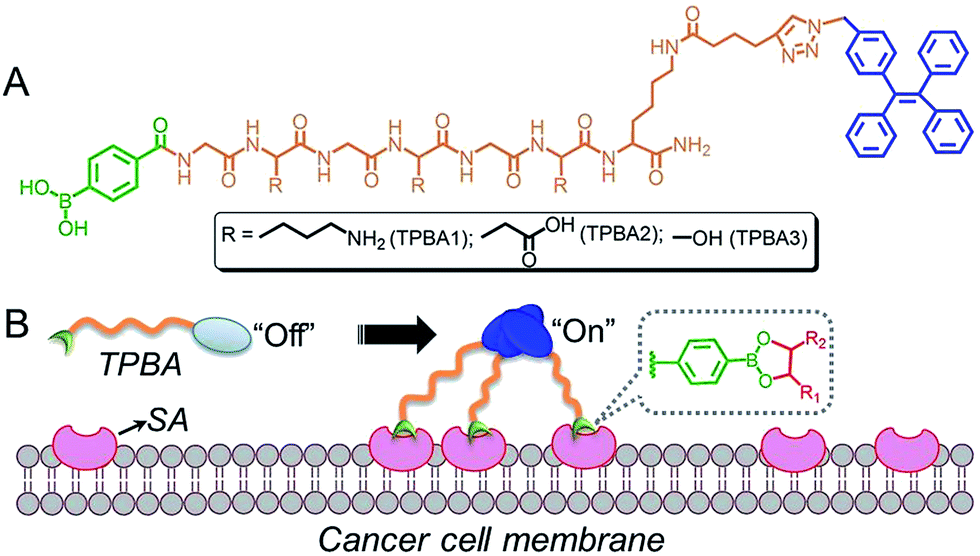 | ||
| Fig. 1 (A) Molecular structures of TPBAs1–3. (B) Schematic illustration of the TPBAs for targeted labelling and imaging cancer cells via the specific recognition between boronic acid group and over-expressed SA on cancer cells. | ||
Starting from the protected amino acids, three peptidyl boronic acids were prepared by standard solid-phase peptide synthesis (SPPS). After conjugation with azide-terminated TPE (TPE-N3) via “click” chemistry, the resulting TPBAs were obtained (Fig. S1–S4, ESI†) and purified by high-performance liquid chromatography (HPLC). We first evaluated the AIE characteristics of the TPBAs in aqueous solution by dispersing the DMSO solution of TPBAs into distilled water. As shown in Fig. 2A and B, TPE-N3 shows strong fluorescence at a concentration of 1 μM, due to the aggregation in the aqueous solution (Fig. 2C). In contrast, the fluorescence intensity of TPBAs is more than 8-fold weaker than that of TPE-N3 even at a concentration of 5 μM. Notably, the observed fluorescence in Fig. 2B is attributed to slight aggregation and self-assembly of TPBAs into nanofibers (Fig. 2D and E). The similar phenomenon is also found in our previous peptidyl boronic acid-based systems.31,32 Herein, because the self-assembly of peptides and their derivatives is built on the hydrophilic–hydrophobic balance,33–37 the binding with hydrophilic carbohydrates such as SA can destroy this balance, and induce the disassembly of TPBAs and the subsequent fluorescence decay. More importantly, this fluorescence change upon the addition of carbohydrates can used to examine the selectivity of TPBAs over different carbohydrates (Fig. 3A). As shown in Fig. 3B, the addition of SA indeed leads to the decrease in the fluorescence intensity of TPBA1 and other two TPBAs (Fig. S5–S7, ESI†). As expected, with the binding with SA to increase the hydrophilicity of the whole self-assembly system, there is no observable nanofibers in the solution (Fig. 3C). We also examined the fluorescence change of TPBAs upon the addition of galactose, glucose and mannose (Fig. S5, ESI†). The maximum fluorescence intensity change profile is shown in Fig. 3D. The TPBAs show various fluorescence intensity changes upon the addition of different carbohydrates, indicating different binding affinities. TPBA2 shows strong binding affinities with the all the added carbohydrates, but there is no selectivity over the different carbohydrates. TPBA3 presents a strong binding affinity and good selectivity over mannose, but not cancer-associated SA. Compared with other two TPBAs, TPBA1 shows a strong binding affinity and high selectivity over SA. Herein, due to the presence of amino group (–NH2) in TPBA1 and carboxylic acid group (–COOH) in SA, we further examined whether electrostatic interaction between them contributes to the high selectivity of TPBA1 over SA. Commercial available galacturonic acid (Fig. 3A), a derivative of galactose with –COOH, was added to the TPBA1 aqueous solution and the fluorescence intensity change was monitored. As shown in Fig. 3D, TPBA1 shows a much weaker binding affinity with galacturonic acid compared to SA. This result suggests that the specific recognition between the boronic acid group and the 1,2 cis-diol structure is the main driving force for the high selectivity of TPBA1 over SA. Assuming the formation of a 1![[thin space (1/6-em)]](https://www.rsc.org/images/entities/char_2009.gif) :1 complex,38 the association constant (Ka) between TPBA1 and SA can be calculated as ∼327.8 M−1 (Fig. 3E).
:1 complex,38 the association constant (Ka) between TPBA1 and SA can be calculated as ∼327.8 M−1 (Fig. 3E).
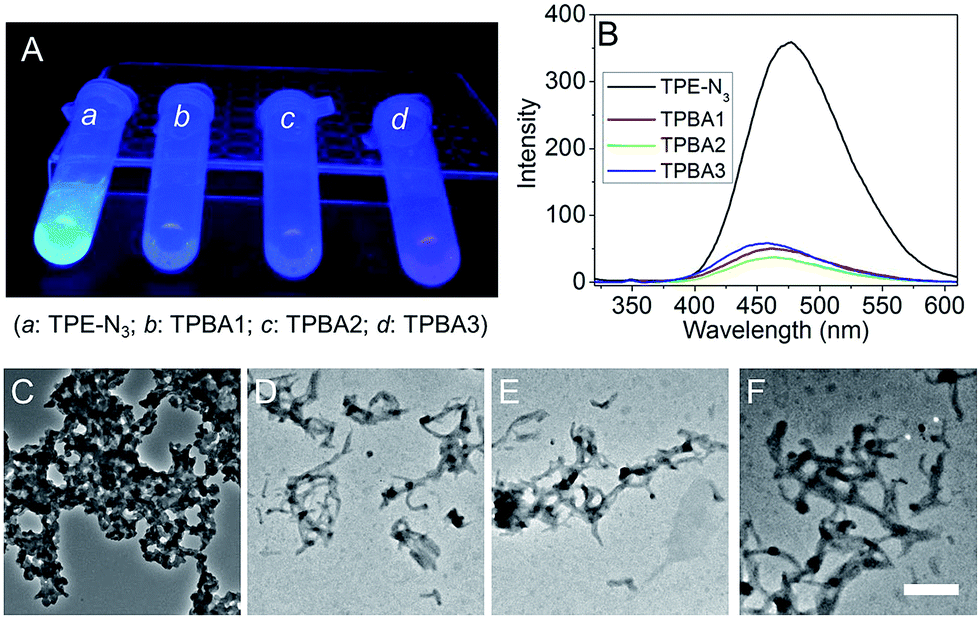 | ||
| Fig. 2 (A and B) Fluorescent image (A) and emission spectra (B) of TPE-N3 (1 μM) and TPBAs (5 μM) in aqueous solution. (C–F) TEM images of TPE-N3 (C) in aqueous solution at a concentration of 1 μM, and TPBA1 (D), TPBA2 (E) and TPBA3 (F) in aqueous solution at a concentration of 5 μM. Scale bar 500 nm. | ||
 | ||
| Fig. 3 (A) Molecular structures of SA, galactose, glucose, mannose, and galacturonic acid. (B) Emission spectra of the mixture of TPBA1 (20 μM) aqueous solution and SA at different concentrations. (C) TEM image of the mixture of TPBA1 (20 μM) and SA (20 mM) in aqueous solution. (D) The maximum fluorescence intensity change of TPBAs (20 μM) aqueous solution upon the addition of SA, galactose, glucose, mannose, and galacturonic acid. (E) Fluorescence intensity change of TPBA1 aqueous solution upon the addition of different amount of SA. I0 is the fluorescence intensity of the aqueous solution of TPBAs (20 μM). ΔI is the fluorescence intensity change of the aqueous solution of TPBAs upon the addition of different carbohydrates (20 mM). | ||
After screening the fluorescent probe (TPBA1) with strong binding affinity and high selectivity over SA, we chose human hepatic cancer cells (HepG2) to evaluate its ability to targeted label and image cancer cells. The expression of SA on HepG2 cells was examined by using SA-specific fluorescein 5(6)-isothiocyanate (FITC)-labelled lectin.39 As shown in Fig. 4A, the bright green fluorescence corresponds to the high expression of SA on the membrane. In contrast, the SA is lowly expressed on the normal liver tissue cells (AML-12, Fig. 4B). The results of flow cytometry analysis (Fig. 4C and D) show that the expression of SA on HepG2 cells is around 6-fold higher than that of AML-12 cells. After the determination of the over-expression of SA on HepG2 cells, TPBA1 was incubated with the cells to evaluate its ability to use AIE characteristic for fluorescent imaging of cancer cells. To avoid the influence of self-assembled nanofibers (Fig. 3D) on the cell imaging, the TPBA1 solution (5 μM) was filtered by using 100 nm filter membrane and then incubated with the HepG2 cells. Fig. 4E–G show the confocal laser scanning microscopy (CLSM) images of the cells incubated with TPBA1 for different time intervals. After incubating with TPBA1 for 2 min, besides few of internalized molecules, most of the TPBA1 molecules are bound on the cell surface to form a uniform ring-shaped fluorescence pattern (Fig. 4E). Increasing the incubation time to 5 min, the cellular fluorescence is enhanced and the vast majority of TPBA1 molecules still remain on the cell surface (Fig. 4F). However, after incubation for 10 min, most of TPBA1 molecules have been internalized to form clusters with bright fluorescence. Further elongating the incubation time to 15 or 30 min does not change the distribution pattern of TPBA1 molecules (Fig. S8, ESI†). All these results suggest that the cell surface SA plays an important role to transport the TPBA1 molecules bound on cell surface. To demonstrate this statement, the HepG2 cells were first fixed with 4% formaldehyde and then incubated with the TPBA1 for 10 min. As shown in Fig. 4H, almost all the TPBA1 molecules are bound on the cell surface. In addition, without the aid of SA to transport the TPBA1 molecules, the fluorescence intensity is much lower than that of unfixed cells (Fig. 4K and L). Our findings agree with the previous reports that sialylated moieties are organized on the cell membrane and reside in the intracellular organelles along the exocytotic and endocytic pathways.39–41 To demonstrate that the labelling and imaging of the cancer cells is built on the aggregation of TPBA1 resulting from specific recognition between the SA and boronic group, TPBA1 was incubated with HepG2 cells that are pre-treated by lectin. As exhibited in Fig. 4I, due to the blocking of SA by lectin, only a minority of TPBA1 molecules can be untaken and the intracellular fluorescence intensity is more than 3-fold weaker than that of the cells without lectin treatment (Fig. 4K and L). If replacing the HepG2 cells with AML-12 cells with low SA expression (Fig. 4J), due to the absence of specific recognition between SA and boronic acid group, very weak fluorescence can be observed and there is no significant difference with the lectin pre-treated HepG2 cells (Fig. 4K and L). All these results strongly demonstrate that TPBA1 can specifically label and image cancer cells and this ability is built on the specific recognition between cell-surface SA and the boronic acid.
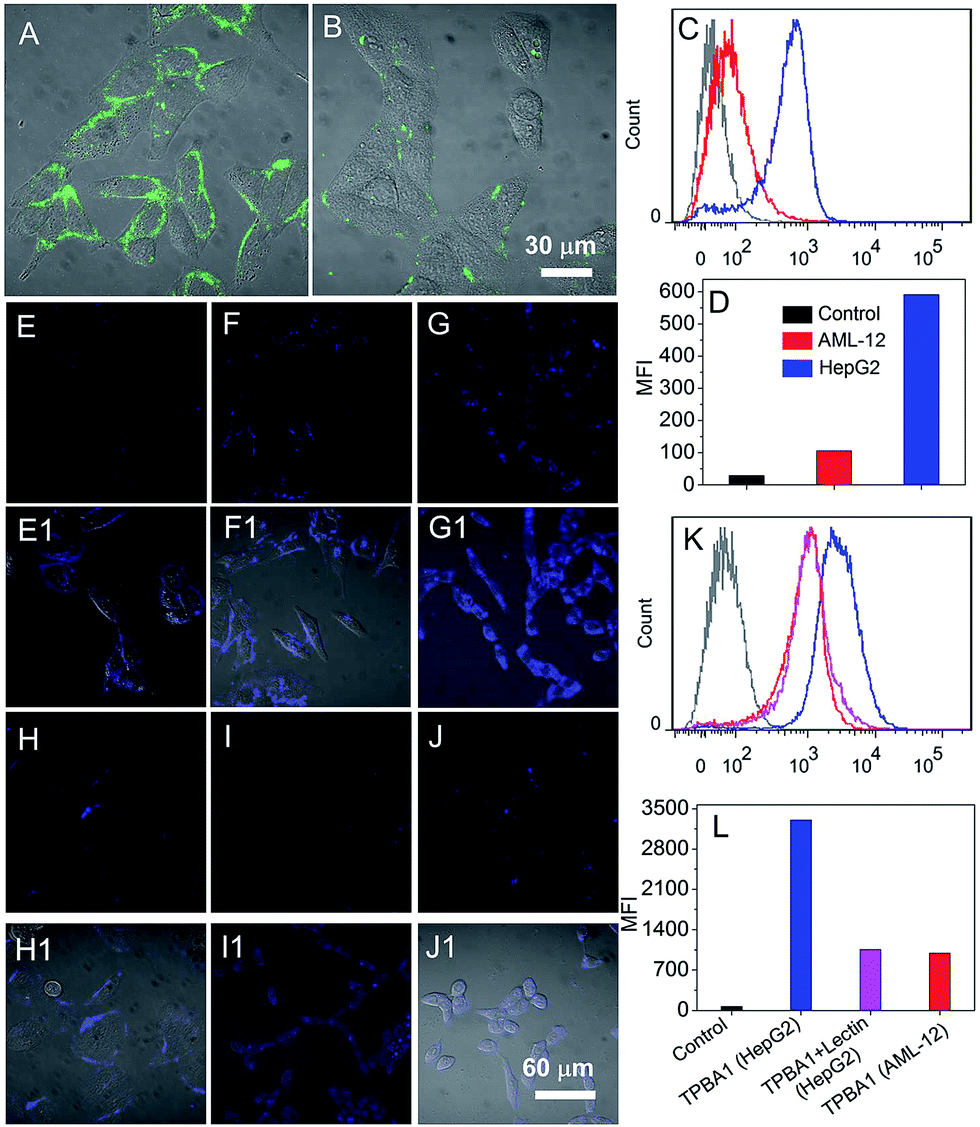 | ||
| Fig. 4 (A and B) CLSM images of HepG2 (A) and AML-12 (B) cells incubated with FITC-labelled lectin. (C and D) Flow cytometry profile (C) and MFI (D) of HepG2 and AML-12 cells incubated with FITC-labelled lectin. (E–H) CLSM images of HepG2 cells incubated with TPBA1 for 2 min (E), 5 min (F) and 10 min (G), and fixed HepG2 cells incubated with TPBA1 for 10 min (H). (I and J) CLSM image of lectin pre-treated HepG2 (I) and AML-12 (J) cells incubated with TPBA1 for 10 min. (K and L) Flow cytometry profile (K) and MFI (L) of HepG2, fixed HepG2 and AML-12 cells incubated with TPBA1 for 10 min. HepG2 and AML-12 cells were acquired from China Center for Typical Culture Collection (Wuhan, China), and were incubated in DMEM medium containing 10% FBS and 1% antibiotics at 37 °C in humidified atmosphere with 5% CO2. DMEM, FBS, and antibiotics (penicillin–streptomycin) were obtained from Invitrogen Corp. | ||
In conclusion, we have designed and prepared three TPE-tagged peptidyl boronic acids (TPBAs1–3) with AIE characteristics. Due to the high selectivity over cancer-associated SA via the specific recognition between SA and boronic acid group, TPBA1 shows the ability to targeted label and image cancer cells.
Acknowledgements
This work was supported by the National Natural Science Foundation of China (21204068) and China Postdoctoral Science Foundation (2012M511250).Notes and references
- M. M. Fuster, J. R. Brown, L. Wang and J. D. Esko, Cancer Res., 2003, 63, 2775–2781 CAS.
- T. Jørgensen, A. Berner, O. Kaalhus, K. J. Tveter, H. E. Danielsen and M. Bryne, Cancer Res., 1995, 55, 1817–1819 Search PubMed.
- B. W. Weston, K. M. Hiller, J. P. Mayben, G. A. Manousos, K. M. Bendt, R. Liu and J. C. Cusack, Cancer Res., 1999, 59, 2127–2135 CAS.
- D. H. Dube and C. R. Bertozzi, Nat. Rev. Drug Discovery, 2005, 4, 477–488 CrossRef CAS PubMed.
- M. A. Hollingsworth and B. J. Swanson, Nat. Rev. Cancer, 2004, 4, 45–60 CrossRef CAS PubMed.
- N. Kui Wong, R. L. Easton, M. Panico, M. Sutton-Smith, J. C. Morrison, F. A. Lattanzio, H. R. Morris, G. F. Clark, A. Dell and M. S. Patankar, J. Biol. Chem., 2003, 278, 28619–28634 CrossRef PubMed.
- G. Marquina, H. Waki, L. E. Fernandez, K. Kon, A. Carr, O. Valiente, R. Perez and S. Ando, Cancer Res., 1996, 56, 5165–5171 CAS.
- P. Carter, Nat. Rev. Cancer, 2001, 1, 118–129 CrossRef CAS PubMed.
- R. S. Dronca and H. Dong, Clin. Cancer Res., 2015, 21, 944–946 CrossRef CAS PubMed.
- M. v. Mehren, G. P. Adams and L. M. Weiner, Annu. Rev. Med., 2003, 54, 343–369 CrossRef PubMed.
- R. Jelinek and S. Kolusheva, Chem. Rev., 2004, 104, 5987–6016 CrossRef CAS PubMed.
- P. J. Hudson and C. Souriau, Nat. Med., 2003, 9, 129–134 CrossRef CAS PubMed.
- K. L. Bicker, J. Sun, J. J. Lavigne and P. R. Thompson, ACS Comb. Sci., 2011, 13, 232–243 CrossRef CAS PubMed.
- T. D. James, K. R. A. Samankumara Sandanayake and S. Shinkai, Nature, 1995, 374, 345–347 CrossRef CAS.
- J. J. Lavigne and E. V. Anslyn, Angew. Chem., Int. Ed., 1999, 38, 3666–3669 CrossRef CAS PubMed.
- W. Zhai, X. Sun, T. D. James and J. S. Fossey, Chem.–Asian J., 2015, 10, 1836–1848 CrossRef CAS PubMed.
- W. Yang, X. Gao and B. Wang, Med. Res. Rev., 2003, 23, 346–368 CrossRef CAS PubMed.
- M. Dowlut and D. G. Hall, J. Am. Chem. Soc., 2006, 128, 4226–4227 CrossRef CAS PubMed.
- N. Y. Edwards, T. W. Sager, J. T. McDevitt and E. V. Anslyn, J. Am. Chem. Soc., 2007, 129, 13575–13583 CrossRef CAS PubMed.
- Y. Zou, D. L. Broughton, K. L. Bicker, P. R. Thompson and J. J. Lavigne, ChemBioChem, 2007, 8, 2048–2051 CrossRef CAS PubMed.
- S. Jin, Y. Cheng, S. Reid, M. Li and B. Wang, Med. Res. Rev., 2010, 30, 171–257 CAS.
- X. Sun, W. Zhai, J. S. Fossey and T. D. James, Chem. Commun., 2016, 52, 3456–3469 RSC.
- J. Luo, Z. Xie, J. W. Y. Lam, L. Cheng, H. Chen, C. Qiu, H. S. Kwok, X. Zhan, Y. Liu, D. Zhu and B. Z. Tang, Chem. Commun., 2001, 1740–1741 RSC.
- Y. Hong, J. W. Y. Lam and B. Z. Tang, Chem. Commun., 2009, 4332–4353 RSC.
- Y. Hong, J. W. Y. Lam and B. Z. Tang, Chem. Soc. Rev., 2011, 40, 5361–5388 RSC.
- H. Shi, R. T. K. Kwok, J. Liu, B. Xing, B. Z. Tang and B. Liu, J. Am. Chem. Soc., 2012, 134, 17972–17981 CrossRef CAS PubMed.
- H. Shi, J. Liu, J. Geng, B. Z. Tang and B. Liu, J. Am. Chem. Soc., 2012, 134, 9569–9572 CrossRef CAS PubMed.
- Y. Liu, C. Deng, L. Tang, A. Qin, R. Hu, J. Z. Sun and B. Z. Tang, J. Am. Chem. Soc., 2011, 133, 660–663 CrossRef CAS PubMed.
- W. Wang, X. Gao and B. Wang, Curr. Org. Chem., 2002, 6, 1285–1317 CrossRef CAS.
- W. Yang, H. Fan, X. Gao, S. Gao, V. V. R. Karnati, W. Ni, W. B. Hooks, J. Carson, B. Weston and B. Wang, Chem. Biol., 2004, 11, 439–448 CrossRef CAS PubMed.
- C.-S. Chen, X.-D. Xu, Y. Wang, J. Yang, H.-Z. Jia, H. Cheng, C.-C. Chu, R.-X. Zhuo and X.-Z. Zhang, Small, 2013, 9, 920–926 CrossRef CAS PubMed.
- X.-D. Xu, Y.-F. Chu, C.-S. Chen, J.-X. Chen, S.-X. Cheng, X.-Z. Zhang and R.-X. Zhuo, Small, 2011, 7, 2201–2209 CrossRef CAS PubMed.
- H. Cheng, Y.-J. Cheng, S. Bhasin, J.-Y. Zhu, X.-D. Xu, R.-X. Zhuo and X.-Z. Zhang, Chem. Commun., 2015, 51, 6936–6939 RSC.
- X.-D. Xu, B.-B. Lin, J. Feng, Y. Wang, S.-X. Cheng, X.-Z. Zhang and R.-X. Zhuo, Macromol. Rapid Commun., 2012, 33, 426–431 CrossRef CAS PubMed.
- Z. Yang, G. Liang and B. Xu, Acc. Chem. Res., 2008, 41, 315–326 CrossRef CAS PubMed.
- R. V. Ulijn and A. M. Smith, Chem. Soc. Rev., 2008, 37, 664–675 RSC.
- L. Mao, H. Wang, M. Tan, L. Ou, D. Kong and Z. Yang, Chem. Commun., 2012, 48, 395–397 RSC.
- S. Fery-Forgues, M. T. Le Bris, J. P. Guette and B. Valeur, J. Phys. Chem., 1988, 92, 6233–6237 CrossRef CAS.
- A. Liu, S. Peng, J. C. Soo, M. Kuang, P. Chen and H. Duan, Anal. Chem., 2011, 83, 1124–1130 CrossRef CAS PubMed.
- Y. Zeng, T. N. C. Ramya, A. Dirksen, P. E. Dawson and J. C. Paulson, Nat. Methods, 2009, 6, 207–209 CrossRef CAS PubMed.
- X.-D. Xu, H. Cheng, W.-H. Chen, S.-X. Cheng, R.-X. Zhuo and X.-Z. Zhang, Sci. Rep., 2013, 3, 2679 Search PubMed.
Footnotes |
| † Electronic supplementary information (ESI) available: Synthesis and characterization. See DOI: 10.1039/c6ra25674k |
| ‡ These authors contributed equally to this work. |
| This journal is © The Royal Society of Chemistry 2017 |