 Open Access Article
Clean G-SERF an NMR experiment for the complete eradication of axial peaks and undesired couplings from the complex spectrum†
Sandeep Kumar Mishra,
N. Lokesh and
N. Suryaprakash*
NMR Research Centre, Solid State and Structural Chemistry Unit, Indian Institute of Science, Bangalore-560012, India. E-mail: nsp@sif.iisc.ernet.in; Fax: +91 80 23601550; Tel: +91 80 22933300
First published on 3rd January 2017
Abstract
The G-SERF and other related experiments are very useful in the measurement of proton–proton couplings from the overlapped spectrum. However, they suffer from the presence of intense axial peaks and undesirable couplings in the spectra, thereby creating ambiguity in the assignment of peaks and subsequent measurement of 1H–1H couplings. In the present study we are reporting a new two dimensional NMR experiment cited as Clean-G-SERF, which is able to suppress all the axial peaks and unwanted couplings, while retaining only the couplings to the selectively excited proton. The method permits unambiguous assignment of peaks to the coupled partners of the selectively excited proton and enables the accurate measurement of couplings.
Introduction
The proton–proton scalar coupling information is extremely important in the conformational, stereochemical and structure elucidation of organic and bio-molecules.1,2 In small molecules, the conventional 1D 1H spectrum is adequate for the measurement of nJHH. However, for bigger molecules the spectral complexity arises due to interaction among a large number of coupled spins, and different strengths of couplings, in addition to poorly dispersed chemical shifts. The problem gets aggravated while studying the reaction mixture due to the presence of a number of diverse molecules. Any or all such situations hinder the accurate measurement of nJHH from the conventional 1D 1H spectrum. Number of experiments has been reported for the precise measurement of scalar couplings, viz., J-upscaling in COSY spectrum3 which yields enhanced resolution and sensitivity in the indirect dimension by the cancellation of antiphase terms. Recently real time J-upscaling4 technique has been reported, which is applicable for the extraction of small couplings of an individual spin which experience multiple couplings, but has limitation as far as the measurement of couplings from the complex and overlapped spectra is concerned. The well-known 2D COSY5 and J-resolved based experiments6 partially overcome such problems. However, often they fail to yield accurate coupling values, when the peaks are severely overlapped and the multiplicity pattern is complex. The 2D SERF7 (selective refocusing) experiment overcomes such a problem to a large extent by retaining only one of the desired couplings in the spectrum permitting the accurate and unambiguous assignment of peaks of the coupled partner, thereby enabling the precise measurement of coupling. Nevertheless, the SERF experiment consequent to its nature of allowing the measurement of a single coupling from each experiment requires multiple measurements demanding considerable investment of the instrument time. Gradient encoded SERF experiment (G-SERF),8 circumvents this problem as it provides access to all the couplings of a selected spin from a single experiment. Reported PCR-COSY9 for nJHH measurement also suffers from the problems of resolution and sensitivity. The Push-G-SERF10 increases the resolution of the spectrum by removing the couplings in the chemical shift dimension. The PSYCHEDELIC11 experiment wherein the data is acquired in a three dimensional fashion not only achieves the resolution by decoupling in the direct dimension but also enhances the sensitivity. The real time based one dimensional Quick-G-SERF12 technique provides information analogous to that of G-SERF, but in a much shorter time. However, this method has a drawback in the measurement of couplings of smaller magnitudes. A pure shift based J-edited technique provides the clean 1D spectrum but requires tedious process of data acquisition and unconventional way of processing.13 The major problem in all the slice selective NMR experiments is low sensitivity since effectively very small percentage of total proton spins are utilized in the individual slices, while the major part of total available spins is left unutilized. This problem has already been addressed14 in one dimensional and many two dimensional sequences including G-SERF. The J-resolved based 2D methods, such as, G-SERF, the combination of real time pure shift15 and G-SERF known as Push-G-SERF10 and PSYCHE16 based PSYCHEDELIC11 retain more intense peaks from un-evolved couplings during t1 period, known as axial peaks. These axial peaks do not give any additional information, but can merge with peaks of smaller coupling strengths, posing a challenge for the assignment of peaks and extraction of couplings. In addition, the G-SERF, PSYCHEDELIC and Push-G-SERF experiments also retain unwanted couplings that arise due to coupled protons that have close chemical shifts, which are not resolved by gradient slices and the soft pulses contained in the respective pulse sequences. Such couplings can also create a lot of confusion, in the assignment of peaks to a selected proton and the situations of this type arise more often due to small chemical shift dispersion of protons. A recent review provides the detailed account of the advantages and drawbacks of the available homonuclear broadband decoupling techniques and their applications.17In the present study we are introducing a novel technique cited as Clean-G-SERF (axial peaks free gradient-encoded selective refocusing) with the main focus on the eradication of such axial peaks and the peaks arising from uncoupled protons. The pulse sequence involves the manipulation of spin dynamics in such a way that the magnetization of scalar couplings from a selected proton is efficiently filtered before t1 evolution, while the magnetization from the remaining spins is completely suppressed, which otherwise would have appeared as axial peaks. The resultant spectrum retains only the peaks from the coupled partners to the chosen proton, which significantly aids in the unambiguous assignment of peaks and the subsequent measurement of couplings even from the crowded regions of the spectrum. Another distinct advantage of the present method is the eradication of undesired couplings that evolve due to closely resonating protons that are coupled among themselves, which may or may not be coupled to the selectively excited proton, and are unresolvable both by gradient slices or soft pulses. The experiment finds utility in many chemical applications, viz., in the measurement of small couplings from the crowded spectrum of the complex molecules and in the reaction mixture containing diverse molecules where there is severe signal overlap in both the aliphatic and aromatic regions.
Results and discussion
Applications
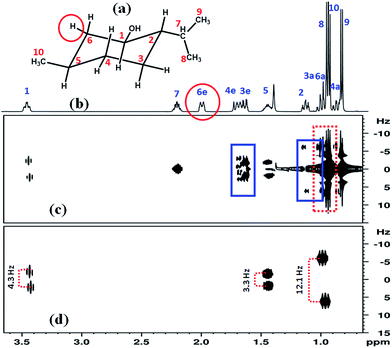
It is clearly evident from the G-SERF spectrum that very intense axial peaks belonging to the uncoupled protons create confusion in the identification of peaks and the subsequent measurement of couplings. The spectrum also displays additional peaks, identified by blue rectangles (Fig. 1(c)), arising due to the small chemical shift difference between two protons coupled among themselves, but are not coupled to the selected proton. These undesirable extra peaks create ambiguity among the peaks of the uncoupled and coupled partners of the selected proton. The equatorial proton of backbone numbered 6 has three coupled partners, i.e. 6a (0.97 ppm, axial proton at position 6), proton at position 5 (1.44 ppm) and proton at position 1 (3.43 ppm) marked in Fig. 1(a). From the G-SERF experiment the couplings of 6e with protons 1 and 5 can conveniently be measured, but the 6a peak is severely overlapped with the strong axial peaks of protons 3a, 8 and 10 preventing its assignment as well as measurement of coupling [identified by dotted red rectangle]. On the other hand, the present Clean-G-SERF experiment completely nullifies all the axial peaks and unwanted couplings while retaining only the peaks from the coupled partners, which is clearly evident just by the visual inspection of the spectrum (Fig. 1(d)). The measured couplings are reported in Fig. 1(d).
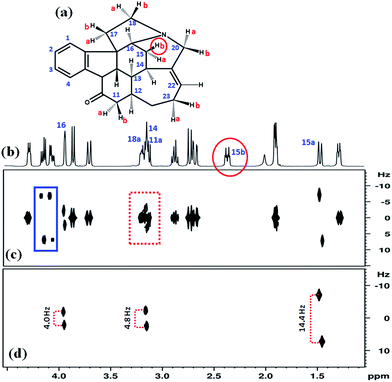
In the G-SERF8 spectrum reported in Fig. 2(c) the coupled partner of this selected proton resonating at 3.15 ppm exhibits severe overlap with the axial peaks from other protons, which is identified by dotted red rectangle. The unwanted peaks near 4.1–4.2 ppm identified by blue rectangle create confusion in the recognition of peaks arising due to couplings with the selected proton. These unwanted couplings are arising from the two coupled protons which are resonating very close to each other in the NMR spectrum and cannot be resolved by slice selective gradients and the used soft pulses. This type of situation is encountered very often in the proton spectrum of many organic molecules due to very small dispersion of chemical shifts. The distinct advantage of the Clean-G-SERF is clearly evident from the Fig. 2(d), where all the unwanted couplings and axial peaks are completely eradicated (Fig. 2(d)), while retaining only the couplings associated with that of selected proton 15b.
![[thin space (1/6-em)]](https://www.rsc.org/images/entities/char_2009.gif) :
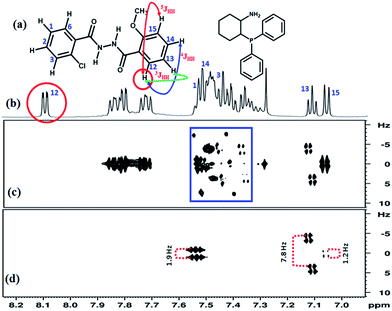
:![[thin space (1/6-em)]](https://www.rsc.org/images/entities/char_2009.gif) 1 molar ratio) in the solvent CDCl3 are reported in Fig. 3(a) and (b) respectively. The severe overlap of peaks in the region 7.3–7.5 ppm is clearly evident from the Fig. 3(b). The G-SERF spectrum for this region exhibits several unwanted couplings and also axial peaks, which are identified by blue rectangle. In this spectrum it is challenging to distinguish the peaks from the coupled partners of proton 12 in 2-chloro-N′-(2-methoxybenzoyl)benzohydrazide. On the other hand, by applying the present technique all the unwanted peaks have been completely wiped out, providing very clean doublets from which the 4JHH between protons 12 and 15 of methoxy substituted aromatic ring could be precisely measured. All the three couplings, 2JHH, 3JHH and 4JHH with its coupled partner are identified in the Clean-G-SERF spectrum reported in Fig. 3(d). On careful inspection one can see that each peak of the doublet corresponding to proton 13 further appears as a doublet in the indirect dimension and the multiplet pattern appears like a doublet of doublet (dd). It has already been reported in our previous study that these are the peaks arising from two different conformers of 2-chloro-N′-(2-methoxybenzoyl)benzohydrazide molecule in the solution.18 The coupling measured for one of the conformers is marked in Fig. 3(d) and its value is 7.8 Hz.
1 molar ratio) in the solvent CDCl3 are reported in Fig. 3(a) and (b) respectively. The severe overlap of peaks in the region 7.3–7.5 ppm is clearly evident from the Fig. 3(b). The G-SERF spectrum for this region exhibits several unwanted couplings and also axial peaks, which are identified by blue rectangle. In this spectrum it is challenging to distinguish the peaks from the coupled partners of proton 12 in 2-chloro-N′-(2-methoxybenzoyl)benzohydrazide. On the other hand, by applying the present technique all the unwanted peaks have been completely wiped out, providing very clean doublets from which the 4JHH between protons 12 and 15 of methoxy substituted aromatic ring could be precisely measured. All the three couplings, 2JHH, 3JHH and 4JHH with its coupled partner are identified in the Clean-G-SERF spectrum reported in Fig. 3(d). On careful inspection one can see that each peak of the doublet corresponding to proton 13 further appears as a doublet in the indirect dimension and the multiplet pattern appears like a doublet of doublet (dd). It has already been reported in our previous study that these are the peaks arising from two different conformers of 2-chloro-N′-(2-methoxybenzoyl)benzohydrazide molecule in the solution.18 The coupling measured for one of the conformers is marked in Fig. 3(d) and its value is 7.8 Hz.
![[thin space (1/6-em)]](https://www.rsc.org/images/entities/char_2009.gif) :
:![[thin space (1/6-em)]](https://www.rsc.org/images/entities/char_2009.gif) 1
1![[thin space (1/6-em)]](https://www.rsc.org/images/entities/char_2009.gif) :
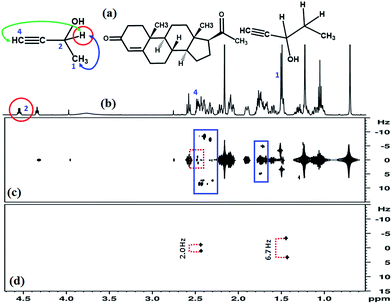
:![[thin space (1/6-em)]](https://www.rsc.org/images/entities/char_2009.gif) 1 molar ratio. The proton 2 (identified by red circle) resonating at 4.54 ppm in Fig. 4(b) was chosen for the extraction of couplings associated with it. The spectrum of this molecule has severe crowding of peaks in the aliphatic region. The G-SERF8 spectrum given in Fig. 4(c) reveals intense axial peaks and several unwanted couplings at 1.7 and between 2.4–2.5 ppm which are identified by blue rectangles. The 4JHH between protons 2 and 4 is 2.0 Hz, which is identified by a dotted red rectangle. It has appeared with other couplings and is very difficult to distinguish. On the other hand, the Clean-G-SERF spectrum reported in Fig. 4(d) contains only the peaks from the coupled partners of proton 2. The long range couplings, 3JHH and 4JHH with their coupled partner could easily be identified and accurately measured from the Fig. 4(d). It may be pointed out that the present concept of removal of the axial peaks can also be implemented in other similar experiments, such as, Push-G-SERF, PSYCHEDELIC, etc.
1 molar ratio. The proton 2 (identified by red circle) resonating at 4.54 ppm in Fig. 4(b) was chosen for the extraction of couplings associated with it. The spectrum of this molecule has severe crowding of peaks in the aliphatic region. The G-SERF8 spectrum given in Fig. 4(c) reveals intense axial peaks and several unwanted couplings at 1.7 and between 2.4–2.5 ppm which are identified by blue rectangles. The 4JHH between protons 2 and 4 is 2.0 Hz, which is identified by a dotted red rectangle. It has appeared with other couplings and is very difficult to distinguish. On the other hand, the Clean-G-SERF spectrum reported in Fig. 4(d) contains only the peaks from the coupled partners of proton 2. The long range couplings, 3JHH and 4JHH with their coupled partner could easily be identified and accurately measured from the Fig. 4(d). It may be pointed out that the present concept of removal of the axial peaks can also be implemented in other similar experiments, such as, Push-G-SERF, PSYCHEDELIC, etc.
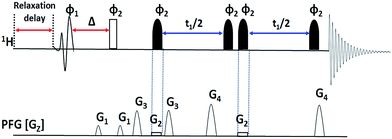
The present pulse sequence can be discussed into two parts. The first part is the excitation block (selective 90° – delay Δ – hard 90° pulse), and the second part is the conventional G-SERF block. The initial pulse block is vital in avoiding undesired couplings and axial peaks. It is a selective COSY type sequence, which correlates selective proton magnetization with only coupled protons (similar to 1D selective COSY) which is detected and appears as the spectrum. The initial block starts with a 90° selective pulse to ensure selective excitation of a proton followed by delay (Δ) and 90° hard pulse to transfer magnetization selectively to the coupled protons. Thus the excitation block in Clean-G-SERF retains only desired proton unlike G-SERF where all the protons are excited (desired and undesired), which is illustrated in the Scheme 1.
 | ||
| Scheme 1 Describes difference in excitation, evolution and spectra appearance between G-SERF and Clean-G-SERF experiment in chosen molecule. | ||
The resultant magnetization (which is free from axial peaks and undesired couplings) is fed to the next part of the sequence (conventional G-SERF). Hence only the filtered magnetization is encoded spatially by the application of 180° selective pulse with very weak field gradient field making it slice selective, which is then followed by t1 evolution. During t1 evolution, only the couplings from protons interacting with the selected proton are allowed to evolve by the application of 180° selective pulse with very weak field gradient and another selective 180° pulse on the chosen proton. The application of this 180° selective pulse ensures refocusing of the chemical shift of selected proton during t1 evolution. Since unlike G-SERF here other protons are not excited and hence no axial peaks and other undesired peaks are observed. The value of Δ should be optimized for different molecules and the optimization process is discussed in the later part of the manuscript.
−Iy![[thin space (1/6-em)]](https://www.rsc.org/images/entities/char_2009.gif) cos(ΩΔ)cos(πJΔ) + 2IxSz cos(ΩΔ)cos(πJΔ) + 2IxSz![[thin space (1/6-em)]](https://www.rsc.org/images/entities/char_2009.gif) cos(ΩΔ)sin(πJΔ) cos(ΩΔ)sin(πJΔ) |
+Ix![[thin space (1/6-em)]](https://www.rsc.org/images/entities/char_2009.gif) sin(ΩΔ)cos(πJΔ) − 2IySz sin(ΩΔ)cos(πJΔ) − 2IySz![[thin space (1/6-em)]](https://www.rsc.org/images/entities/char_2009.gif) sin(ΩΔ)sin(πJΔ) sin(ΩΔ)sin(πJΔ) |
−Iz![[thin space (1/6-em)]](https://www.rsc.org/images/entities/char_2009.gif) cos(ΩΔ)cos(πJΔ) − 2IxSy cos(ΩΔ)cos(πJΔ) − 2IxSy![[thin space (1/6-em)]](https://www.rsc.org/images/entities/char_2009.gif) cos(ΩΔ)sin(πJΔ) cos(ΩΔ)sin(πJΔ)
| (1) |
+Ix![[thin space (1/6-em)]](https://www.rsc.org/images/entities/char_2009.gif) sin(ΩΔ)cos(πJΔ) + 2IzSy sin(ΩΔ)cos(πJΔ) + 2IzSy![[thin space (1/6-em)]](https://www.rsc.org/images/entities/char_2009.gif) sin(ΩΔ)sin(πJΔ) sin(ΩΔ)sin(πJΔ)
| (2) |
Eqn (1) contains the zero and double quantum terms, which are discarded by using gradients and thus we only have the resultant terms of the magnetization that is passing through the conventional G-SERF block.
+Ix![[thin space (1/6-em)]](https://www.rsc.org/images/entities/char_2009.gif) sin(ΩΔ)cos(πJΔ) + 2IzSy sin(ΩΔ)cos(πJΔ) + 2IzSy![[thin space (1/6-em)]](https://www.rsc.org/images/entities/char_2009.gif) sin(ΩΔ)sin(πJΔ) sin(ΩΔ)sin(πJΔ) |
The similar terms will also be observed for the other coupled partners of the selected spin and the spins apart from these do not appear in the spectrum.
Experimental
All the investigated molecules except 2-chloro-N′-(2-methoxybenzoyl)benzohydrazide were purchased from sigma Aldrich and used as received. The molecule 2-chloro-N′-(2-methoxybenzoyl)benzohydrazide was synthesized in our laboratory and the procedure for synthesis has already been reported.18 Concentration of samples was approximately 15 mM in the solvent CDCl3, for each molecule, as well as the mixture. The reported spectra from Clean-G-SERF as well as from G-SERF were obtained by keeping all the common experimental parameters identical for both the experiments. All the spectra were recorded on a 500 MHz NMR spectrometer using a triple resonance probe with inverse X nuclei (TXI) at ambient temperature (298 K).The acquisition parameters used for all the individual molecules and the molecular mixtures in G-SERF and Clean-G-SERF experiments are tabulated in the ESI.† The spectral width in the indirect dimension for all the experiments was 80 Hz and the time domain points for different molecules were different. Hence the digital resolution is not identical for all the spectra. The data was processed in magnitude mode which results in some line broadening in the spectra, analogous to the G-SERF experiment.
Optimization of delta (Δ)
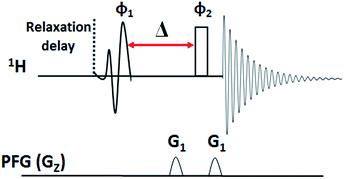
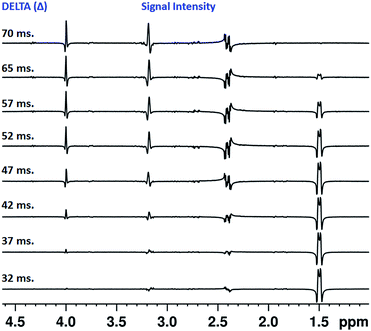
The value of Δ can be different for different molecules and also for different protons in a molecule depending on the strengths of couplings with its partners, and hence required to be optimized before starting the actual experiment. For optimization in the present experiments, the pulse sequence given in Fig. 6 was employed. Initially the Δ value was set to 10 ms and varied until the signal intensities were maximum and comparable. The number of dummy scans was set to 2 and total number of accumulations was set to 2. The homospoil z only gradient; G1 = 15% was used. The selective π/2 pulse for excitation was EBurp, and the same pulse length was used in the Clean-G-SERF experiment.The Fig. 7 represents the stack plot of different 1D 1H spectra of the molecule strychnine acquired using pulse sequence given in Fig. 6. The intensities of the coupled partners of selected proton vary on altering the delay Δ. The optimum value of Δ for the Clean-G-SERF experiment was chosen when the signal intensities for all the coupled partners were maximum and nearly equal. From Fig. 7 one can clearly see that for Δ value of 32 ms the signal intensities at 3.2 ppm and 4 ppm are very less and on increasing the value to 70 ms the signal of proton resonating at 1.5 ppm almost disappeared. At 52 ms signal intensities are comparable and hence was chosen as the optimum value for this molecule. The similar procedure is required to be followed for optimizing the delay for other molecules.
The optimization of Δ is also advantageous in certain situations where the intensity difference between two peaks is considerably large. In such a situation, the value of Δ can be optimized to selectively manipulate the intensity of a particular peak.
Sensitivity of G-SERF vs. Clean-G-SERF
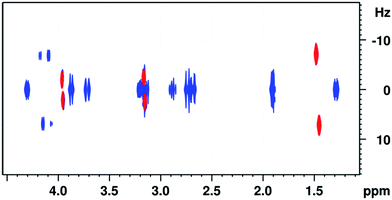
To compare the sensitivity of the present experiment with G-SERF8 sequence we have carried out both the experiments with the identical common parameters and the obtained integral values of the peaks from the G-SERF and Clean-G-SERF are given in ESI (the Tables 2S and 3S† respectively). The obtained ratio of absolute integrals for G-SERF/Clean-G-SERF for the peaks at 1.49, 3.17 and 3.96 ppm are 0.5786, 0.6274 and 0.7498 respectively. On the other hand, when we compare the signal to noise ratio of G-SERF/Clean-G-SERF, these values for peaks at 1.49, 3.17 and 3.96 are 1.40, 1.52 and 1.82 respectively. For visual comparison the superimposed 2D spectra obtained from both G-SERF and Clean-G-SERF is given in Fig. 8.Conclusions
The Clean-G-SERF experiment offers unique solution for the identification of peaks from the coupled partners of a selected proton thereby enabling the measurement of homonuclear couplings in diverse situations. Its superiority over similar experiments in efficient suppression of axial peaks and the unwanted couplings has been convincingly demonstrated. The application of the sequence for deriving the strengths of small couplings from a complex spectrum and from the severely overlapped peaks from the molecular mixtures containing different components has been established. The pulse sequence is simple and the experiment is easy to implement, in addition to providing excellent spectral quality. We have a strong feeling that this experiment might find utility in diverse situations, where the accurate measurement of scalar or residual dipolar couplings is a requirement. It may be pointed out that the smallest coupling measurable from the present experiment, depends on the achievable resolution in the indirect dimension. In the present study, the smallest measured coupling is 1.2 Hz. The present experiment might also find utility in structural, configurational and conformational analysis of natural products, intermediate and products of reaction mixture and the individual or mixture of complex organic molecules.Acknowledgements
SKM would like to thank UGC, New Delhi for Senior Research Fellowship. NS gratefully acknowledges the generous financial support by the Science and Engineering Research Board (SERB), New Delhi (Grant Number: EMR/2015/002263).Notes and references
- (a) M. Eberstadt, G. Gemmecker, D. F. Mierke and H. Kessler, Angew. Chem., Int. Ed., 1995, 34, 1671 (Angew. Chem., 1995, 107, 1813) CrossRef CAS; (b) M. Karplus, J. Am. Chem. Soc., 1963, 85, 2870 CrossRef CASM. Karplus, J. Chem. Phys., 1959, 30, 11 CrossRef CAS; (c) Y. Enomoto-Rogers, H. Masaki, I. Tetsuya, F. Kazuo and I. Tadahisa, Magn. Reson. Chem., 2016, 54, 561 CrossRef CAS PubMed.
- (a) G. Bifulco, P. Dambruoso, L. Gomez-Paloma and R. Riccio, Chem. Rev., 2007, 107, 3744 CrossRef CAS PubMed; (b) R. H. Contreras and J. E. Peralta, Prog. Nucl. Magn. Reson. Spectrosc., 2000, 37, 321 CrossRef CAS; (c) W. A. Thomas, Prog. Nucl. Magn. Reson. Spectrosc., 1997, 30, 183 CrossRef CAS.
- (a) L. R. Brown, J. Mag Res., 1984, 57, 513 (J. Mag. Res., 1984, 57, 513) CAS; (b) R. V. Hosur, K. V. R. Chary and M. Ravi Kumar, Chem. Phys. Lett., 1985, 116, 105 CrossRef CAS.
- S. Glanzer and K. Zangger, J. Am. Chem. Soc., 2015, 137, 5163 CrossRef CAS PubMed.
- (a) C. Griesinger, O. W. Sørensen and R. R. Ernst, J. Am. Chem. Soc., 1985, 107, 6394 CrossRef CAS; (b) C. Griesinger, O. W. Sørensen and R. R. Ernst, J. Chem. Phys., 1986, 85, 6837 CrossRef CAS; (c) R. Brìschweiler, J. C. Madsen, C. Griesinger, O. W. Sørensen and R. R. Ernst, J. Magn. Reson., 1987, 73, 380 Search PubMed.
- (a) W. P. Aue, J. Karhan and R. R. Ernst, J. Chem. Phys., 1976, 64, 4226 CrossRef CAS; (b) D. Marion and K. Wüthrich, Biochem. Biophys. Res. Commun., 1983, 113, 967 CrossRef CAS PubMed; (c) M. Ottiger, F. Delaglio and A. Bax, J. Magn. Reson., 1998, 131, 373 CrossRef CAS PubMed; (d) B. L. Marquez, W. H. Gerwick and R. T. Williamson, Magn. Reson. Chem., 2001, 39, 499 CrossRef CAS.
- T. Facke and S. Berger, J. Magn. Reson., Ser. A, 1995, 113, 114 CrossRef.
- N. Giraud, L. Béguin, J. Courtieu and D. Merlet, Angew. Chem., Int. Ed., 2010, 49, 3481 (Angew. Chem., 2010, 122, 3559) CrossRef CAS PubMed.
- N. Giraud, D. Pitoux, J. M. Ouvrard and D. Merlet, Chem.–Eur. J., 2013, 19, 12221 CrossRef CAS.
- D. Pitoux, B. Plainchont, D. Merlet, Z. Y. Hu, D. Bonnaffe, J. Farjon and N. Giraud, Chem.–Eur. J., 2015, 21, 9044 CrossRef CAS PubMed.
- D. Sinnaeve, M. Foroozandeh, N. Mathias and G. A. Morris, Angew. Chem., Int. Ed., 2016, 55, 1090 CrossRef CAS PubMed.
- (a) N. Lokesh, S. R. Chaudhari and N. Suryaprakash, Chem. Commun., 2014, 50, 15597 RSC; (b) N. Gubensäk, W. M. F. Fabian and K. Zangger, Chem. Commun., 2014, 50, 12254 RSC.
- S. R. Chaudhari and N. Suryaprakash, ChemPhysChem, 2015, 16, 1079 CrossRef CAS PubMed.
- Lokesh and N. Suryaprakash, Chem. Commun., 2014, 50, 8550–8553 RSC.
- N. H. Meyer and K. Zangger, Angew. Chem., Int. Ed., 2013, 52, 7143 CrossRef CAS PubMed.
- M. Foroozandeh, R. W. Adams, N. J. Meharry, D. Jeannerat, N. Mathias and G. A. Morris, Angew. Chem., Int. Ed., 2014, 53, 6990 CrossRef CAS PubMed.
- L. Castañar and T. Parella, Magn. Reson. Chem., 2015, 53, 399 CrossRef PubMed.
- S. K. Mishra and N. Suryaprakash, Phys. Chem. Chem. Phys., 2015, 17, 15226 RSC.
Footnote |
| † Electronic supplementary information (ESI) available. See DOI: 10.1039/c6ra25617a |
| This journal is © The Royal Society of Chemistry 2017 |

