 Open Access Article
Low-dielectric polyimide nanofoams derived from 4,4′-(hexafluoroisopropylidene)diphthalic anhydride and 2,2′-bis(trifluoromethyl)benzidine†
Pengxia Lvab,
Zhixin Dong*a,
Xuemin Daia,
Yong Zhaoab and
Xuepeng Qiu *a
*a
aPolymer Composites Engineering Laboratory, Changchun Institute of Applied Chemistry, Chinese Academy of Sciences, Changchun 130022, P. R. China. E-mail: zxdong@ciac.ac.cn; xp_q@ciac.ac.cn; Fax: +86 431 85262095; Tel: +86 431 85262557
bUniversity of Chinese Academy of Sciences, Beijing 100049, P. R. China
First published on 20th January 2017
Abstract
Low-dielectric polyimide (PI) nanofoams were prepared by introducing nanopores into the PI matrix containing fluorine groups. The nanopores were formed by thermolysis of the thermally labile content, namely, polyethylene glycol (PEG) oligomers, in air. The prepared PI nanofoams were characterized by Fourier transform infrared (FT-IR) spectroscopy, scanning electron microscopy (SEM), thermogravimetric analysis (TGA), dynamic mechanical analysis (DMA), and broadband dielectric spectroscopy. Results indicated that the PI nanofoams showed nanosized closed pores, excellent thermal stability, and a low dielectric constant of 2.12. The dielectric constant of the as-prepared nanofoams was stable within −150 °C to 150 °C. The thermal decomposition process of PEG in the PI matrix was designed and optimized to control the decomposition rate of PEG and the diffusion rate of the decomposition products of PEG. The dielectric constant of the nanofoams significantly decreased from 2.45 to 2.12 as the heating rate decreased from 5 °C min−1 to 1 °C min−1. The as-prepared PI nanofoams exhibited excellent properties and thus could be used in the microelectronics industry as a dielectric layer, multi-chip modules, or integrated circuit chips.
1. Introduction
With the development of information technology and the microelectronics industry, the feature size of microelectronics devices has decreased while the density of wires on chips has increased, leading to circuit loss, signal distortion and delay.1,2 Maex3 reported that interconnect technology is a crucial factor affecting signal delay. These limitations could be resolved by decreasing the dielectric constant of insulation materials.As pointed out by the international semiconductor industry association in the International Technology Roadmap for Semiconductors in 2009,4 the dielectric constant of insulation materials applied in microelectronics devices should be less than 2.0. However, conventional insulation materials, such as SiO2 and Si3N4, exhibit high dielectric constants (3.9 to 4.2). Therefore, ultra-low dielectric materials must be developed for the microelectronics field. Polyimide (PI) materials are high-performance polymer preferred in the microelectronics field because of their excellent mechanical property, thermal stability, chemical stability, adhesion, low water absorption, and dielectric constant.5–7 However, the dielectric constant of traditional PI materials is between 3.0 and 3.4, which is too high to be used as an ultra-low dielectric constant insulator. Therefore, we should reduce the dielectric constant of PI materials. Generally, the dielectric constant of PI materials can be reduced through two methods: introduction of structural units with low molar polarizability or large molar volume to the macromolecular chain and taking of low-dielectric constant media, such as air, into the PI matrix.3,8,9
Since the 1990s, scientists at the research center of IBM have devoted themselves to obtain low-dielectric PI nanofoam materials.10–15 PI nanofoams with low dielectric constant are prepared by incorporating nanopores into the PI matrix after thermolysis of the thermal labile part, which is grafted on the molecular chain or formed block copolymers with PI. Frequently used thermal unstable materials include polystyrene,16 polypropylene oxide (PPO),17–19 polymethylmethacrylate,17,20 polycaprolactone,21 and poly(α-methyl styrene) (PMS),22 which are terminated by amino. All these thermally labile materials are decomposed into volatile small molecules, followed by escape after heating. Han et al.23 and Mehdipour-Ataei et al.24 prepared PI nanofoams with dielectric constant of 2.34 by thermal decomposition of the grafted poly(propylene glycol) (PPG) terminated with bromine. In contrast to grafting of thermally labile materials via amino-termination proposed by IBM, incorporating bromine-terminated PPG did not disturb the macromolecular structure of PI. In Kang's report,25,26 reversible addition–fragmentation chain-transfer polymerization was adopted to graft the thermal labile content on the PI macromolecular chains, followed by thermal decomposition to obtain PI nanofoams. In this method, the molecular weight and distribution of grafted thermal labile polymers could be satisfactorily controlled to produce PI nanofoams with narrow nanopore distribution and low dielectric constant. Zhang et al.27,28 reported a simple method, namely, direct addition of poly(ethylene) oxide to the PI matrix followed by thermolysis to prepare PI nanofoams with good thermal stability and a low dielectric constant of 2.4.
Although PI nanofoams with low dielectric constant can be prepared through various methods, the interactions between the PI matrix and decomposition products of thermal labile content have not been investigated yet; these interactions must be elucidated to avoid the plasticization of the PI matrix caused by decomposition products and the collapse of the nanopores. In the current work, a new simple system was designed and prepared to study the properties of nanofoams. Specifically, PI containing fluorine groups was used as matrix, and polyethylene glycol (PEG) oligomers with average molecular weights of 600 g mol−1 were adopted as thermal labile content to obtain PI nanofoams with low dielectric constant after thermal decomposition. The films foaming processes were designed to control the decomposition rate of the thermally unstable content and the diffusion rate of the decomposition products to investigate the above interactions extensively.
2. Experimental
2.1 Materials
4,4′-(Hexafluoroisopropylidene)diphthalic anhydride (6FDA) and 2,2′-bis(trifluoromethyl)benzidine (TFDB) were purchased from Aldrich and purified via heating and sublimation, respectively. PEG-600 (600 g mol−1 average molecular weight) and acetic anhydride were obtained from Sinopharm Chemical Reagent Co., Ltd. N,N′-Dimethylacetamide (DMAc) and triethylamine were supplied by Tianjin Fengchuan Chemical Co., Ltd. and Tianjin Fuyu Chemical Co., Ltd., respectively. These chemical reagents were used as received without further purification.2.2 Preparation of PI
TFDB (6.4046 g, 0.02 mol) was dissolved in DMAc (92 mL) under nitrogen flow and added with 6FDA (8.8885 g, 0.02 mol) at room temperature. After reaction for 24 h, acetic anhydride (6 mL) and triethylamine (3 mL) were added to the solution and stirred for 12 h. The solution was then poured into absolute ethyl alcohol for precipitation. The precipitates were separated through filtration and washed three times with ethyl alcohol to completely remove the salts. The products were dried in a vacuum oven overnight at 50 °C. The polymerization route of PI is shown in Scheme 1.2.3 Preparation of PI nanofoams
PI powder and PEG-600 were added to a flask with DMAc (10 mL), stirred for 4 h, and sonicated for 2 h. PI solutions with different contents of PEG-600 were coated on glass by a doctor blade and heated at 80 °C for 12 h and at 300 °C for 1 h in nitrogen atmosphere. The films were cooled to room temperature and heated again at 260 °C for 20 h and at 300 °C for 2 h in air to fabricate PI nanofoams.2.4 Characterization
Fourier transform infrared (FTIR) spectra were recorded on a VERTEX 70 spectrometer. Thermogravimetric analysis (TGA) was conducted from room temperature to 800 °C at a heating rate of 10 °C min−1 under nitrogen atmosphere or air atmosphere by using Perkin-Elmer Diamond TG/DTA equipment. Scanning electron microscopy (SEM) was performed at an acceleration voltage of 10 kV to visualize the cross-sectional morphology of the films. Dynamic mechanical analysis (DMA) was conducted on a Rheometric scientific DMTA-V at 1 Hz with a heating rate of 10 °C min−1 within 50 °C to 450 °C. The density of PI nanofoams was determined by a densitometer (YAK01-OD). The dielectric constants of PI nanofoams were measured by a Concept 80 Broadband Dielectric Spectrometer within −150 °C to 150 °C from 1 Hz to 106 Hz. The molecular weights (Mn) and molecular weight distributions (PDI) of the PI/PEG composite and PI nanofoam were determined using gel permeation chromatography (GPC) equipped with a Waters 515 pump, Waters 717 plus autosampler, PL gel MIXED-BLS columns (300 × 7.5 mm, 10 μm) and Waters 2414 differential refractive index detector at 35 °C, with monodispersed polystyrene as the calibration standard. Dimethyl formamide containing 0.1 wt% tetrabutyl-ammonium bromide was used as the eluent at a flow rate of 1.0 mL min−1.3. Results and discussion
3.1 Preparation of PI nanofoams
Typically, PI solutions were prepared by the reaction of TFDB with 6FDA in DMAc, followed by mixing with PEG-600 to obtain PI/PEG composite films. Finally, the composite films were heated to prepare PI nanofoams. Fig. S1a and b† show the FTIR curves of PEG-600 and pure PI film. Comparing the above two curves, the characteristic absorption peaks of PEG-600 and pure PI film were overlapped except the peaks of PEG-600 at 2920 cm−1 and 3400 cm−1, which are attributed to the –CH2– group and adsorbed water in air, respectively. Fig. S1c† presents the characteristic absorption peaks of imide rings at 1726 cm−1 (νsymC![[double bond, length as m-dash]](https://www.rsc.org/images/entities/char_e001.gif) O), 1786 cm−1 (νasymC
O), 1786 cm−1 (νasymC![[double bond, length as m-dash]](https://www.rsc.org/images/entities/char_e001.gif) O), and 1363 cm−1 (νCNimide); the peaks of PEG-600 at 2920 cm−1 (–CH2– group) are well defined, indicating that the PI/PEG composite films were successfully prepared. However, strong absorption bands were observed at 2900 to 3200 cm−1, which are assigned to COOH and NH2 groups (Fig. S1c†); these bands are caused by incomplete imidization of the PI/PEG composite films by the chemical method. Prior to conversion into PI nanofoams, the PI/PEG composite films were heated to be imidized totally in nitrogen atmosphere. Fig. S1d† depicts a peak at 2920 cm−1, which belongs to PEG disappearance. All the characteristic peaks of PI are well defined, indicating successful preparation of PI nanofoams.
O), and 1363 cm−1 (νCNimide); the peaks of PEG-600 at 2920 cm−1 (–CH2– group) are well defined, indicating that the PI/PEG composite films were successfully prepared. However, strong absorption bands were observed at 2900 to 3200 cm−1, which are assigned to COOH and NH2 groups (Fig. S1c†); these bands are caused by incomplete imidization of the PI/PEG composite films by the chemical method. Prior to conversion into PI nanofoams, the PI/PEG composite films were heated to be imidized totally in nitrogen atmosphere. Fig. S1d† depicts a peak at 2920 cm−1, which belongs to PEG disappearance. All the characteristic peaks of PI are well defined, indicating successful preparation of PI nanofoams.
It was reported that in order to obtain the PI nanofoams via the thermolysis method, the thermal decomposition temperature of labile content should be lower than the Tg of the PI resin matrix to obtain PI nanofoams through thermolysis; the temperature of imidization should be lower than the temperature of labile content thermolysis.29 PEG-600 started to decompose at 175 °C in air atmosphere while at 335 °C in nitrogen atmosphere (Fig. S2†). And the Tg and temperature of imidization of the PI matrix (6FDA/TFDB) are 324 °C and 300 °C, respectively, indicating that the PI nanofoams could be prepared by thermolysis of the PI/PEG composites. As shown in Fig. 1, TGA curve of pure PI film displayed one stage, and the curve of the PI/PEG composite film showed two stages of weight loss. According to Fig. S2,† PEG started to decompose at 335 °C in nitrogen atmosphere. The results indicated that the first weight loss stage of the TGA curve of the PI/PEG composite film is associated with the decomposition of the PEG chain, and the other stage is related to the decomposition of the PI backbone. The TGA curve of the PI nanofoam shows one stage of weight loss, and the highest decomposition rate was detected at 600 °C. These findings indicate that the nanofoam has the same decomposition temperature as that of the pure PI film. Hence, PI nanofoams were prepared successfully.
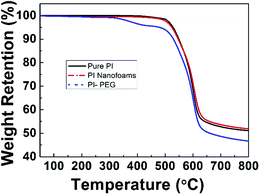 | ||
| Fig. 1 TGA curves of pure PI film, PI/PEG composite film (10 wt%) and PI nanofoams in nitrogen atmosphere. | ||
Cross-sectional morphologies of pure PI film and PI nanofoams prepared by thermolysis of PI/PEG composite films with different PEG contents were observed by SEM analysis. According to Fig. 2a, pure PI film showed a smooth view and no nanopores were observed; PI nanofoam after 5 wt% PEG removal revealed more nanopores clearly (Fig. 2b). The nanopores are uniform and regular in shape. As seen in Fig. 2, the average diameters of the nanopores are approximately 97 nm, 138 nm and 164 nm respectively, associated to the removed PEG content of 5 wt%, 15 wt% and 20 wt%. Obviously, as the removed PEG content increasing from 5 wt% to 20 wt%, the average diameters of the nanopores increase because of PEG accumulation. Notably, numerous nanopores were not observed in the cross-sectional SEM micrographs because partial nanopores were destroyed when the samples were prepared via brittle fracture in liquid nitrogen.
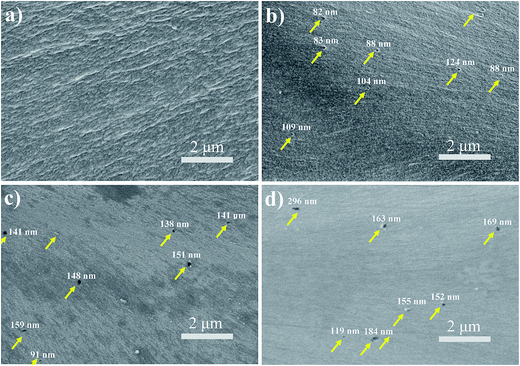 | ||
| Fig. 2 Cross-sectional SEM micrographs of PI nanofoams after removal of the PEG content of (a) 0 wt%, (b) 5 wt%, (c) 15 wt%, and (d) 20 wt%. | ||
3.2 Thermal properties of PI nanofoams
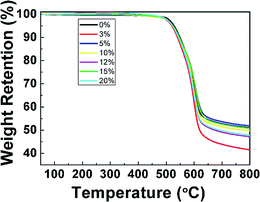
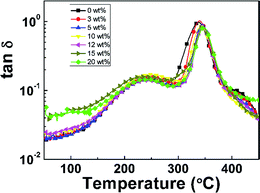
TGA and DMA measurements were performed to investigate the thermal properties of pure PI film and PI nanofoams. According to the TGA results (Fig. 3), PI nanofoams prepared after removal of PEG with different contents, namely, 3, 5, 10, 15, and 20 wt%, showed similar decomposition temperature to that of pure PI. Table S1† shows that the average temperatures at which PI nanofoams exhibited 5% and 10% weight loss are 523 °C and 545 °C, respectively; and the corresponding temperatures of pure PI film are 528 °C and 549 °C, respectively. Hence, the fabricated PI nanofoams maintained excellent thermal stabilities.The dynamic mechanical properties of pure PI film and PI nanofoams are shown in Fig. 4. With temperature increasing, two peaks were observed on the tan![[thin space (1/6-em)]](https://www.rsc.org/images/entities/char_2009.gif) δ curve of the pure PI film, indicating that two transition phases existed. The first transition at the temperature range of 150 °C to 280 °C is related to β relaxation, which is attributed to the movement of the small group of PI chains. The second transition at the temperature range of 280 °C to 450 °C is due to the movement of macromolecular chain segments, which is related to glass transition. The peak temperatures of the two transitions are 243 °C and 338 °C, respectively. The as-prepared PI nanofoams showed a similar transition behavior to that of the pure PI film. The average peak temperatures of β relaxation and Tg for PI nanofoams are 243.5 °C and 344.3 °C, respectively; these PI nanofoams display good thermal properties similar to the pure PI film (Table 1).
δ curve of the pure PI film, indicating that two transition phases existed. The first transition at the temperature range of 150 °C to 280 °C is related to β relaxation, which is attributed to the movement of the small group of PI chains. The second transition at the temperature range of 280 °C to 450 °C is due to the movement of macromolecular chain segments, which is related to glass transition. The peak temperatures of the two transitions are 243 °C and 338 °C, respectively. The as-prepared PI nanofoams showed a similar transition behavior to that of the pure PI film. The average peak temperatures of β relaxation and Tg for PI nanofoams are 243.5 °C and 344.3 °C, respectively; these PI nanofoams display good thermal properties similar to the pure PI film (Table 1).
| PEG content (wt%) | Tβ (°C) | Tg (°C) |
|---|---|---|
| 0 | 243 | 338 |
| 3 | 245 | 339 |
| 5 | 245 | 345 |
| 10 | 248 | 341 |
| 12 | 241 | 346 |
| 15 | 241 | 346 |
| 20 | 241 | 349 |
3.3 Dielectric properties of PI nanofoams
 | (1) |
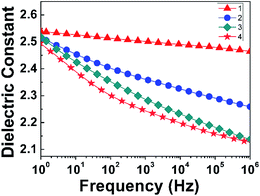 | ||
| Fig. 7 Effect of thermal treatment conditions on dielectric constant of PI nanofoams after removal of 15 wt% PEG in the frequency range of 1 Hz to 1 MHz. | ||
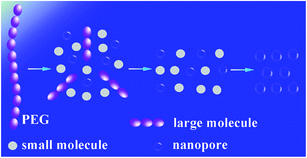
In order to investigate the thermal process, the PI/PEG composite film and PI nanofoam with PEG decomposed partly were measured in GPC. According to Fig. S5,† the Mn and PDI of PI showed no changes before and after thermal decomposition process. For the PI/PEG composite film, there was a single peak belonged to PEG in the GPC curve. However, two peaks of PEG appeared in the GPC curve of PI nanofoam with PEG decomposed partly. The corresponding PDI of PEG before and after thermal decomposition process showed an obvious increase from 1.03 to 1.06. The above process of PEG thermal decomposition was illustrated in Scheme 2. The PEG macromolecular chain first decomposed to large-molecule chains and small molecules which were easily volatilized without shell or other precipitates in the heated condition. Second, the macromolecular chains gradually decomposed to volatile small molecules. In this process, the small molecules accumulated to escape from the matrix resulting in the formation of the nanopores. Thus, the volatile molecules need sufficient time to escape. Otherwise, the PI matrix would be plastified by the products, which caused the collapse of partial holes. When the decomposition rate of thermal labile content is balanced to the escape rate of its decomposition products, PI nanofoams show better dielectric properties.31
4. Conclusions
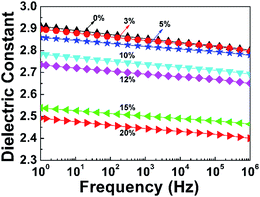
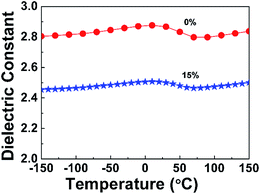
PI nanofoams with low dielectric constant were prepared successfully by introducing pores into the PI matrix containing fluorine groups via thermolysis of PEG. The as-prepared PI nanofoams showed nanosized closed pores and retained their excellent thermal stability in excess of 550 °C. With the increase of PEG content, the porosity of PI nanofoams increased, and a significant decrease for the dielectric constant, from 2.80 to 2.12, was observed. We also found that the dielectric constant of the nanofoams was stable at 2.46 in the temperature range of −150 °C to 150 °C. Controlling the thermal decomposition procedure to improve the dielectric properties is effective. The dielectric constant of the PI nanofoams was clearly reduced from 2.4 to 2.12 with decreasing heating rate. PI nanofoams exhibited improved dielectric properties when the decomposition rate of PEG was balanced to the diffusion rate of the decomposition products of PEG. Excellent thermal properties and dielectric properties of PI nanofoams could improve performances on electronic circuitry transmission and display limitless applications in the field of microelectronics.Acknowledgements
The authors thank the National Basic Research Program of China (973 program, Key Project: 2014CB643604).References
- H. Treichel, G. Ruhl, P. Ansmann, R. Würl, C. Müller and M. Dietlmeier, Microelectron. Eng., 1998, 40, 1–19 CrossRef CAS.
- J. Hedrick, K. Carter, J. Labadie, R. Miller, W. Volksen, C. Hawker, D. Yoon, T. Russell, J. McGrath and R. Briber, in Progress in Polyimide Chemistry II, Springer, 1999, pp. 1–43 Search PubMed.
- K. Maex, M. Baklanov, D. Shamiryan, S. Brongersma and Z. Yanovitskaya, J. Appl. Phys., 2003, 93, 8793–8841 CrossRef CAS.
- International Technology Roadmap for Semiconductors Reports, The international technology roadmap for semiconductors, http://www.itrs2.net/itrs-reports.html, 2009.
- G. Maier, Polym. Sci., 2001, 26, 3–65 CAS.
- B. Sillion, R. Mercier and D. Picq, Synthetic methods in step-growth polymerisation, John Wiley & Sons, New York, 2003, pp. 265–319 Search PubMed.
- H. Deligöz, T. Yalcinyuva, S. Özgümüs and S. Yildirim, Eur. Polym. J., 2006, 42, 1370–1377 CrossRef.
- A. Stich, Z. Gabric and W. Pamler, Microelectron. Eng., 2005, 82, 362–367 CrossRef CAS.
- B. D. Hatton, K. Landskron, W. J. Hunks, M. R. Bennett, D. Shukaris, D. D. Perovic and G. A. Ozin, Mater. Today, 2006, 9, 22–31 CrossRef CAS.
- K. R. Carter, H. J. Cha, R. A. Dipietro, C. J. Hawker, J. L. Hedrick, J. W. Labadie, J. E. Mcgrath, T. P. Russell, M. I. Sanchez, S. A. Swanson, W. Volksen, D. Y. Yoon, MRS Proceedings, Cambridge University Press, 1995, vol. 381, p. 79 Search PubMed.
- Y. Charlier, J. L. Hedrick, T. Russell, S. Swanson, M. Sanchez and R. Jérôme, Polymer, 1995, 36, 1315–1320 CrossRef CAS.
- J. Hedrick, R. DiPietro, Y. Charlier and R. Jerome, High Perform. Polym., 1995, 7, 133–147 Search PubMed.
- C. Plummer, J. L. Hedrick, H. H. Kausch and J. Hilborn, J. Polym. Sci., Part B: Polym. Phys., 1995, 33, 1813–1820 CrossRef CAS.
- J. L. Hedrick, T. Russell, M. Sanchez, R. DiPietro, S. Swanson, D. Mecerreyes and R. Jérôme, Macromolecules, 1996, 29, 3642–3646 CrossRef CAS.
- J. Fodor, R. Briber, T. Russell, K. Carter, J. Hedrick, R. Miller and A. Wong, Polymer, 1999, 40, 2547–2553 CrossRef CAS.
- J. L. Hedrick, C. J. Hawker, R. DiPietro, R. Jérôme and Y. Charlier, Polymer, 1995, 36, 4855–4866 CrossRef CAS.
- S. Y. Cho, C. H. Lee, S. Y. Oh and C. M. Chung, Ultramicroscopy, 2008, 108, 1220–1223 CrossRef CAS PubMed.
- J. L. Hedrick, K. Carter, H. Cha, C. Hawker, R. DiPietro, J. Labadie, R. Miller, T. Russell, M. Sanchez and W. Volksen, React. Funct. Polym., 1996, 30, 43–53 CrossRef CAS.
- J. L. Hedrick, T. Russell, J. Labadie, M. Lucas and S. Swanson, Polymer, 1995, 36, 2685–2697 CrossRef CAS.
- J. L. Hedrick, J. Labadie, T. Russell, D. Hofer and V. Wakharker, Polymer, 1993, 34, 4717–4726 CrossRef CAS.
- J. L. Hedrick, K. Carter, R. Richter, R. Miller, T. Russell, V. Flores, D. Meccereyes, P. Dubois and R. Jerome, Chem. Mater., 1998, 10, 39–49 CrossRef CAS.
- J. L. Hedrick, R. Dipietro, C. Plummer, J. Hilborn and R. Jérôme, Polymer, 1996, 37, 5229–5236 CrossRef CAS.
- S. H. Han, J. S. Do, M. A. Kader, J. H. Lee, M. H. Lee and C. Nah, Polym. Adv. Technol., 2004, 15, 370–376 CrossRef CAS.
- S. Mehdipour-Ataei and S. Saidi, e-Polym., 2007, 7, 1291–1301 Search PubMed.
- Y. Chen, W. Wang, W. Yu, Z. Yuan, E. T. Kang, K. G. Neoh, B. Krauter and A. Greiner, Adv. Funct. Mater., 2004, 14, 471–478 CrossRef CAS.
- G. Fu, W. Wang, S. Li, E. Kang, K. Neoh, W. Tseng and D. Liaw, J. Mater. Chem., 2003, 13, 2150–2156 RSC.
- Y. H. Zhang, L. Yu, L. H. Zhao, W. S. Tong, H. T. Huang, S. M. Ke and H. Chan, J. Electron. Mater., 2012, 41, 2281–2285 CrossRef CAS.
- Y. Zhang, S. Ke, H. Huang, L. Zhao, L. Yu and H. L. Chan, Appl. Phys. Lett., 2008, 92, 1–3 Search PubMed.
- K. R. Carter, R. A. DiPietro, M. I. Sanchez and S. A. Swanson, Chem. Mater., 2001, 13, 213–221 CrossRef CAS.
- H. J. Chu, B. K. Zhu and Y. Y. Xu, J. Appl. Polym. Sci., 2006, 102, 1734–1740 CrossRef CAS.
- Y. Charlier, J. Hedrick, T. Russell, A. Jonas and W. Volksen, Polymer, 1995, 36, 987–1002 CrossRef CAS.
Footnote |
| † Electronic supplementary information (ESI) available. See DOI: 10.1039/c6ra25604j |
| This journal is © The Royal Society of Chemistry 2017 |


