 Open Access Article
Creative Commons Attribution 3.0 Unported Licence
A silica/PVA adhesive hybrid material with high transparency, thermostability and mechanical strength†
Hu Pingan,
Jia Mengjun,
Zuo Yanyan and
He Ling*
Department of Chemistry, School of Science, Xi'an Jiaotong University, Xi'an 710049, China. E-mail: heling@mail.xjtu.edu.cn; Tel: +86-29-8266-8554
First published on 12th January 2017
Abstract
A cross-linked silica and polyvinyl alcohol (PVA) hybrid material was prepared via a sol–gel process for use as a highly transparent, thermostable and mechanically strong coating. The effect of the H2O/TEOS ratio on the properties of the silica/PVA hybrid films, such as transmittance, thermal stability, mechanical strength, adhesive strength and hygrothermal resistance, is discussed herein. A strong chemical interaction between PVA and silica is indicated by the weakening of the C–OH peak and the formation of a Si–O–C peak in the XPS results. This interaction is further confirmed by the decrease in the PVA crystallinity from 23.29% to 2.56%, and the reduction in the silica/PVA melting point from 204.3 °C to 122.0 °C. This excellent compatibility between PVA and silica makes silica/PVA disperse well in solution with a dendritic-like or spherical morphology, and leads to a 97% increase in visible light transmittance. Therefore, compared with pure PVA, the obtained silica/PVA hybrid films are transparent. Even though the mass percentage of silica in the material is beyond 50 wt%, its Young's modulus is much improved from 0.17 ± 0.03 GPa to 2.52 ± 0.10 GPa, its ultimate tensile strength is enhanced from 40.1 ± 9.27 MPa to 80.3 ± 2.5 MPa, and its adhesive strength is increased from 475 N (1.52 MPa) to 712 ± 90 N (2.29 MPa) and it can almost maintain super hygrothermal resistance after 15 hygrothermal aging cycles. It is believed that the obtained silica/PVA hybrid could be used as a high-performance coating with excellent transparency, thermostability and mechanical strength.
1. Introduction
Silica-based inorganic–organic hybrids obtained via the solution–gelation (“sol–gel”) inorganic polymerization process have become remarkable functional materials with various applications as monoliths, powders, tubes and fibres.1–3 A typical sol–gel process normally consists of the catalysed hydrolysis and condensation of an initially small molecule (usually an alkoxide), accompanied by the transformation of this small molecule into a highly viscous gel with an intricate polymeric network structure.3 A good example is the hydrolysis–condensation of tetraethyl orthosilicate (TEOS) via a sol–gel process to obtain nano-SiO2 under mild reaction conditions. This nano-SiO2 is normally used to enhance the thermal and mechanical properties of silica/polymer hybrids by dispersing SiO2 into the polymer matrix.4,5 Actually, a silica oligomer is produced at the very start, which then aggregates into nano-SiO2 particles.6 Dramatic differences in the appearance and physical properties of various silica gels obtained under acidic or basic conditions have been reported.7 On the other hand, the ratio of H2O/TEOS greatly contributes not only to the ability to achieve small particles and a low hydrolysis degree, but also to the strength of the interaction between silica and the polymer matrix.8–11Polyvinyl alcohol (PVA) is a highly hydrophilic polymer with nontoxic, biocompatible and excellent film-forming properties.12 When PVA is used as the polymer matrix for obtaining inorganic–organic hybrids,13 the chemical cross-linking of SiO2 and PVA under mild synthetic conditions is based on the interaction between abundant hydroxyl groups in PVA and silanol groups on the SiO2 surface, leading to good compatibility and good dispersion of SiO2 in the PVA matrix.14 It has been proven that silica/PVA hybrid materials have great potential in applications such as coatings, medicine transfer, inorganic adhesives and other silica-based materials with enhanced thermal stability, mechanical and tensile strength.15 This encourages many researchers to understand the interaction of SiO2 and PVA and to develop novel methods to prepare silica/PVA hybrid materials using various techniques. Examples include the synthesis of porous silica/PVA hybrid materials with an aligned two/three-dimensional structure by slowly lowering an aqueous solution of PVA into liquid nitrogen to obtain pore size distributions of 3 and 10 μm,11 or the preparation of novel silica/PVA cation exchange membranes with high tensile strength (17.4–44.4 MPa) using PVA and multi-alkoxy silicon copolymer poly(AA-co-MPS).10 However, the polymorphisms of silica are deeply dependent on the phase separation of PVA and silica to generate distinct microscopic morphologies and molecular structures of silica.16 Therefore, it is still a challenge to understand the effect of silica morphology at different degrees of hydrolysis on the properties of silica/PVA hybrids, which is the key aim of this paper.
When a silica/PVA hybrid is used as an adhesive material, a strong adhesive strength and high thermostability are desired, and this can be achieved by controlling the silica content. The polymer matrix is usually certain to have enough contact surface area due to being covered with asperities, and this helps to retard the fracture of adhesive joints by dissipating energy under stress. However, using silica/PVA to obtain an adhesive interfacial surface may be difficult, due to the requirements of chemical reactions and heating.17 In order to obtain strong adhesion at room temperature by spreading a droplet of silica/PVA nanoparticle adhesive onto a surface under stress, a good dispersion of SiO2 at an appropriate concentration in PVA is required. Obtaining the correct balance is still a key issue,18 because an excessive content of silica particles will lead to drawbacks such as opaqueness, cracking, deformation, phase separation and easy breakage following heating.19 On the other hand, since silica is thermally stable and comparatively inert, incorporation of silica with PVA could produce hybrids with enhanced thermal and chemical stability without relinquishing the biocompatibility of PVA. Silanol groups on the silica surface are capable of reducing the water solubility of PVA by developing stronger intermolecular interactions, which may result in the improved stability of the hybrids in humid/aqueous environments. To our best knowledge, although there is some work already reported on the synthesis of PVA-templated silica,20–22 there is no report of highly silica-contained silica/PVA hybrids. In order to improve the practical application of silica/PVA hybrids as transparent, thermostable and mechanically strong coatings, but without sacrificing their hybrid properties, one way to produce them might be by using an inorganic filler of SiO2 as a major component of the preparation method under mild conditions. Therefore, improving the dispersion of high content silica in PVA matrix using a traditional sol–gel route might be very challenging.
Herein, we report the sol–gel preparation of silica/PVA hybrids to produce highly transparent, thermostable and mechanically strong coatings by adjusting the H2O/TEOS ratio to promote a strong interaction between silica and PVA. The interaction between PVA and SiO2, and the silica morphology in the PVA matrix are investigated using transmission electron microscopy (TEM), X-ray diffraction measurements (XRD), X-ray photoelectron spectroscopy (XPS) and scanning electron microscopy (SEM). The transmittance, thermal stability, adhesive strength and resistance to hygrothermal aging are comparatively analyzed using UV-vis spectroscopy, thermogravimetric analysis (TGA), differential scanning calorimetry (DSC), dynamic thermomechanical analysis (DMA) and tensile strength testing. The results demonstrate that a cross-linked silica/PVA hybrid high-performance coating containing 56 wt% silica is produced, with high transmittance, Young's modulus, adhesive strength, and super humidity resistance.
2. Experimental section
2.1 Materials
Tetraethoxysilane (TEOS, >98%) and polyvinyl alcohol (PVA) (alcoholysis degree: 98–99 mol%, viscosity: 54.0–66.0 mPa s−1) were supplied by Sigma-Aldrich and were purified before use. Hydrochloric acid (HCl, AR grade, 36 wt%), deionized water (Milli-Q, 18.2 MΩ cm−1) and ethyl alcohol were used as received.2.2 Preparation of PVA solution
5 wt% PVA water solution in 28.5 g deionized water was placed in a sealed tube for 0.5 h at room temperature (to promote complete swelling), and then was raised to 95 °C for 2 h under vigorous stirring to achieve a transparent solution. After complete dissolution, the PVA solution was cooled to room temperature for use.2.3 Preparation of silica/PVA hybrids
A silica sol was prepared by mixing TEOS, ethanol and water in a molar ratio of H2O/TEOS = r (Table 1), maintaining the same pH for all solutions by the addition of hydrochloric acid. The water content was controlled at values of 0.025 mol, 0.1 mol and 0.3 mol, and the corresponding sols were named A, B and C, respectively, as shown in Table 1. Then, the mixture was stirred at 60 °C for 1 h before pouring the prepared PVA solution into the above silica sol, and stirring was maintained at the same temperature for another 5 h. In addition, 10 ml EtOH as a co-solvent was added into sol A when mixing with PVA solution in order to avoid phase separation of non-hydrolyzed TEOS.| Sample | TEOS (mol) | EtOH (mol) | H2O (mol) | H2O/TEOS mol ratio (r) | Solution | ||
|---|---|---|---|---|---|---|---|
| PVA (g) | Silica (g) | pH | |||||
| A | 0.025 | 0.10 | 0.025 | 1 | 1.5 | 1.5 | 1.76 |
| B | 0.025 | 0.10 | 0.10 | 4 | 1.5 | 1.5 | 1.71 |
| C | 0.025 | 0.10 | 0.30 | 12 | 1.5 | 1.5 | 1.62 |
2.4 Characterization
The morphology of the silica dispersed in the PVA matrix was observed using transmission electron microscopy (TEM) on a JEM-100SX instrument operating with an acceleration voltage of 80 kV. Samples were diluted and dripped onto carbon-coated grids, and then were taken out into the air for drying before the measurements.Before measuring the interaction between PVA and silica, the hybrid solution was permitted to form a film on a glass substrate under ambient conditions by drying naturally for 12 h and storing under vacuum for another 24 h at 50 °C. Then, X-ray diffraction measurements were performed to evaluate the crystallinity of the silica/PVA film using a PANalytical X'pert pro XRD unit with Cu Kα radiation in the scanning range of 2θ located at 10–50°. X-ray photoelectron spectroscopy (XPS) was used on an AXIS Ultrabld with non-monochromatized Al Kα X-rays to analyze the content ratio of chemical bonds. Scanning electron microscopy (SEM) measurements were performed on a FEI Quanta 200 instrument at 20.0 kV to characterize the film surface after coating with a thin gold film using a vacuum sputtering tool to improve electrical conductivity.
The visible light transmittance of the hybrid solution without dilution was obtained using a Shimadzu UV-vis spectrometer in the wavelength range from 400 nm to 800 nm, and deionized water was used as the reference solution.
The thermal stability of the silica/PVA hybrid was measured using differential scanning calorimetry (DSC), and thermogravimetric analysis (TGA) at the same heating rate of 10 °C min−1 using nitrogen at a flow rate of 20 ml min−1.
The mechanical strength of the silica/PVA hybrid films was tested using stress–strain curves for obtaining Young's modulus and the tensile strength at break, the data for which were collected under room temperature using a DMA Q800 instrument, and the tensile strength was increased from 0 to 18 N in 3 min. The final result was the average of at least three data points and each film was tested at least five times.
Hygrothermal aging cycles of the adhesive strength for the silica/PVA hybrid films were performed in the programmable temperature and humidity chamber. One hygrothermal aging cycle was 24 h (at a relative humidity maintained at RH = 93%) and the procedure was as follows (ESI Fig. S1†): firstly, the sample was heated from 25 °C to 65 °C over 2.5 h and was maintained at 65 °C for 3 h, followed by cooling to 25 °C over 2.5 h. Secondly, the above process was repeated and the sample was kept at 25 °C for 1.5 h. Thirdly, the sample was cooled from 25 °C to −20 °C over 0.5 h and was then kept at −20 °C for 3 h, followed by heating up to 25 °C over 1.5 h and holding at 25 °C for 1.5 h. After the specified hygrothermal aging cycles, the adhesive strength of the silica/PVA hybrid films was investigated using the lap shear test at a speed of 2 mm min−1. A sample solution of silica/PVA hybrid was applied as the sandwich between two glass sheets (covered 12.5 mm × 25 mm) and then was put on a horizontal desk for two days and then placed under vacuum at 50 °C for another two days. The maximum adhesive strength was recorded after the sudden drop and the final result for each sample was taken as the average of 5 data points.
3. Results and discussion
3.1 Formation of silica/PVA hybrids
For the three silica/PVA hybrids obtained using different H2O/TEOS ratios (r = 1, 4, 12), the TEM images indicate that the silica particles in Sample A (Fig. 1a, r = 1), Sample B (Fig. 1b, r = 4) and Sample C (Fig. 1c, r = 12) have been produced and are well dispersed in the PVA matrix, as marked by the black arrow in Fig. 1a. The dark aggregates are un-hydrolyzed TEOS, as marked by the red arrows in Fig. 1a. It is believed that the diameter of the silica particles is dependent on the r values when the temperature and pH are kept constant (Table 2). The silica particles obtained in Sample A have diameters of less than 50 nm (Fig. 1a), while the diameters of the silica particles are in the range of 50–100 nm in Sample B (Fig. 1b) and C (Fig. 1c). Furthermore, the TEM observations reveal that the morphology of the silica particles in Sample A (r = 1) contains dendrite-like aggregates (Fig. 1a) without individual particles. However, clear outlines of spherical particles are found in Sample B (Fig. 1b) and C (Fig. 1c). This significant difference in morphology can be explained by the different H2O/TEOS (r) values used for the preparation of Sample A, B and C. | ||
| Fig. 1 TEM images of the silica/PVA hybrids obtained using different H2O/TEOS ratios (r): Sample A (a, r = 1), Sample B (b, r = 4) and Sample C (c, r = 12). | ||
| Samples | Particle size (nm) | Particle morphology by TEM | Content ratio of CH2/CH–OH by XPS | Crystallinity by XRD (%) |
|---|---|---|---|---|
| PVA | — | — | 1![[thin space (1/6-em)]](https://www.rsc.org/images/entities/char_2009.gif) : :![[thin space (1/6-em)]](https://www.rsc.org/images/entities/char_2009.gif) 1.04 1.04 |
23.29 |
| Sample A | 50 | Dendrite-like | 1![[thin space (1/6-em)]](https://www.rsc.org/images/entities/char_2009.gif) : :![[thin space (1/6-em)]](https://www.rsc.org/images/entities/char_2009.gif) 0.54 0.54 |
2.56 |
| Sample B | 50–100 | Sphere | 1![[thin space (1/6-em)]](https://www.rsc.org/images/entities/char_2009.gif) : :![[thin space (1/6-em)]](https://www.rsc.org/images/entities/char_2009.gif) 0.80 0.80 |
3.78 |
| Sample C | 50–100 | Sphere | 1![[thin space (1/6-em)]](https://www.rsc.org/images/entities/char_2009.gif) : :![[thin space (1/6-em)]](https://www.rsc.org/images/entities/char_2009.gif) 0.94 0.94 |
3.92 |
According to the normal hydrolysis reaction formula, a H2O/TEOS ratio of r = 4 is the stoichiometric ratio for gaining solid spherical nanoparticles,23 but for complete hydrolysis at least r = 2 is required, if taking practical hydroxyl groups into consideration. Since r = 1 in Sample A is below the stoichiometric ratio, it is not possible for it to be completely hydrolyzed, and only a few orthosilicic acid groups (Si(OH)4) continue to form silica nanoparticles covered with dark aggregates in the subsequent condensation process, as observed in Fig. 1a. However, there is enough water in both Sample B and C (r = 4 and 12, respectively) to ensure the sufficient hydrolysis of TEOS and to form solid silica particles, which apparently leads to an increase in nanoparticles, as shown in Fig. 1b and c.
Furthermore, the obtained film surface can further confirm the increased distribution of silica particles from Sample A (r = 1) to Sample C (r = 12), as shown in Fig. S2.† For Sample A, there are almost no silica particles on the smooth surface of the film. Meanwhile, a significant increase in silica particles is clearly found in Sample B and C (especially on their magnified surfaces). Furthermore, silica particles on the film surface of Sample C are much rougher than those on the surface in Sample A and Sample B, which agrees well with the TEM observation. Actually, the silica particles are very well dispersed in the TEM and SEM observations, and this is also closely related to the acidic conditions (pH = 1.7) used in this study. Owing to the existence of silanol groups on the surface of the silica nanoparticles, the hydroxyl groups in PVA can easily form hydrogen bonds under acidic conditions. Because the number of silanol groups on the silica surface is increased at lower pH, the hydroxyl groups in PVA can be adsorbed easily on the silanol groups of the silica particles.19 Based on this consideration, this study maintained the hybrid solution under acidic conditions (pH = 1.7), and decreased the ratio of H2O/TEOS to gain small particles and oligomers, so as to improve the interaction areas for obtaining a strong interaction between silica and PVA.
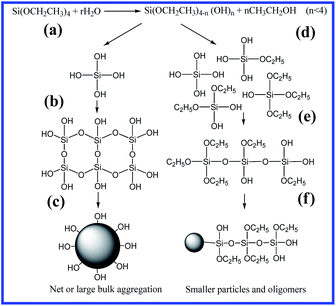
From above results, the hydrolysis–condensation mechanism of TEOS at different H2O/TEOS ratios is suggested in Scheme 1, where (a) and (d) present the hydrolysis process, (b) and (e) show the condensation process, and (c) and (f) give the formation of silica particles. During the hydrolysis, because high water content (high r value) contributes to complete hydrolysis to generate four silanol groups, an aligned net-like structure is formed in sufficient water due to an abundance of hydroxyl groups (Scheme 1a–c). Meanwhile, insufficient water (low r value) will lead to a significant amount of un-hydrolyzed ethyoxyl, so as to form oligomers and disorderly small molecules (Scheme 1d–f), and finally form dendrite-like aggregates to cover the silica particles, as shown in Scheme 1f, due to short-chain polymers (or oligomers) connecting with silica particles instead of hydroxyl groups. This morphology is also confirmed in the TEM observations (Fig. 1a). On the other hand, silica particles are able to destroy the intramolecular and intermolecular hydrogen bonds in PVA to form new hydrogen bonds with hydroxyl groups of PVA via silanol groups.16 In this case, the aggregation of silica particles becomes a dendrite-like morphology, owing to enough PVA around the silica particles and the unhydrolyzed TEOS. Therefore, by controlling the H2O/TEOS ratio, it is possible to adjust the hydrolysis mechanism in the sol–gel approach and to regulate the distribution morphology of silica particles in the PVA matrix, and finally control the interaction between silica and PVA.
3.2 Interaction between silica and PVA
The chemical interaction between silica and PVA was confirmed using XPS and XRD analysis. In the XPS plots (Fig. S3†), Si 2s (149 eV) and Si 2p (100 eV) are observed in Sample A–C, and are accompanied by strong peaks for C 1s (284 eV) and O 1s (532 eV) for PVA polymer chains. Furthermore, high-resolution elemental scans of C 1s are used to obtain the content ratio of CH2 to CHOH groups in the PVA chains (Fig. 2). Because PVA shows two carbon features at BE = 283.7 eV (red curve for CH2) and BE = 286.5 eV (blue curve for CH–OH), the intensity of the CH–OH group is dramatically decreased upon adding silica sol into the PVA solution (Fig. 2). If hydroxyl groups in PVA chemically and irreversibly react with silica, there must be an intensity decrease in CH–OH.24–26 In this study, the calculated ratio of CH2/CH–OH in PVA is 1![[thin space (1/6-em)]](https://www.rsc.org/images/entities/char_2009.gif) :
:![[thin space (1/6-em)]](https://www.rsc.org/images/entities/char_2009.gif) 1.04 (Table 2), which is close to the theoretical ratio of 1
1.04 (Table 2), which is close to the theoretical ratio of 1![[thin space (1/6-em)]](https://www.rsc.org/images/entities/char_2009.gif) :
:![[thin space (1/6-em)]](https://www.rsc.org/images/entities/char_2009.gif) 1 for PVA. However, the ratio of CH2/CH–OH is 1
1 for PVA. However, the ratio of CH2/CH–OH is 1![[thin space (1/6-em)]](https://www.rsc.org/images/entities/char_2009.gif) :
:![[thin space (1/6-em)]](https://www.rsc.org/images/entities/char_2009.gif) 0.54 for Sample A, 1
0.54 for Sample A, 1![[thin space (1/6-em)]](https://www.rsc.org/images/entities/char_2009.gif) :
:![[thin space (1/6-em)]](https://www.rsc.org/images/entities/char_2009.gif) 0.80 for Sample B and 1
0.80 for Sample B and 1![[thin space (1/6-em)]](https://www.rsc.org/images/entities/char_2009.gif) :
:![[thin space (1/6-em)]](https://www.rsc.org/images/entities/char_2009.gif) 0.94 for Sample C (Table 2), illustrating the stronger chemical interaction between PVA and silica sol. The results also prove that the lower H2O/TEOS ratio (r) contributes to forming a strong interaction between silica and PVA. Therefore, Table 2 reveals that the deviation behavior of the bonding intensity is perfectly consistent with the adjustments to the H2O/TEOS ratio.
0.94 for Sample C (Table 2), illustrating the stronger chemical interaction between PVA and silica sol. The results also prove that the lower H2O/TEOS ratio (r) contributes to forming a strong interaction between silica and PVA. Therefore, Table 2 reveals that the deviation behavior of the bonding intensity is perfectly consistent with the adjustments to the H2O/TEOS ratio.
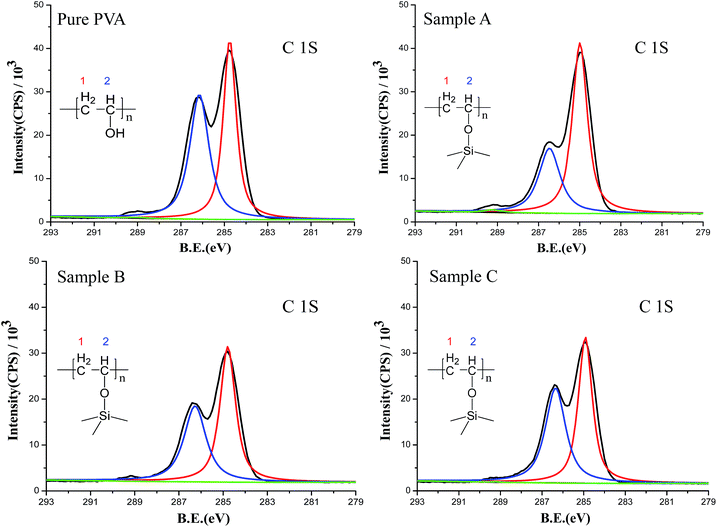 | ||
| Fig. 2 XPS high-resolution elemental scans of C 1s: the red curve and the blue curve are different carbon atoms, and the black curve indicates the raw background. | ||
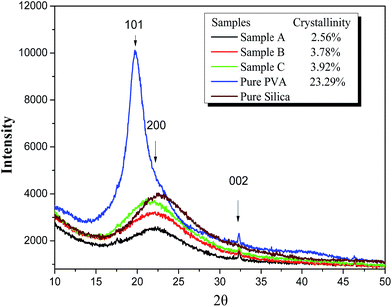
If there is a crystalline region, a sharp and high intensity peak will appear in WAXD; otherwise, there will be a broad and low-intensity peak for an amorphous region.27 The degree of interaction between PVA and silica will impact the crystallinity of the final silica/PVA hybrids because PVA is a semi-crystalline polymer. Fig. 3 shows the XRD plots of PVA and the silica/PVA hybrids. A strong peak at around 2θ = 20° for pure PVA is the characteristic peak for the orthorhombic lattice (101) with unit cell parameters of a = 7.81 Å, b = 2.52 Å, c = 5.51 Å, β = 91.78°.28,29 Normally, PVA should have two peaks at (101) and (200), but if the crystal is not strong enough, the two peaks will merge into one. The broad peak that appears between 20° and 25° in all silica/PVA hybrid samples (Fig. 3) is attributed to amorphous silica, and can be seen in the pure silica sample in Fig. 3. Furthermore, a slight shift to the left is found among all the hybrid samples when compared with the pure silica sample, and this shift becomes much clearer from Sample A to Sample C, due to the increasing crystallinity of PVA in the silica/PVA hybrid samples.
On the other hand, the crystallinity values calculated by X'pert Highscore Plus software, shown in Table 2, reveal that the degree of crystallinity of PVA in the three silica/PVA hybrids of Sample A, B and C (2.56%, 3.78%, and 3.92%, respectively) increases with increasing H2O/TEOS ratio, although the crystallinity of pure PVA (23.29%) is lower than the theoretical value for a semi-crystalline polymer (∼50%). This result also proves the formation of the silica/PVA hybrids through the chemical interaction between silica and PVA. It is worth noting that much different values for the crystallinity are obtained for Sample A, B and C, although a similar percentage of inorganic filler (∼50 wt%) was used in the preparation of the silica/PVA hybrids (Table 1). The crystallinity degree of a polymer is dependent on the content of small molecules, because smaller particles increase the surface area between the filler and polymer matrix. Generally, smaller molecules prefer to combine strongly with the polymer and hinder the orderly arrangement required to form crystalline regions.30 Therefore, the small silica particles and silica oligomer molecules in Sample A allowed for a much stronger interaction with PVA than in Sample B and C, thereby leading to lower crystallinity than Sample B and C.
Based on the above discussion and the SEM observations, a brief schematic diagram of the interaction between silica and PVA is given in Scheme 2. When the silica sol is added into the PVA solution, C–OH groups in PVA and Si–OH groups in silica will interact with each other. As it is known, there are aligned PVA chains in the crystalline zones in pure PVA. When PVA chains are absorbed and connected on the surface of silica particles, some crystals form near the gaps between the silica particles, as shown in Scheme 2a, which represents the preparation of Sample C in an abundance of H2O as H2O/TEOS ratio (r = 12). This is shown in the SEM images of the film in Scheme 2, which indicate obvious silica nanoparticles. However, due to the low H2O/TEOS ratio of r = 1 for Sample A (Scheme 2b), small particles and oligomers overlap in the silica sol, where the PVA chains are bonded with the silica surface, and therefore, crystalline regions become relatively fewer. In the SEM images, there are almost no obvious silica particles distributed on the film surface where a lower H2O/TEOS ratio was used. Although the inorganic filler of silica breaks the orderly arrangement of the PVA polymer chains and decreases the crystallization degree of the silica/PVA hybrids,9 silica and silica oligomers are tied together by PVA chains to form a uniform and transparent hybrid film that overcomes crack, deformation and opaque defaults, even when more than 50 wt% of silica is used, because PVA exerts a structure orienting effect.7
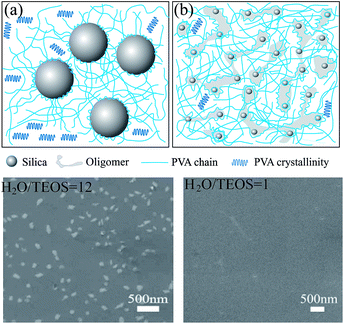 | ||
| Scheme 2 Schematic diagram of the interaction between silica and PVA, showing silica in the PVA matrix at different H2O/TEOS ratios: (a) r = 12 for Sample C, and (b) r = 1 for Sample A. | ||
3.3 Thermal stability of the silica/PVA hybrids
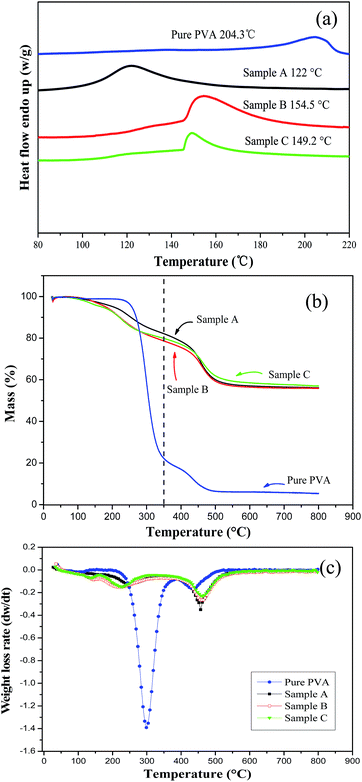
It has been reported that the addition of an inorganic filler into the polymer matrix produces a shift in the melting point, attributed to the decrease in crystallization and crystallite size.30 Therefore, the thermal stability of a hybrid material often depends on the interaction between the inorganic and polymer components. The endothermic peak for the melting temperature (Tm) in the DSC profiles (Fig. 4a) indicates that pure PVA has a Tm of 204.3 °C (200–210 °C as usual), but the Tm of the silica/PVA hybrids is close to 150 °C, except for Sample A that has a value of 120 °C (Table 3). The broader peak in Fig. 4a is attributed to a high content of a uniformly distributed inorganic phase that stiffens the hybrid materials.31| Samples | Tm (°C) | Td (°C) | Transparence (%) | Tensile strength (MPa) | Young's modulus (GPa) | Adhesive strength (N) |
|---|---|---|---|---|---|---|
| a Tm and Td refer to the melting temperature and decomposition temperature. | ||||||
| PVA | 204.3 | 256.9 | 88–94 | 40.1 ± 9.3 | 0.17 ± 0.03 | 475 |
| Sample A | 122.0 | 203.5 | 97–99 | 80.3 ± 2.5 | 2.52 ± 0.10 | 715 |
| Sample B | 154.5 | 181.4 | 87–94 | 42.5 ± 2.5 | 3.87 ± 0.06 | 356 |
| Sample C | 149.2 | 170.3 | 92–94 | 31.9 ± 5.7 | 4.07 ± 0.15 | 590 |
Meanwhile, Tm decreases with an increase in the content of silica particles, even though the mass percentage is below 10 wt% in the silica/PVA hybrids.30 Here, the Tm values of the three silica/PVA hybrids have also been shown to decrease, even when more than 50 wt% inorganic particles were introduced. Actually, diminishing crystallinity is the major reason for the lower Tm of Sample A compared with Sample B and C (Table 3). In Sample A, both the small particles and overlapping oligomers are the main factors that lead to a lower Tm, compared with the clear outline of silica in Sample B and C (Fig. 1). In the TGA curves (Fig. 4b), all samples exhibit a slight shake at 100 °C due to the self-condensation of silanol groups or the vaporization of water. Compared with the dehydration of PVA chains at 254–256 °C,13,32 the first degradation of Sample A–C clearly occurs at 204 °C, 181 °C and 170 °C (Table 3), respectively. However, the highest mass loss rate and the major decomposition appear at the second decomposition temperature of 450 °C for Sample A–C, which is higher than that for pure PVA, as shown in Fig. 4b.
The residue of the silica/PVA hybrids was analyzed at 350 °C (at the end of the first degradation) (Fig. 4b). As shown in Table 3, the weight losses of the silica/PVA hybrids are calculated as 40.7 wt%, 48.4 wt% and 46.8 wt% for Sample A, B and C, respectively, and 77.8 wt% for pure PVA (Fig. 4b). This can further prove the enhanced thermal stability of the silica/PVA hybrids by evolving silica. The weight of the residue remained almost constant beyond 600 °C for Sample A–C, with values of 56.15 wt%, 55.84 wt% and 56.97 wt% respectively, but for pure PVA, only 5 wt% remained in the ash (Fig. 4b). Therefore, all these TGA curves have confirmed that the amount of the silica in the hybrids is in good agreement with the expectation in this paper.
Furthermore, the DTGA curves of the silica/PVA hybrids (derived from TGA) in Fig. 4c exhibit a great difference compared with the curve of pure PVA. The weight loss rates of the three silica/PVA hybrids are maintained at a low level at the first degradation temperature of 220 °C, but then increase at the second degradation temperature of 400–450 °C. However, the weight loss rate of PVA is extremely fast, and the second degradation temperature is overlapping. These results indicate that the major degradations of the hybrids happen at higher temperatures than pure PVA, suggesting the higher thermal stability of the silica/PVA hybrids compared with PVA.
3.4 Transmittance of the silica/PVA hybrids
If the particle size is very small so that it does not lead to a significant amount of scattering loss, the addition of silica or TEOS will improve the transmittance according to effective-medium theory.35 This is ascribed to the difference in the refractive index (n) between PVA (V%) and silica/TEOS, dependent on the dielectric constants for different compositions and geometries of the hybrid solution.36 The calculated value of n for three samples is as follow:| nhybrids2 = nPVA2 × V% + nsilica2 × (1 − V%) |
According to this suggestion, a small particle diameter will decrease the scattering loss and thereby increase the solution transparency (Fig. 5). Therefore, Sample B exhibits unsatisfactory transmittance compared with Sample A and C. Also, the transparency of the films is further proved by covering the surface of the badge of Xian Jiaotong University with PVA and Sample A. As shown in the photo in Fig. 5, the Chinese characters under the film of Sample A do not show any variation in color, revealing the transparency of the film formed by Sample A. The UV-vis absorption spectra in the range of 400–800 nm for the silica/PVA hybrids and pure PVA in a diluted water–ethanol solution are compared in Fig. 5. The transparence of Sample A (97–99%) and Sample C (92–94%) is much higher than pure PVA (88–94%), but the transparence of Sample B (87–94%) is a little lower than that of pure PVA (Table 3), revealing that the addition of silica particles in the hybrid solution might not be the main factor behind the transmittance, even though there is 56 wt% silica in all of the hybrids. Actually, the transmittance of the hybrid solution is controlled by its morphology;33 therefore, the transmittance of the three hybrids is in accordance with their particle size distribution, as shown in Fig. 1. Large silica particles with large scattering areas are likely to cause opaqueness in solution;34 therefore, the large diameters of the silica particles in Sample B lead to increased scattering loss and low transparence, due to the large scattering cross-section.
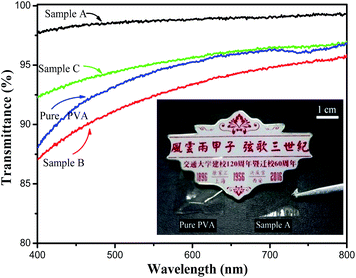 | ||
| Fig. 5 Transmittance spectra of silica/PVA hybrid solutions and PVA solution, and covered surface on the badge by PVA and Sample A films. | ||
3.5 Mechanical strength of the silica/PVA hybrids
The mechanical strength of silica/PVA hybrid films were tested, as shown in the stress–strain curves in Fig. 6a. For the pure PVA film, the stress increases immediately with the increase in strain at the beginning, and then the film slowly reaches 200% elongation. Meanwhile, the silica/PVA hybrid films break under much lower strain (less than 5%), and finally reach a very high tensile stress, as shown in the inset of Fig. 6a. This indicates that the stiffness of the silica/PVA hybrid films is far beyond that of the pure PVA, owing to the addition of silica. The tensile strength at the break for each sample is shown in Fig. 6b and Table 3. Sample A has an ultimate tensile strength at 80.3 ± 2.5 MPa, which is much higher than that of pure PVA (40.1 ± 9.3 MPa) and Sample B and C (42.5 ± 2.5 MPa and 31.9 ± 5.7 MPa, respectively). This suggests that the good distribution and interaction of the inorganic particles with the PVA polymer is favorable for improving the mechanical properties, as has been previously reported for a cellulose nanocrystals/PVA film (52 MPa tensile strength)13 and an MNT/PVA film (150 MPa tensile strength).31 Sample A has quite a good performance compared with the other samples, indicating that the incomplete hydrolysis of TEOS enables the silica sol to produce enough hydroxyl groups and surface area to facilitate the interaction with the PVA polymer, such as in Sample A. Meanwhile, the large nanoparticles in the polymer matrix of Sample B and C fail to improve the ultimate tensile strength.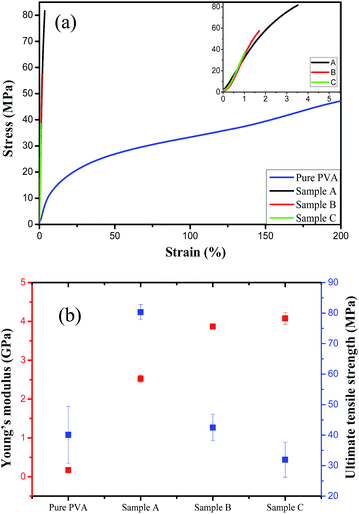 | ||
| Fig. 6 The mechanical properties of the silica/PVA hybrid films (a), ultimate tensile strength and Young's modulus (b). | ||
The comparison of Young's moduli in Fig. 6b indicates that pure PVA has a Young's modulus of only 0.17 ± 0.03 GPa due to its easy-deformation during elongation. However, an obvious jump in the Young's modulus for Sample A (2.52 ± 0.10 GPa), Sample B (3.87 ± 0.06 GPa) and Sample C (4.07 ± 0.15 GPa) is obtained, due to the stiffness of the films contributed by the nanoparticles of silica (Table 3). Inorganic particles are often hoped to reinforce the stiffness of a material, leading to an increase in the Young's moduli of the three hybrids. The solid particles in Sample B and C play a important role in this property, while the amorphous silica in Sample A does not lead to much improvement. However, the cross-linking morphology in Sample A helps to achieve a strong interaction between the silica and PVA matrix, and this is also the reason that Sample A reaches a strain of 3.5% at breaking (Fig. 7a), while the films of Sample B and C break at a much lower strain. Therefore, Sample A is much more flexible than Sample B and C, even though they have the same silica content.
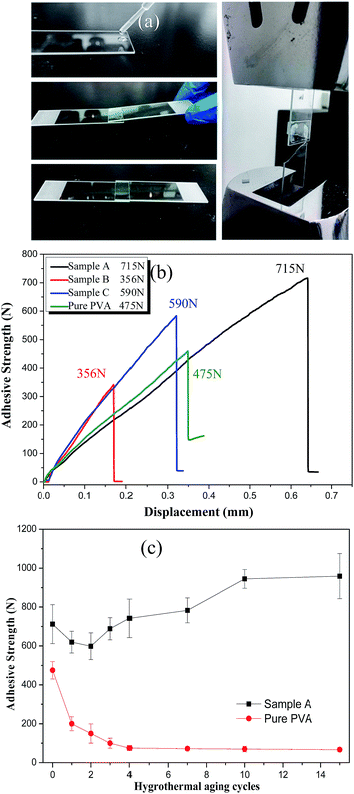 | ||
| Fig. 7 (a) Simplified processes of preparing the adhesive test; (b) adhesive strength as a function of displacement for all samples; (c) adhesive strength after hygrothermal aging cycles. | ||
3.6 Adhesive strength of the silica/PVA hybrids
It is hoped that silica/PVA hybrids can maintain the adhesive strength of PVA for common applications. However, it has been found that phase separation occurs when the silica concentration is beyond 36.5 wt% during the preparation of 59 nm silica nanoparticles using the traditional Stöber's method for hybrid compounds.36 Although some studies have reported improved adhesive strength by blending nanoparticles with polymer,33,37,38 they all used a very small inorganic content.37 In order to understand the effect of silica particles on the adhesive strength, the lap sheer strength of the overlap joint for all the silica/PVA hybrid samples was measured, as shown in Fig. 7a. Compared with the adhesive strength of pure PVA (475 N, 1.52 MPa), an excellent adhesive strength is obtained for Sample A (715 N, 2.29 MPa) and Sample C (590 N, 1.89 MPa), as shown in Fig. 7b and Table 3. Since silica sol in a low H2O/TEOS ratio has a positive effect on adhesive strength, Sample A achieves the highest adhesive strength (715 N), but Sample B shows a lower adhesive strength (356 N) caused by the larger diameter of the silica particles in the PVA matrix. Sample B is unsatisfactory both in transmittance and adhesive strength. The obtained results have proven that a lower H2O/TEOS ratio can contribute to smaller aggregates, and therefore improve the adhesive strength, due to well-dispersed silica particles in the PVA matrix. In addition, the strong adhesion strength of Sample A is also confirmed by the breakage of a glass sheet instead of the separation of the lap area, as shown in Fig. 7a, indicating that the adhesive strength in Sample A is actually higher than 715 N.Furthermore, in order to evaluate the durability of the adhesive strength, hygrothermal aging cycles were applied to simulate the humidity and hot/cold environments (Fig. S1†). After different hygrothermal aging cycles, the adhesive strength of Sample A and pure PVA were measured, as shown in Fig. 7c. For Sample A, the adhesive strength in the first two cycles decreases from the initial adhesive strength of 715 ± 90 N to 619 ± 55 N (24 h of first cycle) and 598 ± 68 N (48 h of second cycle). This may be caused by the partial dissolution of PVA, due to hydrophilic properties. However, the adhesive strength in the third cycle (688 ± 56 N) and fourth cycle (742 ± 99 N) is increased to be close to or even beyond the initial value (715 ± 90 N) and exhibits the highest adhesive strength after 15 cycles (958 ± 116 N). From 10–15 cycles, the adhesive strength of Sample A remains constant (958 ± 116 N), due to the good compatibility of the silica/PVA hybrid with silicate glass. Unfortunately, the adhesive strength of pure PVA in Fig. 7c is attenuated heavily from the initial value of 475 N to 72 N after 15 cycles (about 85% attenuation). Therefore, silica/PVA hybrid of Sample A almost maintains super hygrothermal resistance after 15 hygrothermal aging cycles.
4. Conclusion
This paper reports silica/PVA hybrid materials for application as transparent/adhesive coatings. The effect of the H2O/TEOS ratio on the formation of the silica/PVA hybrids, interaction between silica and PVA, silica morphology, transmittance of the film, thermal stability and adhesive strength resistance to hygrothermal aging is comparatively studied. The interaction between silica and PVA to form cross-linked silica/PVA hybrids is confirmed by the cross-linking of –OH groups, the formation of Si–O–C bonds, a decrease in the crystallinity of PVA from 23.29% to 2.56%, and a decrease in the melting point of the silica/PVA hybrid from 204.3 °C to 122 °C. The chemically interacting silica/PVA hybrids are obtained using a silica sol (obtained at a low H2O/TEOS ratio) well-dispersed in a PVA matrix, to form strong hydrogen bonding between PVA and smaller silica particles or oligomers. This strong interaction provides the silica/PVA hybrids with transparence, enhanced thermal stability, strong mechanical and adhesive strength, even with more than 50 wt% silica in the hybrid. The silica/PVA hybrids exhibit a much higher tensile strength (80.3 ± 2.5 MPa) than pure PVA (40.1 ± 9.3 MPa), much higher Young's modulus (2.52 ± 0.10 GPa) than pure PVA (0.17 ± 0.03 GPa), and excellent adhesive strength (715 N, 2.29 MPa) compared with PVA (475 N, 1.52 MPa). Even after undergoing 15 hygrothermal aging cycles, this adhesive strength is still effective (958 N, 3.07 MPa). The discovered formation mechanism between silica and PVA could offer new insight into the formation of silica/PVA hybrid materials. The results prove that the obtained silica/PVA hybrids offer great potential for future applications as transparent and adhesive coatings.Acknowledgements
This work has been financially supported by the National Natural Science Foundation of China (NSFC Grants 51373133, 51573145), and the National Basic Research Program of China (973 Program, No. 2012CB720904). The authors also wish to express their gratitude to the MOE Key Laboratory for Non-equilibrium Condensed Matter and Quantum Engineering of Xi'an Jiaotong University.Notes and references
- J. Ma, Z. Liang, X. Qiao, Q. Deng, D. Tao, L. Zhang and Y. Zhang, Anal. Chem., 2008, 80(8), 2949–2956 CrossRef CAS PubMed.
- G. L. Li, Z. Zheng, H. Möhwald and D. G. Shchukin, ACS Nano, 2013, 7(3), 2470–2478 CrossRef CAS PubMed.
- T. Pirzada, S. A. Arvidson, C. D. Saquing, S. S. Shah and S. A. Khan, Langmuir, 2012, 28(13), 5834–5844 CrossRef CAS PubMed.
- K. Lionti, L. Cui, W. Volksen, R. Dauskardt, G. Dubois and B. Toury, ACS Appl. Mater. Interfaces, 2013, 5(21), 11276–11280 CAS.
- R. Ciriminna, A. Fidalgo, V. Pandarus, F. Beland, L. M. Ilharco and M. Pagliaro, Chem. Rev., 2013, 113(8), 6592–6620 CrossRef CAS PubMed.
- D. P. Petry, M. Haouas, S. C. C. Wong, A. Aerts, C. E. A. Kirschhock, J. A. Martens, S. J. Gaskell, M. W. Anderson and F. Taulelle, J. Phys. Chem. C, 2009, 113(49), 20827–20836 CAS.
- I. Halasz, A. Kierys, J. Goworek, H. Liu and R. E. Patterson, J. Phys. Chem. C, 2011, 115(50), 24788–24799 CAS.
- S. Sakka and K. Kamiya, J. Non-Cryst. Solids, 1982, 48(1), 31–46 CrossRef CAS.
- U. Lad, G. M. Kale and R. Bryaskova, Anal. Chem., 2013, 85(13), 6349–6355 CrossRef CAS PubMed.
- J. Hao, M. Gong, Y. Wu, C. Wu, J. Luo and T. Xu, J. Hazard. Mater., 2013, 244–245, 348–356 CrossRef CAS PubMed.
- H. Zhang, I. Hussain, M. Brust, M. F. Butler, S. P. Rannard and A. I. Cooper, Nat. Mater., 2005, 4(10), 787–793 CrossRef CAS PubMed.
- H. Zhang, H. Xia and Y. Zhao, ACS Macro Lett., 2012, 1(11), 1233–1236 CrossRef CAS.
- J. A. Sirvio, S. Honkaniemi, M. Visanko and H. Liimatainen, ACS Appl. Mater. Interfaces, 2015, 7(35), 19691–19699 CAS.
- Q. G. Zhang, Q. L. Liu, S. P. Huang, W. W. Hu and A. M. Zhu, J. Mater. Chem., 2012, 22(21), 10860–10866 RSC.
- K. Lionti, L. Y. Cui, W. Volksen, R. Dauskardt, G. Dubois and B. Toury, ACS Appl. Mater. Interfaces, 2013, 5(21), 11276–11280 CAS.
- J. Huang, K. Li, L. Luo, H. Wang, X. Wang, Y. Feng and X. Liu, Cryst. Growth Des., 2015, 15(5), 2072–2078 CAS.
- L. J. Kirwan, P. Maroni, S. H. Behrens, G. Papastavrou and M. Borkovec, J. Phys. Chem. B, 2008, 112(46), 14609–14619 CrossRef CAS PubMed.
- S. Rose, A. Prevoteau, P. Elziere, D. Hourdet, A. Marcellan and L. Leibler, Nature, 2014, 505(7483), 382–385 CrossRef CAS PubMed.
- S. Kim, J. H. Sung, K. H. Ahn and S. J. Lee, Langmuir, 2009, 25(11), 6155–6161 CrossRef CAS PubMed.
- X. L. Hu, G. M. Hou, M. Q. Zhang, M. Z. Rong, W. H. Ruan and E. P. Giannelis, J. Mater. Chem., 2012, 22(36), 18961–18967 RSC.
- S. Kim, A. Cho, S. Kim, W. Cho, M. H. Chung, F. S. Kim and J. H. Kim, RSC Adv., 2016, 6(23), 19280–19287 RSC.
- M. Samei, M. Iravaninia, T. Mohammadi and A. A. Asadi, Chem. Eng. Process., 2016, 109, 11–19 CrossRef CAS.
- G. De, B. Karmakar and D. Ganguli, J. Mater. Chem., 2000, 10(10), 2289–2293 RSC.
- T. Uragami, K. Okazaki, H. Matsugi and T. Miyata, Macromolecules, 2002, 35(24), 9156–9163 CrossRef CAS.
- R. Guo, X. Ma, C. Hu and Z. Jiang, Polymer, 2007, 48(10), 2939–2945 CrossRef CAS.
- M. Balbaşı and B. Gözütok, Synth. Met., 2010, 160(1–2), 150–155 CrossRef.
- M. L. Minus, H. G. Chae and S. Kumar, Polymer, 2006, 47(11), 3705–3710 CrossRef CAS.
- K. Nakane, T. Yamashita, K. Iwakura and F. Suzuki, J. Appl. Polym. Sci., 1999, 74(1), 133–138 CrossRef CAS.
- B. G. Colvin, Nature, 1974, 248(5451), 756–759 CrossRef CAS.
- L. Chen, K. Zheng, X. Tian, K. Hu, R. Wang, C. Liu, Y. Li and P. Cui, Macromolecules, 2010, 43(2), 1076–1082 CrossRef CAS.
- P. Podsiadlo, A. K. Kaushik, E. M. Arruda, A. M. Waas, B. S. Shim, J. D. Xu, H. Nandivada, B. G. Pumplin, J. Lahann, A. Ramamoorthy and N. A. Kotov, Science, 2007, 318(5847), 80–83 CrossRef CAS PubMed.
- J. C. H. Lai, M. R. Rahman, S. Hamdan, F. K. Liew, M. M. Rahman and M. F. Hossen, J. Appl. Polym. Sci., 2015, 132(15), 7 CrossRef.
- S. Cai, Y. Zhang, H. Zhang, H. Yan, H. Lv and B. Jiang, ACS Appl. Mater. Interfaces, 2014, 6(14), 11470–11475 CAS.
- A. Dang, S. Ojha, C. M. Hui, C. Mahoney, K. Matyjaszewski and M. R. Bockstaller, Langmuir, 2014, 30(48), 14434–14442 CrossRef CAS PubMed.
- M. Maldovan, M. R. Bockstaller, E. L. Thomas and W. C. Carter, Appl. Phys. B, 2003, 76(8), 877–884 CrossRef CAS.
- Y. Q. Li, S. Y. Fu, Y. Yang and Y. W. Mai, Chem. Mater., 2008, 20(8), 2637–2643 CrossRef CAS.
- U. Khan, P. May, H. Porwal, K. Nawaz and J. N. Coleman, ACS Appl. Mater. Interfaces, 2013, 5(4), 1423–1428 CAS.
- T. J. Wood, L. J. Ward and J. P. Badyal, ACS Appl. Mater. Interfaces, 2013, 5(19), 9678–9683 CAS.
Footnote |
| † Electronic supplementary information (ESI) available. See DOI: 10.1039/c6ra25579e |
| This journal is © The Royal Society of Chemistry 2017 |

