 Open Access Article
Creative Commons Attribution 3.0 Unported Licence
Tuning the optical and electrochemical properties of conjugated all-thiophene dendrimers via core functionalization with a benzothiadiazole unit†
Wei Gaoad,
Junkai Wangb,
Qun Luoa,
Yi Linc,
Yuchao Maa,
Junyan Doua,
Hongwei Tan*b,
Chang-Qi Ma*a and
Zheng Cui*a
aPrintable Electronics Research Center, Suzhou Institute of Nano-Tech and Nano-Bionics, Chinese Academy of Sciences, 398 Ruoshui Road, SEID SIP, Suzhou, Jiangsu 215123, PR China. E-mail: cqma2011@sinano.ac.cn; zcui2009@sinano.ac.cn
bCollege of Chemistry, Beijing Normal University, No. 19, XinJieKouWai St., HaiDian District, Beijing, 100875, P. R. China. E-mail: hongwei.tan@bnu.edu.cn
cDepartment of Chemistry, Xi'an Jiaotong Liverpool University, 111 Ren Ai Road, SEID SIP, Suzhou, 215123, P. R. China
dUniversity of Chinese Academy of Sciences, Beijing, 100049, P. R. China
First published on 5th January 2017
Abstract
Three-dimensional (3D) π-conjugated dendrimers are a new class of structurally defined macromolecules for use in organic electronics. Herein, a new family of dendritic oligothiophenes (DOT-c-BTs) up to the 2nd generation with benzothiadiazole (BT) groups at the core have been synthesized by a precise convergent approach. The well-defined chemical structures and the monodispersed nature of these DOT-c-BTs were fully confirmed by NMR spectroscopy, MALDI-TOF mass spectrometry (MALDI-TOF MS), high-resolution mass spectrometry (HR MS), and gel-permeation chromatography (GPC) measurements. The optical and electrochemical properties were investigated by UV-vis absorption, and cyclic voltammetry. The insertion of electron-deficient benzothiadiazole (BT) groups into the core of the conjugated dendritic oligothiophenes resulted in a large redshift compared to all-thiophene dendrimers. Cyclic voltammetry measurements showed one reversible reduction process and multiple oxidation waves for these functionalized dendritic oligothiophenes, due to the reduction of the BT core and the oxidation of different π-conjugated chains, respectively. Applications of DOT-c-BTs in organic solar cells as the electron donor were presented. However, unfavorable nanophase separation in the blended film led to poor device performance.
1. Introduction
Due to their outstanding optical, redox, self-assembling, charge-transport properties and excellent chemical stability, one-dimensional linear oligo- and polythiophenes are among the best investigated and most frequently used organic semiconductor materials in organic electronics,1 including organic solar cells (OSCs),2 organic field-effect transistors (OFETs),3 organic light-emitting transistors,4 and organic light-emitting diodes (OLEDs).5 On the other hand, thiophene-based materials with higher molecular dimensionality, such as 2D cyclic-shaped,6 X-shaped,7 star-shaped8 as well as dendritic structures2a,9 have been reported for use in organic electronics.Conjugated dendrimers are typically three-dimensional (3D) hyperbranched shape-persistent macromolecules with high molecular weights, well-defined and monodisperse chemical structures that are highly controllable due to precise synthetic approaches.2a,10 Therefore, conjugated dendrimers combine the advantages of high molecular weight of polymers and well-defined chemical structure of oligomers.11 Whereas polymers are prone to suffer batch-to-batch variations due to their polydispersity of molecular weights and end-group effects,12 conjugated dendrimers are believed to have better reproducibility owing to their well-defined and monodispersed chemical structures.13 In addition, conjugated dendrimers are also considered as model compounds for elucidating structure–property relationship of conductive polymers, which could serve as important guideline for the molecule structure modification and optimization for developing high performance organic electronic materials.14
So far, various conjugated dendrimers based on different branching blocks have been developed,15 such as benzene,16 phenylene ethynylene,17 truxene,18 carbazole,19 and thiophene.9b,20 Dendritic oligothiophenes (DOTs) are among the most representative organic electronic materials owing to their unique optical and electronic properties. All-thiophene dendrons and dendrimers were synthesized up to a fourth generation by a convergent/divergent approach in 2007, which contains 90 thiophene units in one molecule.21 To increase the functionalities of the thiophene dendrimers, various functional groups, including electron push–pull moiety,14b,22 dye moiety,23 bioactive groups24 have been are introduced to the core,22a–f,23c–e,25 the branching π-bridge,14b,22g,25d and the periphery22g–i,24,26 of dendritic oligothiophenes molecules, demonstrating that DOTs are versatile building blocks for constructing 3D conjugated molecules.
As for the application of these thiophene dendrimers in organic solar cells, Ma et al. first reported that power conversion efficiency (PCE) up to 1.65% was achieved for DOT:PC61BM ([6,6]-phenyl-C61-butyric acid methyl ester) solar cells,14a which was further improved to 3.5% when using PC71BM as the electron acceptor.27 For their all-thiophene structure, the absorption maxima of DOTs are localized at 420–450 nm, which is far from ideal for organic solar cell application. Functionalization of DOTs to improve the light absorption ability by introducing metal complex,23e,25a,28 squaraine dye,23c or electron accepting pyrazino[2,3-g]quinoxaline unit22c on the core, or introducing intramolecular donor–π–acceptor (D–π–A) structures22h,23f were performed. Smaller optical band gaps and broader light absorption spectra were achieved for these materials. However, device performances of these thiophene dendrimer based materials are not satisfied yet.
Benzothiadiazole (BT) was recently proved to be one of the most effective building blocks for the synthesis of organic semiconducting materials, especially for use in organic solar cells.29 It possesses excellent optoelectronic characteristics, such as strong electron-withdrawing nature, intensive light absorption ability, highly conjugated and coplanar structure, and good photochemical stability.30 Till now, a number of narrow band gap BT-based copolymers,31 and small molecules32 show high PCEs in BHJSCs. Herein, we present the synthesis of a new class of BT-core conjugated thiophene dendrimers (DOT-c-BT). The chemical structures of these molecules were proved by NMR spectroscopic, MALDI-TOF mass-spectrometric, and HR MS. MALDI-TOF mass-spectrometric and GPC analysis clearly showed the defined and monodisperse structure of these compounds. The optical and electrochemical properties of these compounds were also investigated in detail. In addition, their photovoltaic performance in BHJSCs with fullerene electron acceptor PC61BM is presented.
2. Experimental
2.1 Materials
Chemicals were purchased and used without further purification: BT-Br2 (Puyang Huicheng Electronic Material Co., Ltd), Pd2(dba)3·CHCl3 (Sigma-Aldrich), HP(t-Bu)3·BF4 (Sigma-Aldrich), TBAF (Energy Chemical), K2CO3 (Enox®). Solvents were purified and dried by usual methods prior to use and typically used under inert gas atmosphere.332.2 Instruments and measurements
Nuclear magnetic resonance (NMR) spectra were recorded on a Bruker Avance III 400 spectrometer (1H NMR: 400 MHz, 13C NMR: 100 MHz). Chemical shifts are denoted in δ (ppm), and were referenced to tetramethylsilane (TMS) via the residual non-deuterated solvent peaks (CDCl3: 1H NMR: 7.26 ppm, 13C NMR: 77.0 ppm; C2D2Cl4: 1H NMR: 6.00 ppm, 13C NMR: 74.0 ppm) as internal standard. The splitting patterns are designated as follows: singlet (s), doublet (d), triplet (t), and multiplet (m). Matrix assisted laser desorption/ionization time-of-flight mass spectrometry (MALDI-TOF MS) were performed on a Bruker Autoflex Speed using trans-2-[3-(4-tert-butylphenyl)-2-methyl-2-propenylidene]malononitrile (DCTB) as the matrix. High resolution mass spectrometry (HRMS) was performed on a Bruker ultraflextreme MALDI-TOF/TOF (operation mode: MALDI; matrix: DCTB). Gel Permeation Chromatography (GPC) measurement was performed on a Waters Breeze separations module apparatus with THF as the eluent (flow rate 1 mL min−1, 35 °C). Number-average molecular weight (Mn) and polydispersity index (Mw/Mn) of compounds were determined by GPC analysis relative to polystyrene standards. UV-vis absorption spectra of these new materials in chloroform (CHCl3) solution and thin film were recorded on a Perkin Elmer Lambda 750 UV-vis Spectrophotometer. For UV-vis absorption spectrum measurement in solution, three concentrated solutions (around 10−4 mol L−1) were prepared independently, each of which were further diluted to get three diluted solutions (with concentration around 10−7 to 10−6 mol L−1) for UV-vis absorption measurement. The absorption spectra of the dilute solutions were recorded, and the data points of the absorbance at a certain wavelength vs. concentration were then plotted. A good linear relationship was found for all these compounds, suggesting no obvious intermolecular interaction was found in such a concentration range. The molecular molar extinction coefficient (ε) was obtained from the slope of the best-fit line over the above mentioned data points according to the Beer–Lambert's law equation, A = εLc. Thin film samples for UV-vis spectra measurement were prepared by spin-casting a chloroform solution on quartz glasses. The photoluminescence (PL) spectra of the DOT-c-BTs in chloroform solution were obtained with an F-4600 fluorescence spectrophotometer.Cyclic voltammetry (CV) experiments were performed with a RST-3000 Electrochemistry Workstation (Suzhou Risetech Instrument Co., Ltd). All CV measurements were carried out at room temperature with a conventional three-electrode configuration under nitrogen atmosphere. The electrochemical cyclic voltammetry was performed in a 0.1 M tetrabutylammonium hexafluorophosphate (TBAPF6)/dichloromethane (DCM) solution with a scan speed of 100 mV s−1. A Pt disk (ϕ = 1 mm) embedded in Teflon was used as the working electrode. The surface was polished before use. A Pt sheet (∼1 cm2) and Ag/AgCl were used as the counter and reference electrodes, respectively. After the measurement, small amount of ferrocene was added in the solution and the ferrocene/ferrocenium (Fc/Fc+) redox couple was measured as an internal standard. Transmission electron microscopy (TEM) tests were performed on a Tecnai G2 F20 S-Twin 200 kV field-emission electron microscope (FEI). Specimens for the TEM experiments were obtained by transferring the floated blend films from the water onto the 200 mesh copper grid.
2.3 Synthesis
![[thin space (1/6-em)]](https://www.rsc.org/images/entities/char_2009.gif) :
:![[thin space (1/6-em)]](https://www.rsc.org/images/entities/char_2009.gif) 1) to give the product (650 mg, 87%). 1H NMR (CDCl3, 400 MHz): δ = 8.18 (s; 2H), 7.88 (s; 2H), 7.25 (d, J = 3.44 Hz; 2H), 7.21 (d, J = 3.36 Hz; 2H), 7.18 (d, J = 3.40 Hz; 2H), 7.15 (d, J = 3.44 Hz; 2H), 0.345 (s; 18H), 0.323 ppm (s; 18H). 13C NMR (CDCl3, 100 MHz): δ = 152.35, 142.51, 142.21, 140.83, 140.14, 137.16, 134.24, 133.52, 132.31, 130.50, 128.58, 128.05, 125.28, 125.17, −0.007, −0.099; MALDI-TOF MS: m/z calcd for C42H48N2S7Si4 (matrix: DCTB): 916.1, found: 916.3; HRMS: m/z calcd for C42H48N2S7Si4: 916.0940; found: 916.0958.
1) to give the product (650 mg, 87%). 1H NMR (CDCl3, 400 MHz): δ = 8.18 (s; 2H), 7.88 (s; 2H), 7.25 (d, J = 3.44 Hz; 2H), 7.21 (d, J = 3.36 Hz; 2H), 7.18 (d, J = 3.40 Hz; 2H), 7.15 (d, J = 3.44 Hz; 2H), 0.345 (s; 18H), 0.323 ppm (s; 18H). 13C NMR (CDCl3, 100 MHz): δ = 152.35, 142.51, 142.21, 140.83, 140.14, 137.16, 134.24, 133.52, 132.31, 130.50, 128.58, 128.05, 125.28, 125.17, −0.007, −0.099; MALDI-TOF MS: m/z calcd for C42H48N2S7Si4 (matrix: DCTB): 916.1, found: 916.3; HRMS: m/z calcd for C42H48N2S7Si4: 916.0940; found: 916.0958.![[thin space (1/6-em)]](https://www.rsc.org/images/entities/char_2009.gif) :
:![[thin space (1/6-em)]](https://www.rsc.org/images/entities/char_2009.gif) 1) to give the product (123 mg, 90%). 1H NMR (CDCl3, 400 MHz): δ = 8.16 (s; 2H), 7.87 (s; 2H), 7.34–7.35 (dd, J1 = 1.20 Hz, J2 = 3.24 Hz; 2H), 7.33–7.34 (dd, J1 = 1.20 Hz, J2 = 3.32 Hz; 2H), 7.22–7.23 (dd, J1 = 1.16 Hz, J2 = 3.60 Hz; 2H), 7.16–7.17 (dd, J1 = 1.20 Hz, J2 = 3.56 Hz; 2H), 7.03–7.08 (m; 4H). 13C NMR (C2D2Cl4, 100 MHz): δ = 152.42, 137.31, 137.14, 134.85, 133.63, 132.59, 130.37, 127.80, 127.31, 127.22, 127.03, 126.94, 125.82, 125.38, 125.35; MALDI-TOF MS: m/z calcd for C30H16N2S7 (matrix: DCTB): 627.9, found: 628.1; HRMS: m/z calcd for C30H16N2S7: 627.9358; found: 627.9374.
1) to give the product (123 mg, 90%). 1H NMR (CDCl3, 400 MHz): δ = 8.16 (s; 2H), 7.87 (s; 2H), 7.34–7.35 (dd, J1 = 1.20 Hz, J2 = 3.24 Hz; 2H), 7.33–7.34 (dd, J1 = 1.20 Hz, J2 = 3.32 Hz; 2H), 7.22–7.23 (dd, J1 = 1.16 Hz, J2 = 3.60 Hz; 2H), 7.16–7.17 (dd, J1 = 1.20 Hz, J2 = 3.56 Hz; 2H), 7.03–7.08 (m; 4H). 13C NMR (C2D2Cl4, 100 MHz): δ = 152.42, 137.31, 137.14, 134.85, 133.63, 132.59, 130.37, 127.80, 127.31, 127.22, 127.03, 126.94, 125.82, 125.38, 125.35; MALDI-TOF MS: m/z calcd for C30H16N2S7 (matrix: DCTB): 627.9, found: 628.1; HRMS: m/z calcd for C30H16N2S7: 627.9358; found: 627.9374.2.4 Fabrication and characterization of the organic solar cells
Photovoltaic devices were fabricated with the configuration of ITO/PEDOT:PSS/DOTs:PC61BM active layer/LiF/Al. The indium tin oxide (ITO) coated glass substrates were cleaned sequentially by ultrasonic in detergent, deionized water, acetone and isopropanol for 30 min each. After an additional treatment for 30 minutes in ultraviolet-ozone chamber, a thin layer (30–40 nm) of PEDOT:PSS (Clevios P VP AI 4083, filtered through 0.45 μm) was spin-coated onto each substrate at 3500 rpm for 10 min, the substrates were transferred into a nitrogen-filled glove box (O2 and H2O <1 ppm). After annealing in a glove box at 124 °C for 1 min, the substrates were cooled to room temperature. Compound DOTs and PC60BM were dissolved in chloroform (CF), then stirred for 4 h. The substrates were spin-coated with the solution of DOT-c-BT:PC61BM in chloroform to form the photoactive layer. The cathode made of LiF (1 nm) and aluminum (100 nm) was sequentially deposited by vacuum evaporation under high vacuum (<10−4 Pa). The effective area of the devices was 0.16 cm2 and 0.09 cm2.The current density–voltage (J–V) characteristics was measured in a N2-filled glove box using a Keithley 2400 source meter under an AM 1.5G filter (100 mW cm−2) generated by white light from halogen tungsten lamp, filtered by a Schott GG385 UV filter and a Hoya LB120 daylight filter. External quantum efficiencies (EQE) were measured under simulated one sun operation condition using bias light from a 532 nm solid state laser (Changchun New Industries, MGL-III-532). Light from a 150 W tungsten halogen lamp (Osram 64610) was used as probe light and modulated with a mechanical chopper before passing the monochromator (Zolix, Omni-λ300) to select the wavelength. The response was recorded as the voltage by an I–V converter (DNR-IV Convertor, Suzhou D&R Instruments), using a lock-in amplifier (Stanford Research Systems SR 830). A calibrated Si cell was used as reference. The device for EQE measurement was kept behind a quartz window in a nitrogen filled container.
3. Results and discussion
3.1 Synthesis and structure characterization
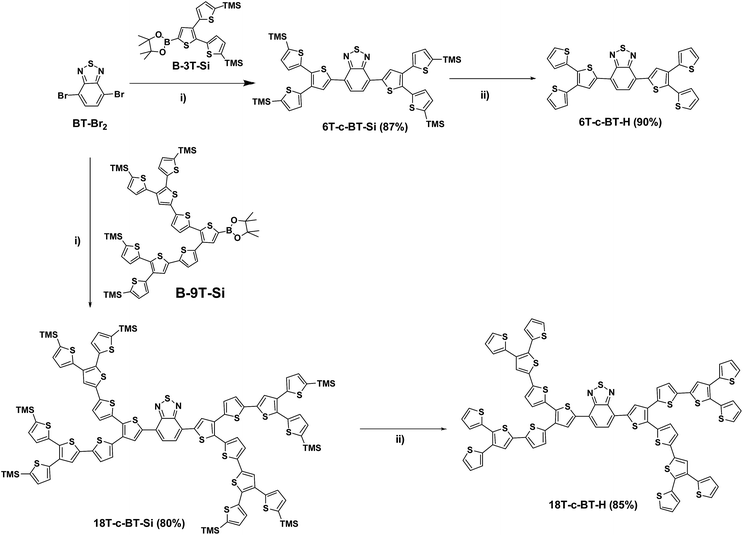
In detail, the TMS-protected first generation (G1) benzothiadiazole core-functionalized dendrimer 6T-c-BT-Si was obtained by Suzuki cross-coupling of the core building block BT-Br2 and the first-generation (G1) dendritic boronic ester B-3T-Si at room temperature using [Pd2(dba)3]·CHCl3/HP(t-Bu)3BF4 as catalyst in 87% yield (Scheme 1, reaction (i)). The TMS-protecting groups of 6T-c-BT-Si were successfully removed by tetrabutylammonium fluoride hydrate (TBAF) in THF, thus yielding non-protected G1 dendrimer 6T-c-BT-H in 90% yield (Scheme 1, reaction (ii)). The G1 dendrimers 6T-c-BT-Si and 6T-c-BT-H were efficiently purified by chromatography on silica gel.
The TMS-protected second-generation (G2) dendrimer 18T-c-BT-Si was synthesized by Suzuki cross-coupling reaction of BT-Br2 with two equivalents of the G2 boronic ester B-9T-Si in 80% yield. Similar to 6T-c-BT-H, the deprotected G2 dendrimer 18T-c-BT-H was synthesized by removing the TMS groups of 18T-c-BT-Si with TBAF in 85% yield. The purification of G2 dendrimers 18T-c-BT-Si and 18T-c-BT-H were performed by size-exclusion chromatography (SEC, Bio-Rad Beads SX-1) eluting with THF.
![[thin space (1/6-em)]](https://www.rsc.org/images/entities/char_2009.gif) :
:![[thin space (1/6-em)]](https://www.rsc.org/images/entities/char_2009.gif) Hb
Hb![[thin space (1/6-em)]](https://www.rsc.org/images/entities/char_2009.gif) :
:![[thin space (1/6-em)]](https://www.rsc.org/images/entities/char_2009.gif) Hc is 1
Hc is 1![[thin space (1/6-em)]](https://www.rsc.org/images/entities/char_2009.gif) :
:![[thin space (1/6-em)]](https://www.rsc.org/images/entities/char_2009.gif) 1
1![[thin space (1/6-em)]](https://www.rsc.org/images/entities/char_2009.gif) :
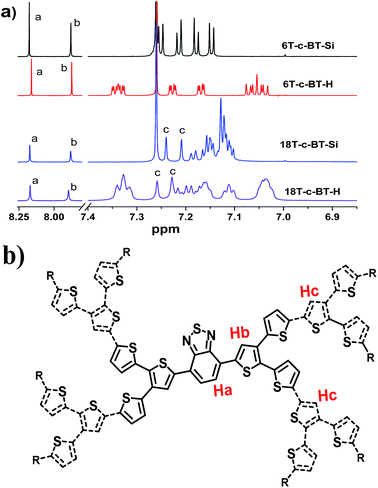
:![[thin space (1/6-em)]](https://www.rsc.org/images/entities/char_2009.gif) 2, matching well the molecular structure. The 1H resonance peaks become broader and featureless with the increase of molecular size, which was ascribed to more complicated molecular structure and stronger intermolecular interactions.
2, matching well the molecular structure. The 1H resonance peaks become broader and featureless with the increase of molecular size, which was ascribed to more complicated molecular structure and stronger intermolecular interactions.
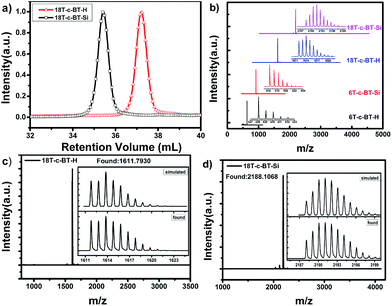
To further confirm the chemical structure of these compounds, the molecular weight of these BT core-functionalized dendrimers were checked by GPC, MALDI-TOF-MS and high-resolution mass-spectrometry analysis (HR MS, see ESI† for details). Fig. 2a shows the GPC traces for 18T-c-BT-H and 18T-c-BT-Si. The polydispersity indices (PDI) of these two dendritic molecules were a constant of 1.01, thus indicating a high degree of monodispersity of these two compounds. Fig. 2b shows the MALDI-TOF mass spectrum of DOT-c-BTs. As can be seen here, all these compounds show one sharp molecular-ion peak, which indicated well-defined and monodisperse structures of these dendrimers. In addition, the HR MS patterns of the 2nd generation derivatives (18T-c-BT-Si, and 18T-c-BT-H) fits very well the corresponding simulated one (Fig. 2c and d), unambiguously confirmed the chemical structure of these big molecules.
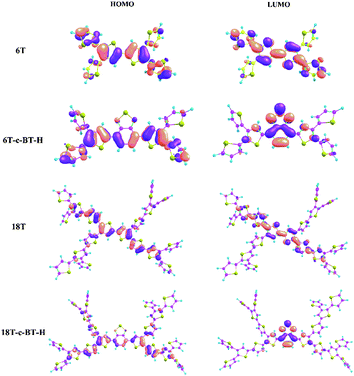
To investigate the effects of BT functional group on molecular geometries and electronic structures of these functionalized thiophene dendrimers, density functional theory (DFT) calculations were carried out by using the Gaussian 09 program with B3LYP/6-31G approach. Calculated optimal molecular conformations and the frontier molecular orbitals (FMOs) including highest occupied molecular orbital (HOMO) and the lowest unoccupied molecular orbital (LUMO) are shown in Fig. 3, and the related data are listed in Table 2. As shown in Fig. 3, the result obtained from optimized conformations suggests that the electron density distributions of the HOMO levels of all molecules are located in the longest α-conjugated chain included in the corresponding dendrimers, indicating a strong and efficient intra-molecular charge transfer (ICT) interaction in the molecular backbones. At the same time, the electron density distributions of LUMO for BT core-functionalized dendrimers is mainly localized on the electron-deficient BT units, while that of all-thiophene dendrimer (6T and 18T) is located in the longest α-conjugated chain (see details in ESI†). Accordingly, the HOMO levels of BT core-functionalized dendrimers vary only marginally with introducing of BT group compared with all-thiophene dendrimer. On the other hand, in comparison with corresponding all-thiophene dendrimer, the LUMO levels of BT core-functionalized dendrimers (6T-c-BT-H and 18T-c-BT-H) have a large decrease, which leads to a smaller band gap. Such a molecular orbital difference can be also seen from the UV-vis absorption spectra and cyclic voltammetry curves (vide infra).
3.2 UV-vis absorption and fluorescence spectroscopy
UV-vis and fluorescence spectroscopy of the BT core-functionalized dendrimers were measured in chloroform. Fig. 4a depicts the UV-vis absorption and fluorescence spectra of the synthesized DOT-c-BTs in chloroform solution, and the optical data are listed in Table 1. For comparison, the optical data of the reference compounds 6T and 18T are also listed in Table 1.34 In comparison with all-thiophene dendrimers with the same number of thiophene units, the absorption onset of BT core-functionalized dendrimer show a significant redshift, which suggests the formation of intramolecular charge transfer state of the compounds owing to the introduction of BT units.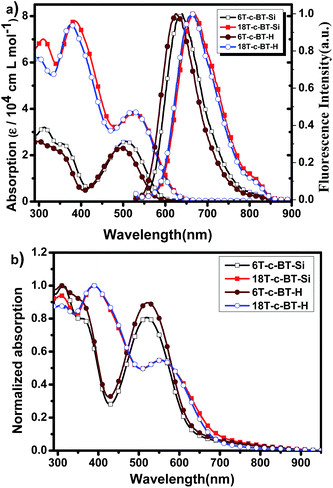 | ||
| Fig. 4 (a) UV-vis absorption and normalized fluorescence spectra of DOT-c-BTs in chloroform solution (1 × 10⁻⁶ mol L−1); (b) normalized UV-vis absorption spectra of DOT-c-BTs thin films. | ||
| Compound | λsolmaxa (nm) | εsola,b [cm−1 L mol−1] | λsolonseta (nm) | λemmaxc (nm) | Eopt(sol)ga,d (eV) | λfilmmaxe (nm) | λfilmonsete (nm) | Eopt(film)ge,f (eV) |
|---|---|---|---|---|---|---|---|---|
| a In CHCl3 solution (10−6 mol L−1).b Extinction coefficient in solution was obtained by linear fitting absorbance vs. concentration.c The maxima emission peak with the excitation wavelength.d Optical band gap estimated from the absorption edge in solution, Eopt(sol)g (eV) = 1240/λsolonset (nm).e Spin-coated from CHCl3 solution onto the quartz.f Optical band gap in solid film, Eopt(film)g (eV) = 1240/λfilmonset (nm).g From ref. 34. | ||||||||
| 6T-c-BT-Si | 506 | 26![[thin space (1/6-em)]](https://www.rsc.org/images/entities/char_2009.gif) 230 230 |
588 | 640 | 2.10 | 520 | 629 | 1.97 |
| 6T-c-BT-H | 495 | 23![[thin space (1/6-em)]](https://www.rsc.org/images/entities/char_2009.gif) 060 060 |
576 | 626 | 2.15 | 522 | 632 | 1.96 |
| 6T g | 289 | 25![[thin space (1/6-em)]](https://www.rsc.org/images/entities/char_2009.gif) 900 900 |
449 | 462 | 2.76 | — | — | — |
| 384 | 21![[thin space (1/6-em)]](https://www.rsc.org/images/entities/char_2009.gif) 600 600 |
|||||||
| 18T-c-BT-Si | 384 | 77![[thin space (1/6-em)]](https://www.rsc.org/images/entities/char_2009.gif) 900 900 |
623 | 667 | 1.99 | 556 | 694 | 1.79 |
| 524 | 37![[thin space (1/6-em)]](https://www.rsc.org/images/entities/char_2009.gif) 650 650 |
|||||||
| 18T-c-BT-H | 375 | 76![[thin space (1/6-em)]](https://www.rsc.org/images/entities/char_2009.gif) 280 280 |
622 | 666 | 1.99 | 556 | 685 | 1.81 |
| 522 | 38![[thin space (1/6-em)]](https://www.rsc.org/images/entities/char_2009.gif) 650 650 |
|||||||
| 18T g | 392 | 78![[thin space (1/6-em)]](https://www.rsc.org/images/entities/char_2009.gif) 000 000 |
528 | 554 | 2.35 | — | — | — |
Similar to the all-thiophene dendrimers,21 these BT-functionalized compounds displayed broad and structureless absorption bands (Fig. 4a). As can be seen from this figure, BT core-functionalized dendrimer showed two absorption bands. One high energy band is ranging from 300 to 450 nm, which can be assigned to absorption of dendritic oligothiophenes.34 The other band located in the low energy band ranging of 450 to 650 nm can be assigned to an intramolecular charge transfer state between dendritic oligothiophenes and benzothiadiazole unit. Interestingly, the molar absorption coefficients of these BT cored dendrimers in both absorption bands increased with the increase of molecular generation. The increase of high energy bands was ascribed to the superimposition of the absorption of the conjugated oligothiophene unit, similar to that of the all-thiophene dendrons and dendrimers,34 whereas the increase of the low energy band indicates an more efficient intramolecular interaction between dendritic oligothiophenes and benzothiadiazole unit for the bigger molecules. As a general trend, bathochromic shifts of the absorption onset were observed clearly with increasing the generation of dendrimers. Optical band gap (Eg) of these compounds determined from the absorption onset λonsetabs decreases also with the increase of molecular size, which was ascribed to the larger π-conjugated oligothiophene building blocks. In addition, a sight redshift of absorption profile was observed for TMS-protecting dendrimers relative to their desilylated counterpart, which is similar to that in all-thiophene dendrons and dendrimers,34 and was ascribed to the electron donating ability of the TMS groups. Fig. 4b shows the absorption spectra of the DOT-c-BTs in thin solid film, compared with in chloroform solution, bathochromic shifts and broader absorption spectrum were observed obviously for BT core-functionalized dendrimers in thin solid films, which was ascribed to the intensive intermolecular interaction in solid state.
The fluorescence spectra of the BT core-functionalized dendrimers in chloroform are also shown in Fig. 4a. The fluorescence emission spectra can be considered as the result of the electronic transition of the longest-conjugated chromophore included in the corresponding dendrimers.34 The maximum emission wavelengths (λmaxfl) of the DOT-c-BTs are obviously redshifted with the increase of molecular size from 1st generation to 2nd generation, indicating a more expanded π-conjugated system for the larger dendrimers, which is in accordance with the trend of the UV-vis absorption onset wavelength. In addition, similarly to their all-thiophene dendrimers,34 the fluorescence profile typically is independent of the excitation wavelength (see ESI Fig. S1† for more details), which indicates an efficient intramolecular energy transfer. Compared to all-thiophene dendrimers, λmaxfl of the BT core-functionalized dendrimers shows an obvious redshift, which confirms that the attachment of BT unit efficiently expands the conjugated length of dendrimers.
3.3 Redox properties and molecular energy levels
The electrochemical properties of the BT core-functionalized dendrimers were investigated by cyclic voltammetry (CV) and differential pulse voltammetry (DPV) in dichloromethane (for 18T-c-BT-H, it was measured in o-dichlorobenzene due to the low solubility) with Bu4NPF6 as supporting electrolyte. Fig. 5a shows cyclic voltammograms of DOT-c-BTs, and the DPV curves of these compounds are shown in Fig. S2 in ESI.† Interestingly, all these compounds showed one reversible reduction process over the negative potential range (0 to −2.0 V), the reversible reduction process was ascribed to the reduction of the BT core unit. The standard reduction potentials were determined to be around −1.6 V vs. Fc+/Fc and vary only marginally with increasing molecular size, suggesting that the peripheral DOT units do not influence the redox behavior of the BT core.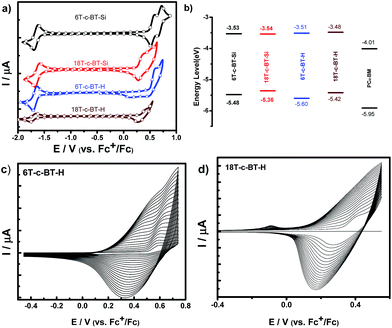 | ||
| Fig. 5 (a) Cyclic voltammograms of 6T-c-BT-Si, 18T-c-BT-Si, 6T-c-BT-H (1 × 10⁻³ mol L−1 in CH2Cl2), 18T-c-BT-H (1 × 10⁻³ mol L−1 in o-dichlorobenzene) tetrabutylammonium hexafluorophosphate (TBAPF6, 0.1 M), scan rate = 100 mV s−1 versus ferrocene/ferrocenium (Fc+/Fc); (b) representation of HOMO–LUMO energy levels of selected dendritic compounds obtained by electrochemical data. The values for PC61BM are also given for comparison and were taken from reference,36 (c) multiple scans cyclic voltammogram of 6T-c-BT-H at 1 × 10⁻³ mol L−1 in CH2Cl2 (TBAPF6 (0.1 M), room temperature, V = 100 mV s−1); (d) multiple scans cyclic voltammogram of 18T-c-BT-H at 1 × 10⁻³ mol L−1 in o-dichlorobenzene (TBAPF6 (0.1 M), room temperature, V = 100 mV s−1). | ||
In the positive potential regime, the oxidation potentials of these compounds depend on the molecular structure. For example, the 1st generation TMS-protected dendrimer 6T-c-BT-Si displays two reversible oxidation processes (E0ox = 0.53, and 0.67 V, respectively) during the positive potential sweeping. For 18T-c-BT-Si, two reversible oxidation processes were measured with E0ox = 0.31, 0.47 V, respectively. Reversible oxidation processes confirm that the oxidized species of the DOT-c-BTs molecules are stable in solution during the potential sweeping.34 First oxidative potential for higher generational dendrimers was estimated from DPV measurements. It worth also to note that, the onset oxidation potential is negatively shifted with increasing molecular size due to extended π-conjugation, which is in accordance with the UV/vis spectroscopic results. Similar to non-protected all-thiophene dendrons and dendrimers,34 the TMS-free DOT-c-BTs undergo electropolymerization during potential sweeping, yielding corresponding hyperbranched polymers (Fig. 5c and d).
HOMO/LUMO energy levels as well as the band gaps (ECVg) of these compounds were determined from the onset oxidation (Eonsetox) and the onset reduction potentials (Eonsetred) according to eqn (1) and (2),
| EHOMO = −(Eonsetox + 5.10) (eV) | (1) |
| ELUMO = −(Eonsetred + 5.10) (eV) | (2) |
| ECVg = Eonsetox − Eonsetred (eV) | (3) |
| E0ox1b (V) | E0ox2b (V) | Eonsetox (V) | E0redb (V) | Eonsetred (V) | EHOMOc (eV) | ELUMOd (eV) | ECVge (eV) | EcalHOMOf (eV) | EcalLUMOf (eV) | Ecalgg (eV) | |
|---|---|---|---|---|---|---|---|---|---|---|---|
| a [M] = 1 × 10⁻³ mol L−1 in CH2Cl2, TBAPF6 (0.1 M), 295 K, V = 100 mV s−1, versus (Fc+/Fc).b Determined by DPV measurements.c Calculated from the cyclic voltammograms, EHOMO = −[Eonsetox + 5.10] (eV), where the vacuum energy level of Fc+/Fc was set as −5.10 eV.d Calculated from the cyclic voltammograms, ELUMO = −[Eonsetred + 5.10] (eV), where the vacuum energy level of Fc+/Fc was set as −5.10 eV.e ECVg = Eonsetox − Eonsetred (eV).f B3LYP/6-31G energies by DFT.g B3LYP/6-31G HOMO–LUMO energy gaps.h [M] = 1 × 10⁻³ mol L−1 in o-dichlorobenzene, TBAPF6 (0.1 M), 295 K, V = 100 mV s−1, versus (Fc+/Fc).i From ref. 34.j From ref. 36. | |||||||||||
| 6T | 0.58i | 0.86i | 0.53i | — | — | −5.63i | −2.87i | — | −5.25 | −2.13 | 3.12 |
| 6T-c-BT-H | 0.54 | 0.68 | 0.50 | −1.68 | −1.59 | −5.60 | −3.51 | 2.09 | −5.22 | −3.12 | 2.1 |
| 6T-c-BT-Si | 0.53 | 0.67 | 0.48 | −1.64 | −1.57 | −5.48 | −3.53 | 2.05 | — | — | — |
| 18T | 0.46i | 0.53i | 0.42i | — | — | −5.52i | −3.17i | — | −4.96 | −2.58 | 2.38 |
| 18T-c-BT-H h | 0.35 | — | 0.32 | −1.70 | −1.62 | −5.42 | −3.48 | 1.94 | −4.99 | −3.18 | 1.81 |
| 18T-c-BT-Si | 0.31 | 0.47 | 0.26 | −1.63 | −1.56 | −5.36 | −3.54 | 1.82 | — | — | — |
| PC61BM | — | — | — | — | — | −5.91j | −4.01j | 1.90j | — | — | — |
3.4 Application of these compounds as electron donor in organic solar cells
To evaluate the photovoltaic performances of the novel synthesized BT core-functionalized DOTs molecules, solution processed photovoltaic devices were fabricated with the structure: ITO/PEDOT:PSS/DOT-c-BT:PC61BM/LiF/Al, where DOT-c-BT molecules were used as the electron donor and PC61BM as the electron acceptor components. The thickness of the photoactive layers optimized for each DOT-c-BT:PC61BM by varying the spin speed during spin-coating and the concentration of solution was found to be around 60–80 nm. The current–voltage (J–V) curves under simulated AM1.5G illumination and EQE response spectra of the optimized devices are shown in Fig. 6a and b, respectively. The optimized photovoltaic performance of the DOT-c-BT devices was summarized in Table 3. As can be seen from the Table 3, the open circuit voltages (VOC) for these DOT-c-BT based devices are in the range of 0.81–1.06 V. For first generation dendrimers 6T-c-BT-Si and 6T-c-BT-H, the VOC values even up to 1.04 V and 1.06 V, respectively, which are similar to that in all-thiophene dendrons and dendrimers.14a The first-generation TMS-free dendrimer, 6T-c-BT-H, when blended with PC61BM, displayed a short-circuit current density (JSC) of 2.42 mA cm−2, an open-circuit voltage (VOC) of 1.06 V, and a fill factor (FF) of 0.35, leading to an overall power conversion efficiency (PCE) of 1.04%. The VOC was found to be decreased with the increase of molecular size, which may be ascribed to the slightly higher HOMO energy level for the larger molecules (vide supra). However, all these BT based photovoltaic devices showed relative low power conversion efficiency owing to the low JSC and low FF values. The low JSC can be attributed to the poor EQE response of the devices. As can be seen from Fig. 6b, EQE spectra of these devices also showed low incident photon-to-current efficiency.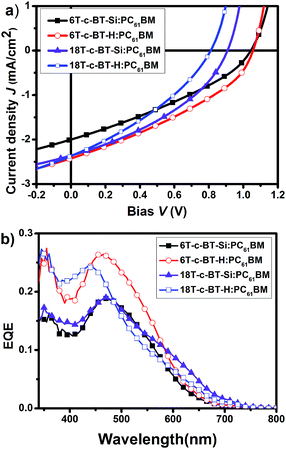 | ||
| Fig. 6 (a) J–V curves of the optimized DOT-c-BT:PC61BM based BHJ solar cells illuminated under standard AM1.5G conditions (100 mW cm−2); (b) EQE spectra of the corresponding devices. | ||
| Donor | Acceptor | EQEmaxb (wavelength [nm]) | D![[thin space (1/6-em)]](https://www.rsc.org/images/entities/char_2009.gif) : :![[thin space (1/6-em)]](https://www.rsc.org/images/entities/char_2009.gif) A A |
JSCc [mA cm2] | VOC [V] | FF | PCE [%] |
|---|---|---|---|---|---|---|---|
| a With a standard device structure of ITO/PEDOT:PSS/DOT-c-BT:PC61BM or PC71BM/LiF/Al.b External quantum efficiencies (EQE) were measured under simulated one sun operation condition using bias light from a 532 nm solid state laser.c JSC determined by integrating the EQE spectrum with the AM1.5 G spectrum.d From ref. 14a. | |||||||
| 6T-c-BT-Si | PC61BM | 0.19(465) | 1![[thin space (1/6-em)]](https://www.rsc.org/images/entities/char_2009.gif) : :![[thin space (1/6-em)]](https://www.rsc.org/images/entities/char_2009.gif) 2 2 |
2.00 | 1.04 | 0.33 | 0.67 |
| 6T-c-BT-H | 0.26(465) | 1![[thin space (1/6-em)]](https://www.rsc.org/images/entities/char_2009.gif) : :![[thin space (1/6-em)]](https://www.rsc.org/images/entities/char_2009.gif) 3 3 |
2.42 | 1.06 | 0.35 | 1.04 | |
| 18T-c-BT-Si | 0.19(470) | 1![[thin space (1/6-em)]](https://www.rsc.org/images/entities/char_2009.gif) : :![[thin space (1/6-em)]](https://www.rsc.org/images/entities/char_2009.gif) 4 4 |
2.36 | 0.91 | 0.38 | 0.82 | |
| 18T-c-BT-H | 0.24(435) | 1![[thin space (1/6-em)]](https://www.rsc.org/images/entities/char_2009.gif) : :![[thin space (1/6-em)]](https://www.rsc.org/images/entities/char_2009.gif) 3 3 |
2.37 | 0.81 | 0.34 | 0.65 | |
| 6T-c-BT-Si | PC71BM | 0.18(500) | 1![[thin space (1/6-em)]](https://www.rsc.org/images/entities/char_2009.gif) : :![[thin space (1/6-em)]](https://www.rsc.org/images/entities/char_2009.gif) 2 2 |
2.32 | 0.92 | 0.27 | 0.58 |
| 6T-c-BT-H | 0.28(505) | 1![[thin space (1/6-em)]](https://www.rsc.org/images/entities/char_2009.gif) : :![[thin space (1/6-em)]](https://www.rsc.org/images/entities/char_2009.gif) 2 2 |
3.70 | 1.04 | 0.32 | 1.23 | |
| 18T-c-BT-Si | 0.34(475) | 1![[thin space (1/6-em)]](https://www.rsc.org/images/entities/char_2009.gif) : :![[thin space (1/6-em)]](https://www.rsc.org/images/entities/char_2009.gif) 3 3 |
4.52 | 0.93 | 0.32 | 1.35 | |
| 18T-c-BT-H | 0.40(400) | 1![[thin space (1/6-em)]](https://www.rsc.org/images/entities/char_2009.gif) : :![[thin space (1/6-em)]](https://www.rsc.org/images/entities/char_2009.gif) 3 3 |
3.55 | 0.79 | 0.43 | 1.21 | |
| 18T-Sid | PC61BM | 0.28(435) | 1![[thin space (1/6-em)]](https://www.rsc.org/images/entities/char_2009.gif) : :![[thin space (1/6-em)]](https://www.rsc.org/images/entities/char_2009.gif) 4 4 |
2.39 | 0.94 | 0.35 | 0.79 |
To further understand the photovoltaic performance of these DOT-c-BT, bulk heterojunction solar cells based on IC61BA and PC71BM were fabricated and tested. The IC61BA based cells showed very poor device performance, which was mainly due to the low JSC of these devices (ESI Fig. S3†). The PC71BM based cells, on the other hand, showed improved JSC than that of the PC61BM based cells, mainly due to the improved JSC as can be seen from the J–V and EQE spectra (Fig. 7 and Table 3), and higher PCE were achieved for the DOT-c-BT based cells, except for the 6T-c-BT-Si cell.
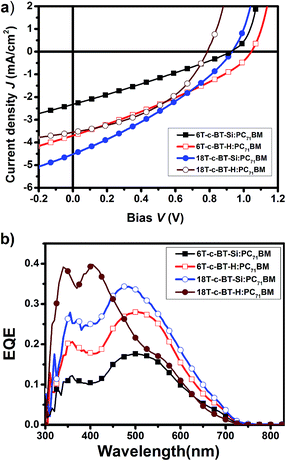 | ||
| Fig. 7 (a) J–V curves of the optimized DOT-c-BT:PC71BM based BHJ solar cells illuminated under standard AM1.5G conditions (100 mW cm−2); (b) EQE spectra of the corresponding devices. | ||
To understand the intermolecular interactions between these DOT-c-BT and PC61BM, fluorescence quenching of the 6T-c-BT-H and 18T-c-BT-Si with PC61BM were carried out. Fig. S4† depicts the fluorescence quenching results. For comparison, the fluorescence quenching of P3HT film was also measured, and the results are showed in Fig. S4c.† As can be seen here, the fluorescence of 6T-c-BT and 18T-c-BT-Si was fully quenched by mixing with PC61BM with a blend ratio of 1![[thin space (1/6-em)]](https://www.rsc.org/images/entities/char_2009.gif) :
:![[thin space (1/6-em)]](https://www.rsc.org/images/entities/char_2009.gif) 1 (w/w). The fluorescence quenching efficiency was even higher for 6T-c-BT-H and 18T-c-BT-Si than P3HT. These results demonstrate that intermolecular charge transfer between DOT-c-BT and fullerene is very efficient. On the other hand, these results indicate also that DOT-c-BT molecules are well intermixed with fullerene molecules, which might lead to less phase separation.
1 (w/w). The fluorescence quenching efficiency was even higher for 6T-c-BT-H and 18T-c-BT-Si than P3HT. These results demonstrate that intermolecular charge transfer between DOT-c-BT and fullerene is very efficient. On the other hand, these results indicate also that DOT-c-BT molecules are well intermixed with fullerene molecules, which might lead to less phase separation.
To better understand the reason for the low device performance, the photoactive layer morphology of DOT-c-BT:PC61BM blend film was measured by transmission electron microscope (TEM). Fig. 8 presents TEM images of the DOT-c-BT:PC61BM films fabricated under the optimal conditions. The images of DOT-c-BT:PC61BM show uniform and almost featureless contrast, indicating a low degree of phase separation. The unfavorable morphology would not facilitate efficient exciton dissociation. At the same time, the morphology also lacks bicontinuous interpenetrating network, which is essential to effective exciton dissociation and carrier transport.37 In the process of fabricating solar cells, the TMS-containing dendrimers displayed good solubility in common organic solvents. However, for G2 TMS-free dendrimers (18T-c-BT-H) had very low solubility, which may lead to poor film formation by spin coating process. Further optimization of nanomorphology by various approaches is still needed to achieve high device performance.
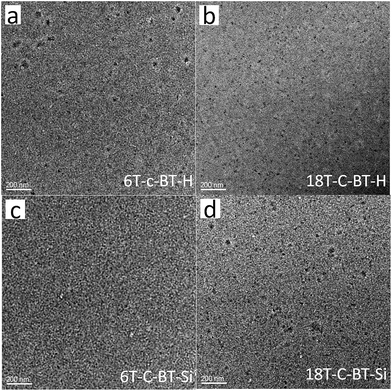 | ||
| Fig. 8 Bright-field TEM images of DOT-c-BTs:PC61BM blend films. (a) 6T-c-BT-H; (b) 18T-c-BT-H; (c) 6T-c-BT-Si; (d) 18T-c-BT-Si. | ||
4. Conclusions
In summary, a novel series of three dimensional conjugated dendritic oligothiophenes with BT unit at the core were synthesized by a stepwise synthesis approach. The chemical structures of all these BT core-functionalized DOTs are fully characterized, including NMR, GPC, MALDI-TOF-MS and HR-MS. Both MS and GPC analysis showed the monodisperse nature of these molecules. Characterization of the optical and electrochemical properties of the BT core-functionalized DOTs revealed that the BT groups linked to the dendritic oligothiophene yielded a bathochromic shift in the absorption spectra and a smaller optical band gaps compared with all-thiophene dendrimers. Preliminary applications in organic photovoltaic devices of these BT core-functionalized DOTs showed a moderate performance with efficiencies in the range from 0.58 to 1.35%. Unfavorable nanophase separation in the blend films was the main reason for the low JSC of these devices.Acknowledgements
The authors greatly appreciate the financial supports from the National Natural Science Foundation of China (Grant No. 21274163, 21573020, 21303252) and Natural Science Foundation of Jiangsu Province (Grant No. BK20130352).Notes and references
- (a) M. E. Cinar and T. Ozturk, Chem. Rev., 2015, 115, 3036–3140 CrossRef CAS PubMed; (b) D. Fichou, Handbook of Oligo- and Polythiophenes, Wiley-VCH, New York, 2007 Search PubMed; (c) I. F. Perepichka and D. F. Perepichka, Handbook of Thiophene-based Materials: Applications in Organic Electronics and Photonics, John Wiley & Sons, Ltd, 2009 Search PubMed.
- (a) A. Mishra, C.-Q. Ma and P. Bäuerle, Chem. Rev., 2009, 109, 1141–1276 CrossRef CAS PubMed; (b) R. Fitzner, E. Reinold, A. Mishra, E. Mena-Osteritz, H. Ziehlke, C. Körner, K. Leo, M. Riede, M. Weil, O. Tsaryova, A. Weiß, C. Uhrich, M. Pfeiffer and P. Bäuerle, Adv. Funct. Mater., 2011, 21, 897–910 CrossRef CAS; (c) Y. Chen, X. Wan and G. Long, Acc. Chem. Res., 2013, 46, 2645–2655 CrossRef CAS PubMed; (d) M. Zhang, X. Guo, W. Ma, H. Ade and J. Hou, Adv. Mater., 2014, 26, 5880–5885 CrossRef CAS PubMed; (e) V. Malytskyi, J.-J. Simon, L. Patrone and J.-M. Raimundo, RSC Adv., 2015, 5, 354–397 RSC.
- (a) C. Wang, H. Dong, W. Hu, Y. Liu and D. Zhu, Chem. Rev., 2012, 112, 2208–2267 CrossRef CAS PubMed; (b) X. Gao and Z. Zhao, Sci. China: Chem., 2015, 58, 947–968 CrossRef CAS; (c) P. H. Chu, L. Zhang, N. S. Colella, B. Fu, J. O. Park, M. Srinivasarao, A. L. Briseno and E. Reichmanis, ACS Appl. Mater. Interfaces, 2015, 7, 6652–6660 CrossRef CAS PubMed.
- C. Zhang, P. Chen and W. Hu, Small, 2016, 12, 1252–1294 CrossRef CAS PubMed.
- F. Perepichka, D. F. Perepichka, H. Meng and F. Wudl, Adv. Mater., 2005, 17, 2281–2305 CrossRef.
- (a) F. Zhang, G. Gotz, H. D. Winkler, C. A. Schalley and P. Bauerle, Angew. Chem., Int. Ed., 2009, 48, 6632–6635 CrossRef CAS PubMed; (b) M. Iyoda and H. Shimizu, Chem. Soc. Rev., 2015, 44, 6411–6424 RSC.
- (a) X. B. Sun, Y. Q. Liu, S. Y. Chen, W. F. Qiu, G. Yu, Y. Q. Ma, T. Qi, H. J. Zhang, X. J. Xu and D. B. Zhu, Adv. Funct. Mater., 2006, 16, 917–925 CrossRef CAS; (b) X. B. Sun, Y. H. Zhou, W. C. Wu, Y. Q. Liu, W. J. Tian, G. Yu, W. F. Qiu, S. Y. Chen and D. B. Zhu, J. Phys. Chem. B, 2006, 110, 7702–7707 CrossRef CAS PubMed; (c) H. Shang, H. Fan, Y. Liu, W. Hu, Y. Li and X. Zhan, J. Mater. Chem., 2011, 21, 9667–9673 RSC.
- T. Jarosz, M. Lapkowski and P. Ledwon, Macromol. Rapid Commun., 2014, 35, 1006–1032 CrossRef CAS PubMed.
- (a) C.-Q. Ma, Frontiers of Optoelectronics in China, 2011, 4, 12–23 CrossRef; (b) M. Scheuble, M. Goll and S. Ludwigs, Macromol. Rapid Commun., 2015, 36, 115–137 CrossRef CAS PubMed.
- H. John, R. Bauer, P. Espindola, P. Sonar, J. Heinze and K. Mullen, Angew. Chem., Int. Ed., 2005, 44, 2447–2451 CrossRef CAS PubMed.
- F. Zhang, D. Wu, Y. Xu and X. Feng, J. Mater. Chem., 2011, 21, 17590 RSC.
- (a) D. Ni, B. Zhao, T. Shi, S. Ma, G. Tu and H. Wu, ACS Macro Lett., 2013, 2, 621–624 CrossRef CAS; (b) Y. Lin and X. Zhan, Acc. Chem. Res., 2016, 49, 175–183 CrossRef CAS PubMed.
- M. E. Köse, W. J. Mitchell, N. Kopidakis, C. H. Chang, S. E. Shaheen, K. Kim and G. Rumbles, J. Am. Chem. Soc., 2007, 129, 14257–14270 CrossRef PubMed.
- (a) C.-Q. Ma, M. Fonrodona, M. C. Schikora, M. M. Wienk, R. A. J. Janssen and P. Bäuerle, Adv. Funct. Mater., 2008, 18, 3323–3331 CrossRef CAS; (b) A. Mishra, C.-Q. Ma, R. A. J. Janssen and P. Bäuerle, Chem.–Eur. J., 2009, 15, 13521–13534 CrossRef CAS PubMed; (c) A. J. Mozer, C.-Q. Ma, W. W. H. Wong, D. J. Jones, P. Bäuerle and G. G. Wallace, Org. Electron., 2010, 11, 573–582 CrossRef CAS.
- A. L. Kanibolotsky, I. F. Perepichka and P. J. Skabara, Chem. Soc. Rev., 2010, 39, 2695–2728 RSC.
- (a) B. A. Hammer and K. Müllen, Chem. Rev., 2016, 116, 2103–2140 CrossRef CAS PubMed; (b) B. A. Hammer, R. Moritz, R. Stangenberg, M. Baumgarten and K. Mullen, Chem. Soc. Rev., 2015, 44, 4072–4090 RSC; (c) A. J. Berresheim, M. Müller and K. Müllen, Chem. Rev., 1999, 99, 1747–1785 CrossRef CAS PubMed.
- J. S. Moore, Acc. Chem. Res., 1997, 30, 402–413 CrossRef CAS.
- K. Shi, J. Y. Wang and J. Pei, Chem. Rec., 2015, 15, 52–72 CrossRef CAS PubMed.
- (a) J. Ding, B. Zhang, J. Lu, Z. Xie, L. Wang, X. Jing and F. Wang, Adv. Mater., 2009, 21, 4983–4986 CrossRef CAS PubMed; (b) J. Li, T. Zhang, Y. Liang and R. Yang, Adv. Funct. Mater., 2013, 23, 619–628 CrossRef CAS; (c) P. Thongkasee, A. Thangthong, N. Janthasing, T. Sudyoadsuk, S. Namuangruk, T. Keawin, S. Jungsuttiwong and V. Promarak, ACS Appl. Mater. Interfaces, 2014, 6, 8212–8222 CrossRef CAS PubMed.
- (a) C. Xia, X. Fan, J. Locklin and R. C. Advincula, Org. Lett., 2002, 4, 2067–2070 CrossRef CAS PubMed; (b) C. Xia, X. Fan, J. Locklin, R. C. Advincula, A. Gies and W. Nonidez, J. Am. Chem. Soc., 2004, 126, 8735–8743 CrossRef CAS PubMed.
- C.-Q. Ma, E. Mena-Osteritz, T. Debaerdemaeker, M. M. Wienk, R. A. J. Janssen and P. Bäuerle, Angew. Chem., Int. Ed., 2007, 46, 1679–1683 CrossRef CAS PubMed.
- (a) W. J. Mitchell, N. Kopidakis, G. Rumbles, D. S. Ginley and S. E. Shaheen, J. Mater. Chem., 2005, 15, 4518–4528 RSC; (b) M. Mastalerz, V. Fischer, C.-Q. Ma, R. A. J. Janssen and P. Bäuerle, Org. Lett., 2009, 11, 4500–4503 CrossRef CAS PubMed; (c) G. L. Schulz, M. Mastalerz, C.-Q. Ma, M. Wienk, R. A. J. Janssen and P. Bäuerle, Macromolecules, 2013, 46, 2141–2151 CrossRef CAS; (d) F. Lincker, B. Heinrich, R. De Bettignies, P. Rannou, J. Pécaut, B. Grévin, A. Pron, B. Donnio and R. Demadrille, J. Mater. Chem., 2011, 21, 5238–5247 RSC; (e) W. W. Wong, C.-Q. Ma, W. Pisula, A. Mavrinskiy, X. Feng, H. Seyler, D. J. Jones, K. Müllen, P. Bäuerle and A. B. Holmes, Chem.–Eur. J., 2011, 17, 5549–5560 CrossRef CAS PubMed; (f) W. W. H. Wong, C.-Q. Ma, W. Pisula, C. Yan, X. Feng, D. J. Jones, K. Müllen, R. A. J. Janssen, P. Bäuerle and A. B. Holmes, Chem. Mater., 2010, 22, 457–466 CrossRef CAS; (g) W.-S. Zhang, Dissertation, University of Ulm, 2014; (h) W. Zhang, G. M. Ng, H. L. Tam, M. S. Wong and F. Zhu, J. Polym. Sci., Part A: Polym. Chem., 2011, 49, 1865–1873 CrossRef CAS; (i) B. L. Rupert, W. J. Mitchell, A. J. Ferguson, M. E. Köse, W. L. Rance, G. Rumbles, D. S. Ginley, S. E. Shaheen and N. Kopidakis, J. Mater. Chem., 2009, 19, 5311–5324 RSC.
- (a) S. Deng, S. Sriwichai, P. Taranekar, G. Krueger, J. W. Mays and R. C. Advincula, Chem. Commun., 2011, 47, 8805–8807 RSC; (b) J. Zhang, M. K. Fischer, P. Bauerle and T. Goodson, J. Phys. Chem. B, 2013, 117, 4204–4215 CrossRef CAS PubMed; (c) W. Kylberg, Y. Zhang, A. Aebersold, F. A. d. Castro, T. Geiger, J. Heier, S. Kuster, C.-Q. Ma, P. Bäuerle, F. Nüesch, J.-N. Tisserant and R. Hany, Org. Electron., 2012, 13, 1204–1212 CrossRef CAS; (d) Y. Suda, R. Nishiyabu and Y. Kubo, Tetrahedron, 2015, 71, 4174–4182 CrossRef CAS; (e) R. Satapathy, M. Ramesh, H. Padhy, I. H. Chiang, C.-W. Chu, K.-H. Wei and H.-C. Lin, Polym. Chem., 2014, 5, 5423–5435 RSC; (f) M. Tomassetti, F. Ouhib, I. Cardinaletti, P. Verstappen, A. Salleo, C. Jérôme, J. Manca, W. Maes and C. Detrembleur, RSC Adv., 2015, 5, 85460–85469 RSC.
- S. Schmid, A. Mishra, M. Wunderlin and P. Bäuerle, Org. Biomol. Chem., 2013, 11, 5656–5665 CAS.
- (a) M. K. R. Fischer, I. López-Duarte, M. M. Wienk, M. V. Martínez-Díaz, R. A. J. Janssen, P. Bäuerle and T. Torres, J. Am. Chem. Soc., 2009, 131, 8669–8676 CrossRef CAS PubMed; (b) M. K. R. Fischer, T. E. Kaiser, F. Würthner and P. Bäuerle, J. Mater. Chem., 2009, 19, 1129–1141 CAS; (c) M. K. R. Fischer, C.-Q. Ma, R. A. J. Janssen, T. Debaerdemaeker and P. Bäuerle, J. Mater. Chem., 2009, 19, 4784–4795 RSC; (d) A. Mishra, E. Mena-Osteritz and P. Bäuerle, Beilstein J. Org. Chem., 2013, 9, 866–876 CrossRef CAS PubMed.
- C.-Q. Ma, W. Pisula, C. Weber, X. L. Feng, K. Müllen and P. Bäuerle, Chem.–Eur. J., 2011, 17, 1507–1518 CrossRef CAS PubMed.
- D. M. Stoltzfus, C.-Q. Ma, R. C. R. Nagiri, A. J. Clulow, P. Bäuerle, P. L. Burn, I. R. Gentle and P. Meredith, Appl. Phys. Lett., 2016, 109, 103302 CrossRef.
- (a) O. O. Adegoke, M. Ince, A. Mishra, A. Green, O. Varnavski, M. V. Martínez-Díaz, P. Bäuerle, T. Torres and T. Goodson, J. Phys. Chem. C, 2013, 117, 20912–20918 CrossRef CAS; (b) S. Deng, G. Krueger, P. Taranekar, S. Sriwichai, R. Zong, R. P. Thummel and R. C. Advincula, Chem. Mater., 2011, 23, 3302–3311 CrossRef CAS.
- J. Du, M. C. Biewer and M. C. Stefan, J. Mater. Chem. A, 2016, 4, 15771–15787 CAS.
- (a) B. A. D. Neto, A. A. M. Lapis, E. N. da Silva Júnior and J. Dupont, Eur. J. Org. Chem., 2013, 228–255 CrossRef CAS; (b) J. W. Jung and W. H. Jo, Chem. Mater., 2015, 27, 6038–6043 CrossRef CAS.
- (a) Y. Liu, J. Zhao, Z. Li, C. Mu, W. Ma, H. Hu, K. Jiang, H. Lin, H. Ade and H. Yan, Nat. Commun., 2014, 5, 5293 CrossRef CAS PubMed; (b) J. Subbiah, B. Purushothaman, M. Chen, T. Qin, M. Gao, D. Vak, F. H. Scholes, X. Chen, S. E. Watkins, G. J. Wilson, A. B. Holmes, W. W. Wong and D. J. Jones, Adv. Mater., 2015, 27, 702–705 CrossRef CAS PubMed.
- (a) J.-L. Wang, Q.-R. Yin, J.-S. Miao, Z. Wu, Z.-F. Chang, Y. Cao, R.-B. Zhang, J.-Y. Wang, H.-B. Wu and Y. Cao, Adv. Funct. Mater., 2015, 25, 3514–3523 CrossRef CAS; (b) L. Yuan, Y. Zhao, J. Zhang, Y. Zhang, L. Zhu, K. Lu, W. Yan and Z. Wei, Adv. Mater., 2015, 27, 4229–4233 CrossRef CAS PubMed.
- W. L. F. Armarego and C. L. L. Chai, Purification of Laboratory Chemical, Butterworth-Heinemann, Oxford, 7th edn, 2013 Search PubMed.
- C.-Q. Ma, E. Mena-Osteritz, M. Wunderlin, G. Schulz and P. Bäuerle, Chem.–Eur. J., 2012, 18, 12880–12901 CrossRef CAS PubMed.
- T. Johansson, W. Mammo, M. Svensson, M. R. Andersson and O. Inganäs, J. Mater. Chem., 2003, 13, 1316–1323 RSC.
- J. Wu, Y. Ma, N. Wu, Y. Lin, J. Lin, L. Wang and C.-Q. Ma, Org. Electron., 2015, 23, 28–38 CrossRef CAS.
- M. Shao, J. K. Keum, R. Kumar, J. Chen, J. F. Browning, S. Das, W. Chen, J. Hou, C. Do, K. C. Littrell, A. Rondinone, D. B. Geohegan, B. G. Sumpter and K. Xiao, Adv. Funct. Mater., 2014, 24, 6647–6657 CrossRef CAS.
Footnote |
| † Electronic supplementary information (ESI) available. See DOI: 10.1039/c6ra25567a |
| This journal is © The Royal Society of Chemistry 2017 |

