
 Open Access Article
 This Open Access Article is licensed under a Creative Commons Attribution-Non Commercial 3.0 Unported Licence
SO2 capture by ionic liquid and spectroscopic speciation of sulfur(IV) therein†
Y. Yasaka*,
K. Watanabe and
Y. Kimura *
*
Department of Molecular Chemistry and Biochemistry, Faculty of Science and Engineering, Doshisha University, Kyotanabe, Kyoto 610-0321, Japan. E-mail: yokimura@mail.doshisha.ac.jp
First published on 19th January 2017
Abstract
The absorption of equimolar sulfur dioxide (SO2) by tributyloctylphosphonium bicarbonate ([P4448]HCO3) resulted in the formation of a corresponding bisulfite ionic liquid ([P4448][bisulfite]) accompanied by carbon dioxide (CO2) release. The liquid formed absorbed an additional 0.6 equivalents of SO2. The speciation of sulfur(IV) in the SO2-loaded ionic liquid was performed using Raman and NMR spectroscopies. The two known isomeric forms of bisulfite ion in aqueous systems were identified while the condensation of bisulfite anion was suppressed in [P4448][bisulfite]. The isomer with the proton bonded to the sulfur atom (HSO3−) was more abundant than the one with the proton bonded to the oxygen atom (HOSO2−). The isomeric exchange rate was much slower in the IL than in water as distinguished by 1H NMR. When excess SO2 was absorbed by [P4448][bisulfite], the presence of molecular SO2 and HS2O5− were suggested by Raman bands as an indication of concerted physisorption and chemisorption.
Introduction
Sulfur dioxide is an environmental pollutant emitted in large amounts wherever petroleum is burnt. The onsite capture of sulfur dioxide by a liquid absorbent is an option to address the pollution issue. Ionic liquids (ILs) are liquid salts that are derived from organic cations. They are practically nonvolatile and can capture various gases.1 Although there are numerous studies on the carbon dioxide (CO2) capture by ILs,1–19 the studies on the SO2 capture by ILs are rather limited. The physisorption of SO2 by ILs has been demonstrated by J. L. Anderson et al.20 for 1-n-hexyl-3-methylimidazolium bis(trifluoromethylsulfonyl)imide and 1-n-hexyl-3-methylpyridinium bis(trifluoromethylsulfonyl)imides. These two ILs absorb nearly equimolar SO2 at 25 °C and 0.1 MPa. Interestingly, the absorption capacity of SO2 and CO2 as a function of pressure can be roughly scaled by the reduced pressure, which is the actual pressure divided by the saturation pressure of each gas at the measurement temperature.20 In attempt to attain even higher absorption capacity (especially in weight basis) and/or in targeting absorptions at lower SO2 pressures, a number of “functionalized ILs” have been developed.21–29 It has been found that several functional groups are in particular effective for enhancing SO2 absorption. These include X− (X = halogen),21 –NH2 (amino),22,23 –O− (alkoxide and phenoxide),24 –COO− (carboxylate),25–28 –SO3− (sulfonate),26 –N−–CO- (acylamide)29 groups, all of which have electron-rich atoms. Actual chemical forms of sulfur in these absorbents are not well understood. Based on the vibrational spectral shift of SO2 and the colour change of the solution by absorption, it is argued that charge-transfer interaction is operating when SO2 is absorbed by 1-butyl-3-methylimidazolium bromide.21SO2 is an acid oxide and thus can be captured by bases, as is done in wet limestone scrubbing process. The usage of ILs with basic anion component is especially attractive for capturing SO2. In the present study we demonstrate SO2 absorption by a newly synthesized IL, tributyloctylphosphonium bicarbonate ([P4448]HCO3). From spectroscopic analysis we show that this IL absorbs an equimolar of SO2 via “gas exchange” reaction (eqn (1)).
| [P4448]HCO3 + SO2 ⇄ [P4448]HSO3 + CO2 | (1) |
Interestingly we also find that the IL can capture additional SO2, after completion of eqn (1). It is quite an interesting issue how SO2 molecules are dissolved in the IL.
It has been known that bisulfite ion is subject to complicated equilibriums in aqueous solutions.30–32 Raman spectroscopy has provided evidence of condensation (eqn (2)) and isomerization (eqn (3)) equilibriums for bisulfate ions.30–39
| 2HSO3− ⇄ S2O52− + H2O | (2) |
| HSO3− ⇄ HOSO2− | (3) |
The hydrogen atom is directly bonded with the sulfur atom in the left-hand side of eqn (3), while the hydrogen atom is bonded with the oxygen atom in the right hand side of eqn (3). Note that the isomer on the right in eqn (3) is present only in solution and its identity is not fully determined. The assignment of sulfur Raman bands in water have been debated for several decades. The coexistence of many structurally different but somewhat similar chemical species often induced confusions about overlapped and closely placed bands. The HSO3− isomer is identified by combined Raman/X-ray33 and Raman/neutron34 analysis of solid CsDSO3. It is characterized in aqueous solution as well by vibrational spectroscopy owing to the well resolved band of the SH stretching mode at 2530 cm−1 (νSH). The disulfite ion can be also isolated as a crystalline compound40 and strong Raman bands have been unambiguously assigned.35 For other species, they are metastable and are always accompanied by equilibrium “contaminants”. The presence of HOSO2− isomer in aqueous solution has been deduced from Raman spectroscopic observation36 and later supported by NMR,41 XANES,34 and computational studies.42–44 There are also several speculative discussions on the existence of the dimers of sulfite anion,37,45 and several bands remain unassigned. In the present study, analysis of the sulfite Raman bands in the IL is carried out, which in turn aids in confirming the band assignments in aqueous systems.
NMR spectroscopy is complementary to Raman spectroscopy, particularly for quantification. A series of 17O NMR spectroscopic studies have been carried out by Horner et al. to investigate the equilibrium constants and the rates of eqn (2) and (3) in aqueous solutions.41,46 Although 17O NMR spectroscopy is straightforward for sulfur(IV) oxoanions, it gives limited information regarding the IL due to severe line broadening. Alternatively, 1H NMR provides direct evidence for the bisulfite isomerization in eqn (3) owing to the slowdown of the chemical exchange. In this work, we performed combined NMR and Raman spectroscopic investigations on the sulfur(IV) speciation in ILs to shed light on the absorption mechanism of SO2 by ILs.
Experimental
Sample preparation
The IL, tributyloctylphosphonium bicarbonate ([P4448]HCO3) was obtained as follows. Bromooctane (Wako Chemicals) was reacted with 0.9 equiv. of tributylphosphine (Wako Chemicals) at 108 °C for 24 h. The obtained liquid (crude [P4448]Br) was shaken vigorously with 1.1 equiv. of aqueous KPF6 (Aldrich) and dichloromethane. The separation of two phases yielded dichloromethane solution of [P4448]PF6. Upon evaporation of dichloromethane, the crude [P4448]PF6 was recrystallized 3 times from methanol at −40 °C. The purified and dried [P4448]PF6 showed its melting point of 36 °C. The 2-propanol solution of [P4448]PF6 was mixed with 1.1 equiv. of 2-propanol solution of CsOH (Nacalai Tesque) and hexane (30 wt%). The precipitates (CsPF6) were filtered twice at −80 °C. To the filtrate, excess CO2 was bubbled in and the resultant solution was stirred with active carbon overnight. After filtration, the filtrate was evacuated at 30 °C for solvent removal. The residue was diluted with benzene, and then filtered and evacuated to yield [P4448]HCO3 as highly viscous and almost colourless liquid. The compound was characterized by NMR, IR, and HR-MS which are given at the footnote‡ and in Fig. S1 of the ESI.†The SO2 gas was prepared by the action of concentrated sulfuric acid (Nacalai Tesque) to Na2S2O5 (Nacalai Tesque). The evolved SO2 was transferred to a syringe (100 mL) and then injected into an evacuated 300 mL flask containing 10 g of [P4448]HCO3. The IL was stirred for 30 min to ensure uptake of SO2. Then approximately 0.7 g of the liquid was withdrawn to an NMR tube for NMR and Raman spectroscopic measurements. To the rest of the liquid, additional injections of SO2 were performed in a similar manner to obtain samples at higher SO2 loadings.
In the present work, SO2 loadings in the IL is reported by the mole ratio qSO2, which is defined by the mole of SO2 absorbed by the liquid divided by the mole of the [P4448] cation. Specifically, qSO2 = 1 corresponds to “pure” [P4448][bisulfite]. We use the notation [bisulfite] for including all plausible isomers of HSO3−. The 1H and 13C NMR data for [P4448][bisulfite] are given at the footnote.§ The qSO2 of each sample was calculated by the volume of SO2 injected to the reactor vessel. Nevertheless, this may overestimate the actual loading when part of SO2 injected remained in the gas phase of the reactor at equilibrium. Thus we checked the qSO2 directly by wet titration method for selected samples as follows. After the spectroscopic measurements were finished, the sample was dissolved in water and immediately oxidized by the action of excess KMnO4. The excess KMnO4 was reduced by oxalic acid until the purple colour disappears. To the solution, ammonia solution was added to precipitate Mn2+ from the solution. The moles of SO42− (which is equal to the loading of SO2) was determined by the standard back titration method using aqueous BaCl2 and disodium salts of EDTA as titrants and phthalein complex as an indicator. On the other hand, the mole of the [P4448] cation was determined by the integral of 31P NMR peak (34 ppm) within an accuracy of 2%. Thus obtained values of qSO2 was consistent (±10%) with that determined by the injected volume, indicating that injected SO2 was quantitatively absorbed by the IL up to qSO2 ∼ 1.6 at atmospheric pressure.
NMR measurements
NMR spectra were obtained using a JEOL ECA300 (8.4 T) magnet equipped with a standard 5 mm probe (TH5AT). The 1H NMR spectra were scanned > 8 times with a repetition time of 60 s. The 13C NMR spectra were scanned >256 times with a repetition time of 30 s; the T1 of the HCO3− was 3 s at 25 °C and shorter at lower temperatures. The overlapped 1H NMR peaks due to the HSO3− isomer and the coalesced hydroxyl protons were decomposed by a double Lorentzian function to obtain peak integrals of each component. Due to the high viscosity of the IL and the resultant line broadening, we could not obtain useful information from 17O NMR.47Raman measurements
Raman spectra were measured at the back scattering geometry by using a doubled output of a Nd:YAG laser (Spectra Physics, Excelsior-532-300) as a probing beam. The scattering light was detected by a Peltier-cooled CCD camera attached to the spectrometer (Princeton Instruments, Insight 256E). The Raman shift was calibrated by the Raman spectra of cyclohexane and benzene in the finger print region, and by the line spectra of a neon lamp at the CH-stretching region. Generally, the sample was enclosed in the NMR tube and the Raman scattering was measured at the room temperature. For the measurement at the low temperature, the temperature was regulated by circulating the temperature controlled water and methanol mixture through the cell holder. The sample was yellowish at qSO2 > 1 and turned green at the laser spot while the Raman spectra were collected. The background signals in the Raman measurement were slightly dependent on the SO2 loading, which were subtracted by making proper baseline signals by connecting the signal points where no Raman signal detected.Electronic state calculations
DFT calculations were performed using the basis set of 6-311G+(d,p) or aug-cc-pVTZ and the B3PW91 functional by gaussian-09.48Results and discussion
NMR spectroscopic analysis
We prepared an IL containing sulfur(IV) species by loading various amounts of SO2 into a dried bicarbonate IL, [P4448]HCO3. Since SO2 is a stronger acid than CO2, we expect the anion exchange reaction in eqn (1) to occur. In fact, when the bicarbonate IL was brought in contact with SO2, evolution of bubbles was observed. To confirm the progress of eqn (1), 13C NMR spectra were collected for each sample. The spectra are shown in Fig. S2.† The bicarbonate anion was observed at 159 ppm in pure [P4448]HCO3. The peak integral monotonously decreased as the SO2 injection was repeated, indicating the escape of the bicarbonate anion as gaseous CO2. Molecular CO2 in the IL (which would appear at 125 ppm, if present) was not detected. The cation peak significantly sharpened with the SO2 uptake which is related to the decrease in viscosity.1H NMR spectra for the samples are shown in Fig. 1. In 1H NMR spectra, a peak emerged at 10 ppm. This peak has not been reported by NMR studies on aqueous bisulfite salts. The chemical shift was insensitive to temperature (Fig. S3†), which indicates that the peak is not of a hydroxyl proton. As mentioned in the Introduction, two isomers are proposed for the bisulfite anion (eqn (3)). We elucidate that the peak is due to HSO3−, the isomer without the hydroxyl proton. A broad peak was observed spanning from 13 to 10 ppm in [P4448]HCO3 (qSO2 = 0) and it moved towards 4 ppm as SO2 loading increased. The peak shifted rightwards at an elevated temperature (Fig. S3†), which indicates hydrogen bonding. Thus we attribute this peak to the species that have hydroxyl protons, namely HCO3− and HOSO2−. It is presumable that they exchange their protons rapidly and give a single but broad coalesced NMR signal. The drastic chemical shift change with increasing SO2 loading is ascribed to the decrease of HCO3− and the concomitant increase of HOSO2−; the chemical shift of a coalesced peak is the weighted average of the intrinsic chemical shifts of individual components. As established from Fig. 1, these are 12 and 4 ppm for HCO3− and HOSO2−, respectively. The large chemical shift value of HCO3− implies the presence of tight hydrogen bonds, such as those found in the carboxylic acid dimer. The chemical shift value of HOSO2− is typical for a hydrogen-bonded OH group.
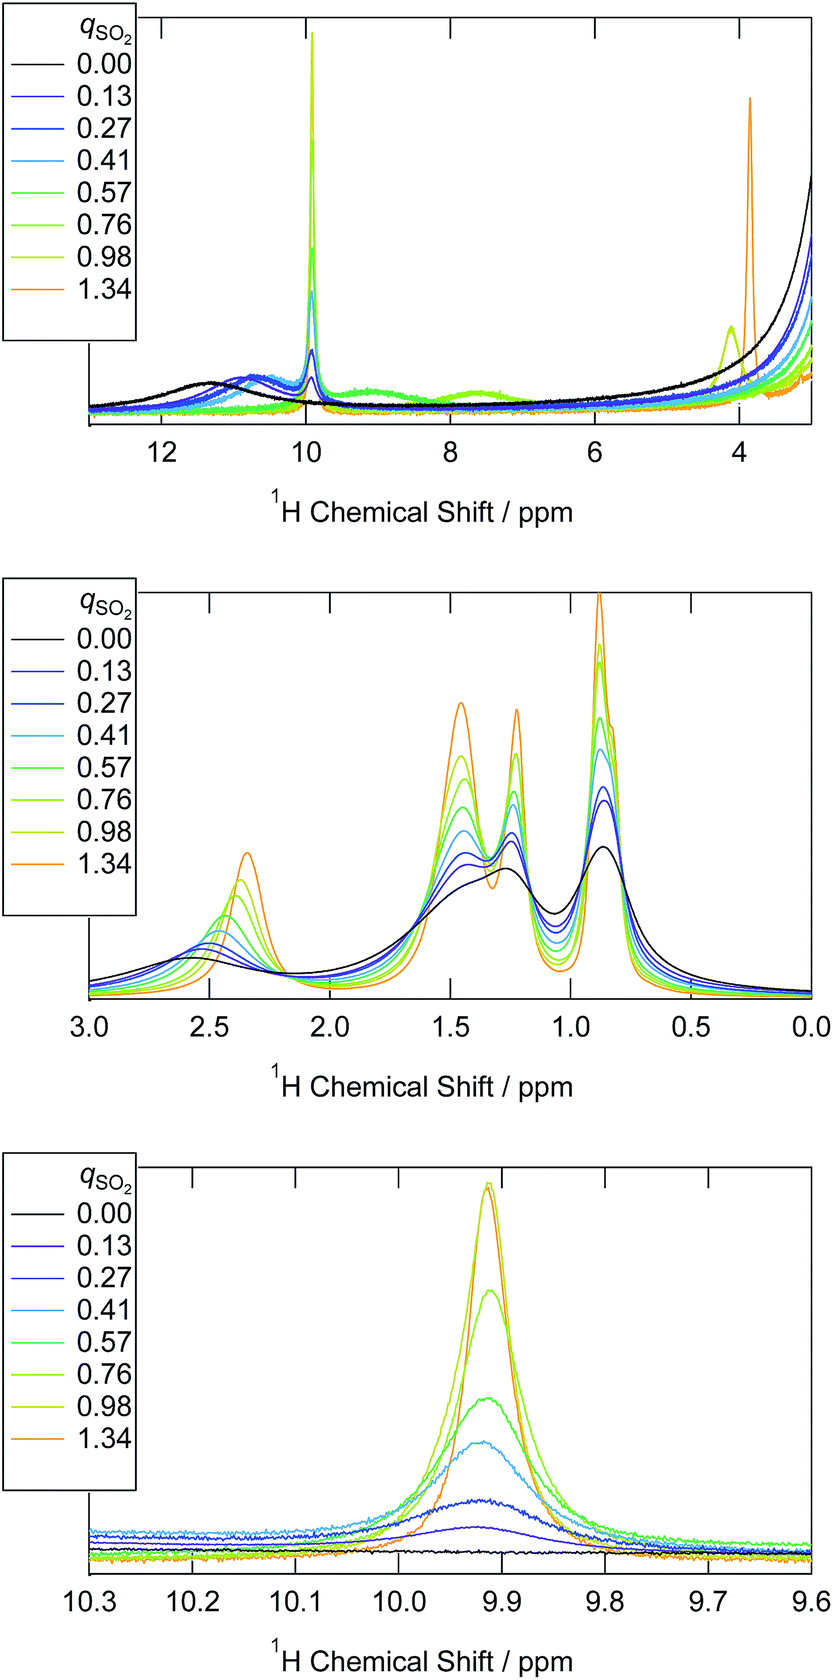 | ||
| Fig. 1 1H NMR spectra of the [P4448]HCO3 and the ILs that have absorbed SO2 by various mole ratios (qSO2) at 298 K. | ||
The fact that we observe separate 1H NMR peaks for the two bisulfite isomers HSO3− and HOSO2− implies that the proton exchanges between the two isomers are relatively slow (>1 s). Such a situation is very different from that in water; in aqueous bisulfite solution, no 1H NMR peaks other than water is observed. This implies that the two bisulfite isomers rapidly exchange the protons and it is probably mediated by water.
The chemical shift of the α proton (proton attached to the carbon bonded to the P atom) decreased, indicating stronger cation–bicarbonate interactions replaced by weaker cation–bisulfite interactions.
Based on the above peak assignments, we integrated each of the 1H and 13C NMR peaks and compared the peak integrals with those of the [P4448] cation. Whenever overlapped peaks were observed, they were decomposed by Lorentzian functions. This allowed us to evaluate the concentration of chemical species i in terms of the mole ratio (qi) relative to the [P4448] cation (Fig. 2). The HCO3− was quantified by the 13C NMR peak integral (159 ppm). As can be seen from Fig. 2, eqn (1) proceeded quantitatively until the qSO2 reached 1. The HSO3− isomer was quantified by the 1H NMR peak integral (10 ppm). The other isomer was quantified by the coalesced peak for the hydroxyl proton (chemical shift varies) after the HCO3− contribution was subtracted. One needs to consider the possibility of the two bisulfite ions condensing to form S2O52− as in eqn (2). When this would be the case, 1 equiv. of water may also contribute to the coalesced hydroxyl proton peak. As we will see later, S2O52− was not present in samples when qSO2 < 1 according to Raman spectroscopy. Thus, we could safely quantify the HOSO2− isomer from the 1H NMR spectra for qSO2 < 1 as in Fig. 2.
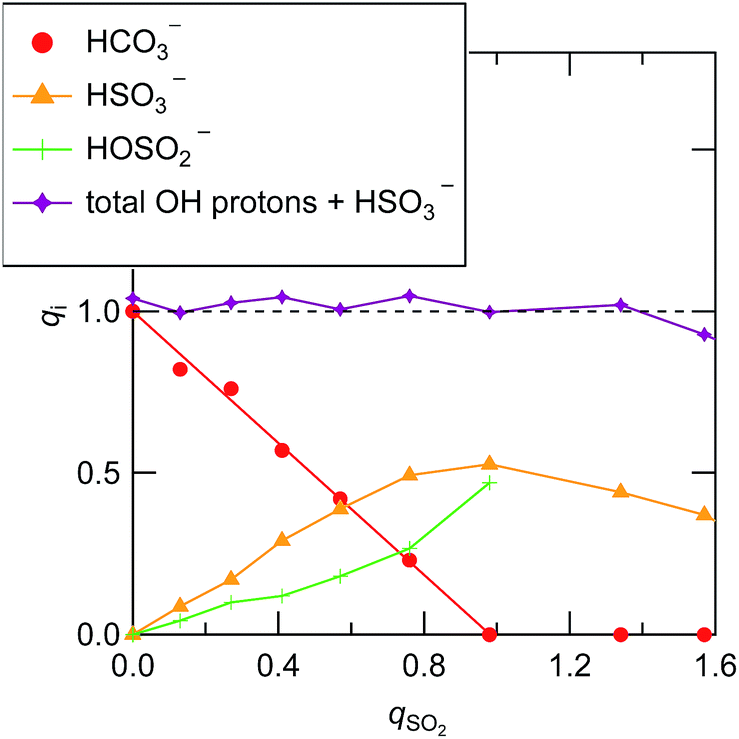 | ||
| Fig. 2 The abundance of bisulfite isomers and the bicarbonate ion in the ILs with the progress of SO2 absorption. The vertical axis denotes to the mole ratio with respect to the [P4448] cation. | ||
When qSO2 exceeded 1,  started to decrease, indicating that HSO3− is consumed to form new sulfur(IV) species. These species were not detected by 1H NMR. In view of high sulfur concentrations, the formation of disulfite ion is plausible. Key information on the sulfur speciation at qSO2 > 1 is provided by Raman spectroscopy in the next section.
As can be seen from Fig. 2, HSO3− is the more abundant of the two bisulfite isomers. The equilibrium quotient of the two isomers (Q = [HOSO2−]/[HSO3−]) was in the range of 0.5 ± 0.1 for the 5 samples whose qSO2 was less than 0.8. Knowing that the corresponding equilibrium quotient is reported to be 3–4 for water,34,41 the isomer population is reversed in the two solvents.
We consider several plausible reasons for the difference. The first is the absence of hydrogen-bonding in ILs. In an aqueous solution, water molecules form hydrogen bonds more strongly with the isomer that has a hydroxyl group than with one that does not. Thus, the former is more favoured in water than the latter.
The second critical difference is the existence of the Coulomb interactions with cations in ILs. The difference in interactions between bisulfite and phosphonium cation may result in different stabilities of the isomer in ILs. In order to test how the interaction with the cation affects the energetic stability of the isomer, we carried out DFT calculations for HSO3− and HOSO2− in vapour, in SCRF water, and as a cluster with one [P4448]+ cation. DFT calculations were done using the basis set aug-cc-pVTZ and B3PW91 functional for the isolated anion in vapour and in SCRF water. For the cluster calculations, we used the 6-311G+(d,p) basis set owing to limitations in computational resources. The optimized structures of the anions and the clusters are shown in Fig. S4 and S5.† Although the cation has conformational flexibility, we limited the calculations for all trans and all gauche conformations (Fig. S5(a) and (b)†). The energies for the optimized structures are listed in Tables S1 and S2,† and the geometrical parameters are listed in Table S3.† According to the calculations, the HOSO2− isomer was stable compared to the HSO3− isomer by 10 kJ mol−1 in vapour when the aug-cc-pVTZ basis set was used. A similar energy value was calculated for that in SCRF water (10 kJ mol−1) as the model does not include the hydrogen-bonding effect. When we used the 6-311G+(d,p) basis set, the energy difference became somewhat larger (32 kJ mol−1). According to the theoretical estimations of the energy difference between HOSO2− and HSO3− performed by several groups using MP2 or DFT calculations, the energy difference between these isomers is quite subtle even for the isolated state in vapour, and depends on the basis sets.42,43 Our calculation results are consistent with previous estimations42 using similar basis sets. The determination of the absolute value at the present level calculation remains challenging. By making clusters with cations, the energy difference between the isomers became somewhat large (41 kJ mol−1 for all trans, 46 kJ mol−1 for all gauche). Therefore, by pairing with a cation, the HOSO2− isomer is energetically more stable than the HSO3− isomer, in contradiction to the expectation from the experimental result. One point to be considered is that the dihedral angels of HO1SO2 and HO1SO3 of HOSO2− (Fig. S4 and S5†) dramatically changed through the complexation with a cation. On the other hand, no significant structure change was calculated for HSO3−. This kind of difference may contribute to isomer stability if more cation molecules surround the anion.
Anion speciation based on Raman spectra
Fig. 3 shows the Raman spectra for [P4448]Br and [P4448]HCO3 in the finger print region. Table S4† summarizes the Raman shifts of the bands observed for these ILs together with those following SO2 loading on [P4448]HCO3. The following Raman bands in Fig. 3 appeared only for the [P4448]HCO3 sample: 996, 1267, 1655, and 1672 cm−1. In reference to the assignments in aqueous solution,49 these bands are νC–OH, νsCO2, and νasCO2 vibrational modes of HCO3−. The other bands are assigned to the vibrational modes of [P4448]+, and they do not seem to be affected by the anion exchange from Br− to HCO3−. In the ESI,† DFT calculations are presented for the [P4448]+ vibrational Raman spectra in all trans or all gauche alkyl-chain conformations using the 6-311G+(d,p) basis set and B3PW91 functional (Fig. S6†). The calculated Raman bands are presented to give the half width at half height of 4 cm−1. The calculation captured majority of the features found in the experimental Raman spectrum. When we used the scaling factor of 0.976 for the horizontal scale, the coincidence between the theory and experiment became much better. The bands could be assigned as follows: (1) the band around 670 cm−1 is due to the symmetric stretching mode of the centre P with four connected carbon atoms; (2) the bands around 900 cm−1 are mostly in-plane-bending of C–C–H at the terminal CH3; (3) the bands around 1100 cm−1 are the bending motions of alkyl-chains; (4) the bands around 1300 cm−1 are the wagging motions of C–C–H2 in the methylene carbons of the alkyl-chain; (5) and the bands around 1450 cm−1 are the scissoring motion of HCH.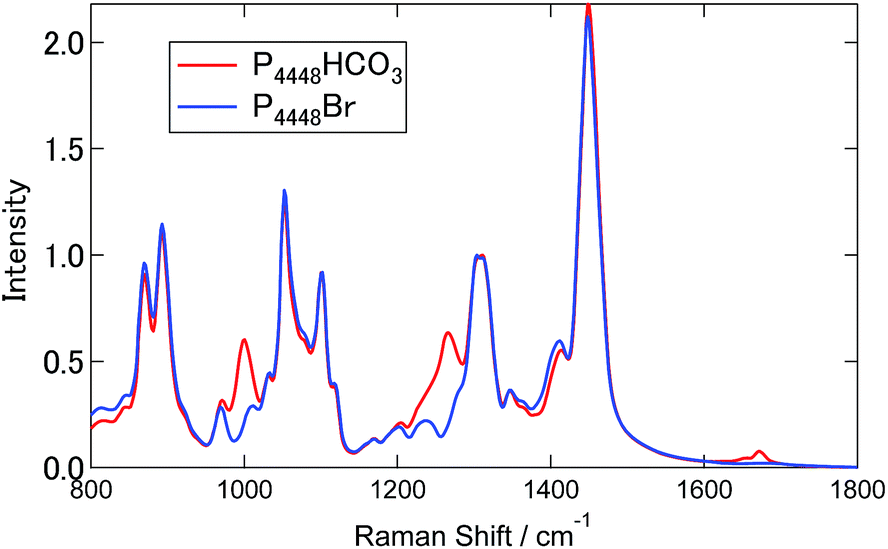 | ||
| Fig. 3 Raman spectra of [P4448]Br and [P4448]HCO3, respectively. | ||
Fig. 4 shows the Raman spectra of [P4448]HCO3 following SO2 absorption. The inset figures are the magnifications around 1050 cm−1. Each spectrum is normalized by the band at 1449 cm−1 (one of the [P4448]+ vibrations). As the amount of SO2 increased, several new bands appeared while the HCO3− bands (621 cm−1, 996 and 1267 cm−1) diminished. Fig. 5 shows difference spectra from the pure [P4448]HCO3. From qSO2 = 0 to 0.98, several new bands (315, 505, and 725 cm−1 in Fig. 5(a); 1029, 1048, 1079, and 1120 cm−1 in Fig. 5(b)) appeared and their intensities increased with increasing qSO2. On the other hand, the HCO3− bands were shown as dips, which gradually deepened with qSO2. Further increase of qSO2 from 0.98 to 1.57 resulted in the emergence of a broad band in the 430–500 cm−1 range in addition to narrower bands at 635 and 1144 cm−1. A large negative dip appeared around 670 cm−1, suggesting a structural change in the cation.
 | ||
| Fig. 4 Raman spectra of [P4448]HCO3 with different qSO2. The inset figure is the magnification around 1050 cm−1. Each spectrum is normalized by the band at 1449 cm−1. | ||
 | ||
| Fig. 5 Difference Raman spectra of [P4448]HCO3 with different qSO2 from neat [P4448]HCO3. (a) From 300 to 800 cm−1. (b) From 950 to 1300 cm−1. | ||
Raman spectra at the SH and CH stretching vibrations are shown in Fig. 6. The spectrum was normalized by the CH stretching region band center of the [P4448]+ cation (2918 cm−1). A characteristic SH stretching band was found at 2440 cm−1. This assignment is confirmed by the Raman shift in aqueous media (∼2530 cm−1)34,36,38,39 and DFT calculations (see below). The intensity of this band increased with increasing qSO2 from 0 to 0.98 and then showed a slight decrease for qSO2 > 1. The frequency of this band showed an increase with increasing qSO2. Interestingly, the lower frequency side band shape of the CH stretching band (2800–3000 cm−1) changed as the qSO2 increased from 0 to 0.98 and then became almost invariant at higher SO2 loadings. A slight change of the intensity at the higher frequency side was also noted.
 | ||
| Fig. 6 Raman spectra of [P4448]HCO3 with different qSO2 for the SH and CH stretching region. The inset figures are the magnifications around 2450 cm−1 and 2920 cm−1 respectively. Each spectrum is normalized by the band at 2918 cm−1. | ||
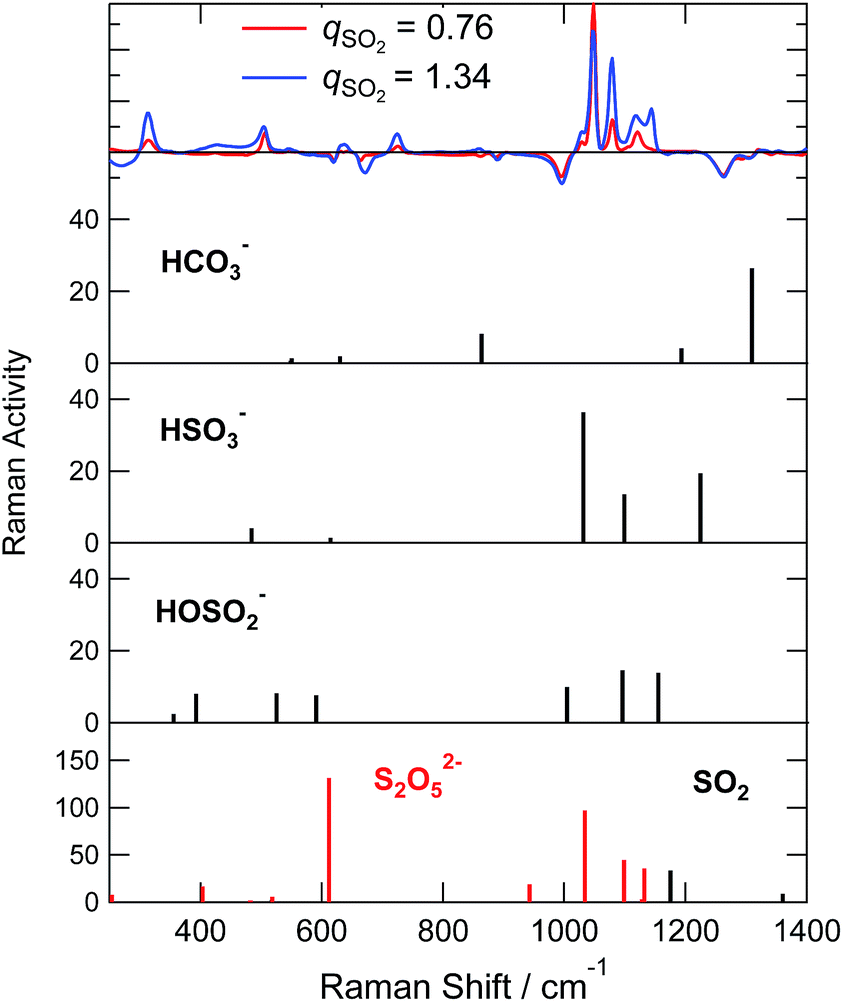
We attempted to assign the characteristic Raman bands particularly seen below 1300 cm−1 by tracking the band intensity changes with SO2 absorption. Based on previous works in aqueous solutions, the following species are plausible: the two bisulfite isomers (HSO3−, HOSO2−), disulfite (pyrosulfite) ion (S2O52−), and molecular SO2. In water, the disulfite anion is formed by the dehydration of 2 bisulfite anions (eqn (2)). We started by assigning those bands that appear only at qSO2 > 1; these are the broad bands around 430–470 cm−1 and two narrower bands at 635 and 1140 cm−1. The band at 1140 cm−1 was assigned to SO2 (physisorption) according to ref. 24 and 26. The bands at 430 and 635 cm−1 could be assigned to the vibrations of S2O52− according to ref. 25, which determined corresponding strong bands at 424 and 655 cm−1 in water. Later in Sec. 3.3, we will discuss the possibility of HS2O5− instead of S2O52− for qSO2 > 1 in more detail. In any case, due to the absence of the marker bands at 1140 cm−1 of SO2 and at 430 cm−1 of disulfite for qSO2 < 1, we concluded that molecular SO2 and disulfite were absent for qSO2 < 1.
From the above discussion, the plausible origins of the new Raman bands observed at qSO2 < 1 are the bisulfite isomers (HSO3−, HOSO2−). The appearance of the SH stretching vibration clearly indicates that the HSO3− isomer is present, while we could not detect a clear Raman band for the HO vibration of the other isomer. The HO vibration has been observed by one IR study of aqueous sulfite solutions at 3620 cm−1,37 and one Raman spectroscopic study at 3145 cm−1.34 The band could be weak, broad or overlapped with C–H vibrations in the IL. The bands at 505 and 1120 cm−1 correspond to the aqueous bands observed at 496–508 cm−1 and 1126–1128 cm−1,34,36,38 both of which have been assigned to the HSO3− in ref. 34. Similarly, we assign the bands at 1079 and 725 cm−1 to HOSO2− using ref. 34 and 36, respectively, although other reports have not mentioned these bands. The bands near 315 cm−1 and 1079 cm−1 are assigned to the vibrations of S2O52− in some publications.33,36,39 As discussed in the previous paragraph, however, we have eliminated the presence of S2O52− at qSO2 < 1.
We evaluated intensities of Raman bands that appear at different SO2 loadings by making a multi-peak fit to the difference spectra (Fig. 5(a) and (b)). The detail of the fitting procedure is described in the ESI† and typical examples are shown in Fig. S7(a).† Note that the 996 cm−1 dip of HCO3− was taken into account by assuming a negative component. Fig. 7 shows the variation of the band intensities as a function of qSO2. The vibrational frequencies of decomposed bands were almost independent of qSO2, and the variations were within ca. 1 cm−1 except for the band assigned to the SH vibration (Fig. S7(b)†). To track the band intensity change, the intensities were normalized to unity at equimolar SO2 loading (qSO2 = 0.98). HCO3− was quantified using the negative integral area of the HCO3− band (996 cm−1) in the difference spectra. When this negative area is normalized, it is the portion (x) of HCO3− consumed upon SO2 absorption. Thus the value was converted to the portion of HCO3− that is remaining by 1 − x. The concentrations of the two bisulfite isomers and HCO3− as estimated by NMR in Sec. 3.1 are also shown after the normalization.
 | ||
| Fig. 7 Dependence of the relative intensity of Raman band on qSO2. The black broken line represents the relative concentration of HCO3− to that at qSO2 = 0, and blue and red ones represent the relative concentrations of HSO3− and the species having hydroxyl group determined by NMR measurement, respectively. | ||
As shown in the Fig. 7 the fraction of HCO3− as estimated by NMR and Raman agreed quite well. The sulfur-related Raman bands shown in Fig. 7 are divided into two groups based on their qSO2 dependences. The first group includes bands at 505, 1048, 1120, and 2440 cm−1, while the second group includes bands at 315, 725, 1029, and 1079 cm−1. We elucidated that each group of bands arises from one of the two bisulfite isomers. On the basis of NMR spectroscopic abundances, we assigned the first group to the HSO3− isomer and the second to the HOSO2− isomer. The assignments of the two bisulfite Raman bands at 1029 and 1048 cm−1 in aqueous solutions have been ambiguous for decades. In this work, we identified the band at 1048 cm−1 as the HSO3− vibration and the band at 1029 cm−1 as the HOSO2− vibration in the IL. The assignment is further confirmed by the fact that the intensity of the 1048 cm−1 band corresponded to the NMR measurement above qSO2 = 1 (slight decrease with increasing qSO2) (not shown in Fig. 7).
The comparison between the experimental difference spectra and the DFT calculations is shown in Fig. 8, and the assignments of bands by the DFT calculations are listed in Table S5.† Although the coincidence between theory and experiment is not so good, it gives us some hints for band assignments. By comparing the calculations, the band at 505 cm−1 observed experimentally is the bending mode of SO2 in HSO3−, the band at 1048 cm−1 is the symmetric stretching mode of SO2 in HSO3−, and the band at 1120 cm−1 is the bending mode of OSH. As for the HOSO2− vibrations, the band at 315 cm−1 is the bending mode of OS(OH), and the bands at 1029 and 1079 cm−1 are the combinations of the bending band of SOH with SO stretching vibration and SO2 symmetric stretching vibration, respectively.
 | ||
| Fig. 8 Vibrational spectra of different anions calculated by DFT using aug-cc-pVTZ basis set and B3PW91 functional. The upper panel shows difference Raman spectra of [P4448]HCO3 with different qSO2 from neat [P4448]HCO3. | ||
A few remarks must be made regarding band assignments. First, the intensity of the band at 1120 cm−1 assigned to the HSO3− vibration remarkably increased above qSO2 = 1, although the concentration of HSO3− decreased according to the NMR result. This may be due to the overlapping with sulfur species that forms above qSO2 = 1. Second, the νSH band at 2440 cm−1 in the IL shows a significant lower frequency shift relative to the corresponding band in the aqueous solution (2530 cm−1).34,36,38,39 The S–H bonding may be weakened in the IL due to the interaction with the surrounding cations. The SH frequency shows an increase with increasing qSO2 (Fig. S7(b)†). This suggests that not only is the interaction with the cation important for SH frequency, but so is the one with the anion. Third, our DFT calculations did not reproduce the band at 725 cm−1. As previously reported, a difficulty exists in the calculation for the S–O(H) mode43 and a theoretical model inadequacy may be the reason. As for another plausible reason for the lack of band reproduction, at first we considered that the complexation with cation may produce a shift of the band. As shown in the calculated spectra in Fig. S8,† the computational Raman spectra of HCO3− and HOSO2− with a cation showed a relatively large shift probably due to the nature of asymmetric complex formation. However, we could not identify a band at 725 cm−1 for these complexes. Zhang and Ewing proposed the existence of the HOSO2− dimer.37 Although we performed the calculation for this species in vapour, it was not stable. The calculation in water (SCRF model) converged and two stable isomers of the HOSO2− dimer were calculated. The optimized structures are shown in Fig. S9(a) (symmetric dimer) and (b) (asymmetric dimer).† The geometrical parameters are listed in Table S6.† Calculated Raman spectra are shown in Fig. S9(c).† The vibrational band around 700 cm−1 was calculated by making a dimer in either symmetric or asymmetric conformation. This band is due to the vibration of S(OH) symmetric stretching in both sides. The calculations suggest the possibility of HOSO2− dimer formation. The quadratic dependence of HSO3− and HOSO2− concentrations on qSO2 in Fig. 7 may be due to the HOSO2− dimer formation.
SO2 absorption mechanism
Based on the spectroscopic observations, the SO2 absorption by [P4448]HCO3 consists of two phases; see Scheme 1. In the first phase (below qSO2 = 1), the bicarbonate anion is quantitatively replaced by SO2 as in eqn (1) until the mole of absorbed SO2 reaches the initial mole of bicarbonate (qSO2 = 1). The absorbed SO2 is present either as HSO3− or HOSO2− (eqn (3)), which are in equilibrium. Condensation of bisulfite to form disulfite (eqn (2)) is negligible within the first phase. At qSO2 = 1, the ionic liquid turns into pure [P4448][bisulfite] by complete “gas exchange”. Above qSO2 = 1 (the second phase), SO2 is absorbed by another mechanism which will be discussed in the followings.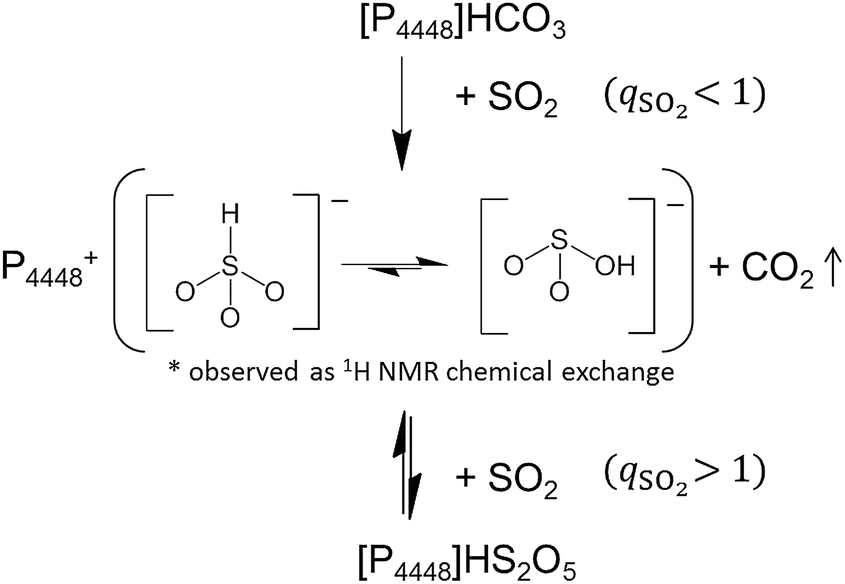 | ||
| Scheme 1 Proposed SO2 chemisorption mechanism by the bicarbonate ionic liquid [P4448]HCO3. | ||
The [P4448][bisulfite] liquid can further absorb SO2 and the qSO2 nearly reaches 1.6 at SO2 partial pressure less than 0.1 MPa. It is argued here what is the actual chemical form of the newly absorbed SO2. We postulate the following Lewis acid–base reaction.
| [P4448]HOSO2 or [P4448]HSO3 + SO2 ⇄ [P4448]HS2O5 | (4) |
We have no information on which of the two bisulfite isomers is more reactive. Molecular SO2 has Lewis basic character as well as Lewis acidic character.50 The adducts of SO2 with electron-rich species such as amines and halide ions are well known.50,51 As is mentioned in the Introduction, bromide in 1-butyl-3-methylimidazolium bromide ionic liquid can capture SO2 by a charge-transfer interaction.21 The charge-transfer interaction is evidenced by a yellowish or orange colour of the solution and the low frequency shift of the νs(SO2) Raman band. In our system, both a colour change (colourless at qSO2 < 1 and turned into bright yellow at qSO2 > 1) and a Raman band shift (from 1152 cm−1 in water38 to 1144 cm−1 in the IL) were observed.
In the qSO2 > 1 absorption phase, three intense Raman bands have emerged (∼430, 635, ∼1050 cm−1). These Raman bands nearly coincide with some of the strongest bands of S2O52−. On the other hand the Raman bands for HS2O5− has not been reported. Given the structural similarity, these two ionic species may not be distinguished only from Raman spectra.
The S2O52− can form via the condensation of two bisulfite ions as in eqn (2). We have shown that this reaction does not occur below qSO2 = 1. Then, it seems unreasonable to imagine the reaction abruptly switched on above qSO2 = 1. Thus we may assign the observed Raman bands to HS2O5−, which has been formed via eqn (4).
In order to test the above idea, we completed DFT calculations for HS2O5−. The calculations showed that both HOSO2− and HSO3− make stable complexes with SO2 to from HS2O5− with stabilization energies of 68 kJ mol−1 and 60 kJ mol−1, respectively, at the aug-cc-pVTZ and B3PW91 level calculations in vacuum (Table S1†). Fig. S10(a) and (b)† show the structure of the optimized cluster and Table S7† summarizes the geometrical parameters. The Mulliken charge of SO2 was −0.55 for the complex with HOSO2−, and −0.20 for the complex with HSO3−. This clearly indicates that that the complexation is due to the charge transfer process. The extent of the charge transfer was more significant for the former complex. The vibrational Raman spectra are compared for S2O52− and the complex between SO2 and bisulfite in Fig. S7(e).† The intense band at 400 cm−1 for S2O52− is the combination of the wagging motion of the SO2 side and the bending motions of SO2 in the SO3 side, the band at 612 cm−1 is the umbrella mode of SO3, the band at 1034 cm−1 is the symmetric vibration of S2O5, and the band at 1099 cm−1 is the asymmetric vibration of S2O5. For the complex of HOSO2− or HSO3− with SO2, similar vibrational modes were calculated as split bands near the frequencies for S2O52−. Based on these results, chemisorption of eqn (4) is consistent with experimental observations as the SO2 absorption mechanism for qSO2 > 1.
In summary the absorption scheme of SO2 by [P4448]HCO3 is illustrated in Scheme 1. Below qSO2 = 1, SO2 is absorbed by the IL in replacement with CO2 as HSO3− or HOSO2−, where they are in equilibrium. Above qSO2 = 1, SO2 is absorbed by the IL making the charge transfer complexes with HSO3− or HOSO2−.
Isomerization equilibrium and kinetics
The equilibrium quotient of the bisulfite isomers is reported to be dependent on temperature in water by 17O-NMR41 and XANES34 studies. The quotient changes by a factor of 2 with the temperature change of 40 K,41 with the HOSO2− isomer favoured more at lower temperatures. In Fig. 9, we determined the corresponding value in the IL using the 1H NMR spectra presented in Fig. S3.† As can be seen, the value changed only by 5% with the temperature change of 40 K. The striking difference between water and the IL solvent can be interpreted by the solvation of the HOSO2− isomer. Only in water is the HOSO2− isomer hydrogen-bonded to the solvent. Since the hydrogen bond is stronger at lower temperature, we expect the HOSO2− isomer to be more abundant in low temperature water but such a temperature effect is not expected in the IL. We have also confirmed that the Raman spectra were not dependent on temperature from 296 K to 253 K for the sample of qSO2 = 0.76.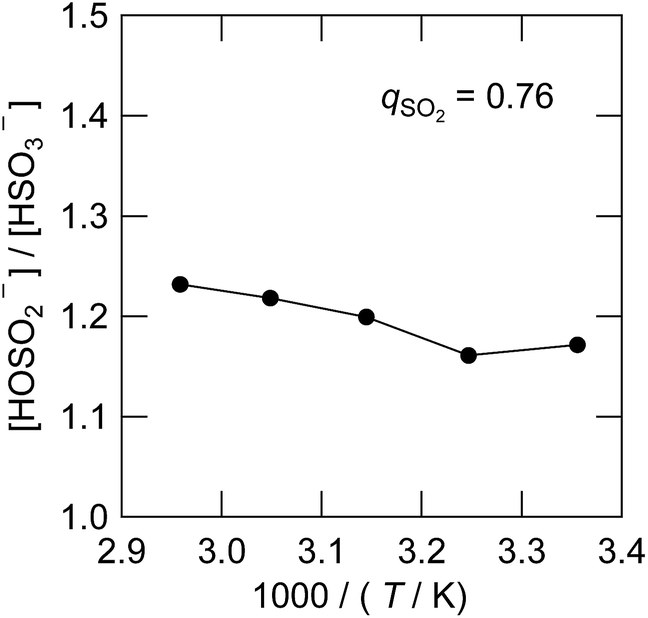 | ||
| Fig. 9 Temperature dependence of the isomeric equilibrium quotient between HSO3− and HOSO2− at qSO2 = 0.76. | ||
In order to detect any proton exchanges between the two bisulfite isomers, we plotted the width (full width at half height or FWHH) of the 1H NMR peaks for the HSO3− and hydroxyl protons against temperature in Fig. 10. The FWHH in the low temperature region could be fitted to an exponential function (red dashed lines). In this region, the FWHH is controlled by the solvent viscosity. It is remarkable that the FWHH's of HSO3− and hydroxyl protons deviate from the viscosity trend at higher temperatures. This is reasoned by a line broadening due to the chemical exchange, the rate of which exponentially increases with temperature (blue dashed line). The spin dynamics theory states that the FWHH in the Hz unit is proportional to the first order rate constant of the proton exchange reaction k. At 320 K, the value of k is estimated to be ∼10 s−1. The blue dashed lines demonstrate that the FWHH follows the Arrhenius-type temperature dependence. From the slope, we determined the activation energy of the bisulfite anion exchange to be 46 ± 4 kJ mol−1.
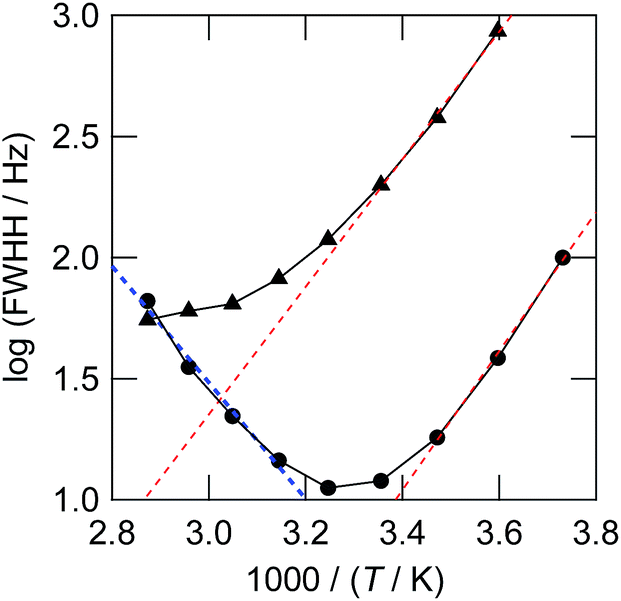 | ||
| Fig. 10 1H NMR full width at half height (FWHH) at 268–348 K. The FWHH for the HSO3− isomer and the coalesced hydroxyl protons (HOSO2− and HCO3−) are shown by circles and triangles, respectively. The red thin dashed lines show the natural width. The thick blue dashed line shows the line broadening of the HSO3− peak due to the isomer exchange of eqn (3). | ||
Conclusions
Herein, for the first time, we have reported NMR and Raman spectroscopic observations for bisulfite IL, which is prepared via “gas exchange” of bicarbonate ionic liquid. Both Raman and NMR spectra have indicated that the bisulfite anion is subject to isomerization. One of the isomers has an SH bond (HSO3−) that is characterized by a signal at 10 ppm by 1H NMR and the Raman bands at 506, 1048, 1120 and 2440 cm−1. The other isomer has an OH bond (HOSO2−) that is characterized by the Raman bands at 314, 725, 1029 and 1079 cm−1. The isomerization equilibrium in the IL is shifted to the HSO3− side compared to that in water. The bisulfite IL absorbs excess SO2 by making the charge transfer complex with bisulfite anions as elucidated by Raman bands at 430–500 (broad), 635, and 1140 cm−1.Acknowledgements
This work is partially supported by MEXT-Supported Program for the Strategic Research Foundation at Private Universities 2015–2019 (S1511025). We thank Prof. M. Ueno (Doshisha University) for useful discussions.Notes and references
- Z. Lei, C. Dai and B. Chen, Chem. Rev., 2014, 114, 1289 CrossRef PubMed.
- (a) R. Quinn, J. B. Appleby and G. P. Pez, J. Am. Chem. Soc., 1995, 117, 329 CrossRef CAS; (b) R. Quinn, Synth. React. Inorg. Met.-Org. Chem., 2001, 31, 359 CrossRef CAS.
- E. D. Bates, R. D. Mayton, I. Ntai and J. H. J. Davis, J. Am. Chem. Soc., 2002, 124, 926 CrossRef CAS PubMed.
- E. G. Maginn, Quarterly Technical Report to U. S. DOE, 01/05-03/05, DOE Scientific and Technical Information, Oak Ridge, TN, 2005, p. 1 Search PubMed.
- (a) A. Yokozeki, M. B. Shiflett, C. P. Junk, L. M. Grieco and T. Foo, J. Phys. Chem. B, 2008, 112, 16654 CrossRef CAS PubMed; (b) M. B. Shiflett and A. Yokozeki, J. Chem. Eng. Data, 2009, 54, 108 CrossRef CAS; (c) M. B. Shiflett, D. W. Drew, R. A. Cantini and A. Yokozeki, Energy Fuels, 2010, 24, 5781 CrossRef CAS.
- H. Yang, Z. Xu, M. Fan, R. Gupta, R. B. Slimane, A. E. Bland and I. Wright, J. Environ. Sci., 2008, 20, 14 CrossRef CAS.
- D. Camper, J. E. Bara, D. L. Gin and R. D. Noble, Ind. Eng. Chem. Res., 2008, 47, 8496 CrossRef CAS.
- G. Puxty, R. Rowland, A. Allport, Q. Yang, M. Bown, R. Burns, M. Maeder and M. Attalla, Environ. Sci. Technol., 2009, 43, 6427 CrossRef CAS PubMed.
- Y. Zhang, S. Zhang, X. Lu, Q. Zhou, W. Fan and X. Zhang, Chem.–Eur. J., 2009, 15, 3003 CrossRef CAS PubMed.
- B. E. Gurkan, J. Fuente, E. M. Mindrup, L. E. Ficke, B. F. Goodrich, E. A. Price, W. F. Schneider and J. F. Brennecke, J. Am. Chem. Soc., 2010, 132, 2116 CrossRef CAS PubMed.
- L. Sanchez, G. Meindersma and A. De Haan, Chem. Eng. J., 2010, 166, 11 Search PubMed.
- C. Wang, H. Luo, D. Jiang, H. Li and S. Dai, Angew. Chem., Int. Ed., 2010, 49, 5978 CrossRef CAS PubMed.
- G. Gurau, H. Rodriguez, S. P. Kelley, P. Janiczek, R. Kalb and R. D. Rogers, Angew. Chem., Int. Ed., 2011, 50, 12024 CrossRef CAS PubMed.
- (a) G. Wang, W. Hou, F. Xiao, J. Geng, Y. Wu and Z. Zhang, J. Chem. Eng. Data, 2011, 56, 1125 CrossRef CAS; (b) G. N. Wang, Y. Dai, X. B. Hu, F. Xiao, Y. T. Wu, Z. B. Zhang and Z. Zhou, J. Mol. Liq., 2012, 168, 17 CrossRef CAS.
- M. I. Cabaço, M. Besnard, Y. Danten and J. A. P. Coutinho, J. Phys. Chem. A, 2012, 116, 1605 CrossRef PubMed.
- (a) S. Stevanovic, A. Podgoršek, A. A. H. Padua and M. F. C. Gomes, J. Phys. Chem. B, 2012, 116, 14416 CrossRef CAS PubMed; (b) S. Stevanovic, A. Podgorsek, L. Moura, C. C. Santini, A. A. H. Padua and M. F. Costa Gomes, Int. J. Greenhouse Gas Control, 2013, 17, 78 CrossRef CAS.
- (a) S. Kasahara, E. Kamio, T. Ishigumi and H. Matsuyama, Chem. Commun., 2012, 48, 6903 RSC; (b) S. Kasahara, E. Kamio and H. Matsuyama, J. Membr. Sci., 2014, 454, 155 CrossRef CAS.
- (a) Y. Yasaka, M. Ueno and Y. Kimura, Chem. Lett., 2014, 43, 626 CrossRef CAS; (b) Y. Yasaka and Y. Kimura, J. Chem. Eng. Data, 2016, 61, 837 CrossRef CAS.
- W. Shi, R. I. Thompson, E. Albenze, J. A. Steckel, H. B. Nulwala and D. R. Luebke, J. Phys. Chem. B, 2014, 118, 7383 CrossRef CAS PubMed.
- J. L. Anderson, J. K. Dixon, E. J. Maginn and J. F. Brennecke, J. Phys. Chem. B, 2006, 110, 15059 CrossRef CAS PubMed.
- R. A. Ando, L. J. A. Siqueira, F. C. Bazito, R. M. Torresi and P. S. Santos, J. Phys. Chem. B, 2007, 111, 8717 CrossRef CAS PubMed.
- D. Yang, M. Hou, H. Ning, J. Ma, X. Kang, J. Zhang and B. Han, ChemSusChem, 2013, 6, 1191 CrossRef CAS PubMed.
- S. Zeng, H. He, H. Gao, X. Zhang, J. Wang, Y. Huang and S. Zhang, RSC Adv., 2015, 5, 2470 RSC.
- Y. Shang, H. Li, S. Zhang, H. Xu, Z. Wang, L. Zhang and J. Zhang, Chem. Eng. J., 2011, 175, 324 CAS.
- W. Wu, B. Han, H. Gao, Z. Liu, T. Jiang and J. Huang, J. Phys. Chem., 2004, 43, 2415 CAS.
- M. B. Shiflett and A. Yokozeki, Ind. Eng. Chem. Res., 2010, 49, 1370 CrossRef CAS.
- S. Ren, Y. Hou, W. Wn, Q. Liu, Y. Xiao and X. Chen, J. Phys. Chem. B, 2010, 114, 2175 CrossRef CAS PubMed.
- K. Huang, G.-N. Wang, Y. Dai, Y.-T. Wu, X.-B. Hu and Z.-B. Zhang, RSC Adv., 2013, 3, 16264 RSC.
- G. Cui, F. Zhang, X. Zhou, Y. Huang, X. Xuan and J. Wang, ACS Sustainable Chem. Eng., 2015, 3, 2264 CrossRef CAS.
- V. A. Simon and K. Waldemann, Z. Anorg. Allg. Chem., 1956, 284, 36 CrossRef.
- A. Simon and H. Kriegesmann, Chem. Ber., 1956, 89, 2442 CrossRef CAS.
- V. A. Simon and K. Waldemann, Z. Anorg. Allg. Chem., 1956, 283, 359 CrossRef.
- B. Meyer, L. Peter and C. Shaskey-Rosenlund, Spectrochim. Acta, Part A, 1979, 35, 345 CrossRef.
- E. D. Risberg, L. Eriksson, J. Mink, L. G. M. Pettersson, M. Y. Skripkin and M. Sandström, Inorg. Chem., 2007, 46, 8332 CrossRef CAS PubMed.
- A. W. Herlinger and T. V. Long II, Inorg. Chem., 1969, 8, 2661 CrossRef CAS.
- R. E. Connick, T. M. Tam and E. von Deuster, Inorg. Chem., 1982, 21, 103 CrossRef CAS.
- Z. Zhang and G. E. Ewing, Spectrochim. Acta, Part A, 2002, 58, 2105 CrossRef.
- B. Meyer, M. Ospina and L. B. Peter, Anal. Chim. Acta, 1980, 117, 301 CrossRef CAS.
- D. Littlejohn, S. A. Walton and S.-G. Chang, Appl. Spectrosc., 1992, 46, 848 CrossRef CAS.
- I. Lindqvist and M. Mörtsell, Acta Crystallographica, 1957, 10, 406 CrossRef CAS.
- D. A. Horner and R. E. Connick, Inorg. Chem., 1986, 25, 2414 CrossRef CAS.
- R. E. Brown and F. Barber, J. Phys. Chem., 1995, 99, 8071 CrossRef CAS.
- M. A. Vincent, I. J. Palmer and I. H. Hillier, J. Mol. Struct.: THEOCHEM, 1997, 394, 1 CrossRef CAS.
- J. A. Noblet and K. A. Schugart, J. Mol. Struct.: THEOCHEM, 1994, 341, 1 CrossRef.
- R. M. Golding, J. Chem. Soc., 1960, 3711 RSC.
- D. A. Horner and R. E. Connick, Inorg. Chem., 2003, 42, 1884 CrossRef CAS PubMed.
- Horner and Connick reported in ref. 14 that the 17O NMR signals for the two isomers are separated by 20 ppm. The spectral width of the peaks in the IL has turned out to be ∼100 ppm at 298 K.
- M. J. Frisch, et al., Gaussian 09, Revision D.01 Search PubMed.
- W. W. Rudolph, G. Irmer and E. Königsberger, Dalton Trans., 2008, 900–908 RSC.
- F. A. Cotton, G. Wilkinson, and P. L. Gaus, Basic Inorganic Chemistry, Wiley, New York, NY, 3rd edn, sec. 19–5, 1995 Search PubMed.
- W. Eisfeld and M. Regitz, J. Am. Chem. Soc., 1996, 118, 11918 CrossRef CAS.
Footnotes |
| † Electronic supplementary information (ESI) available: Tables of thermal energies, geometries of the optimized structures of monomers and clusters by DFT calculations, table of experimentally observed Raman shifts, tables of calculated Raman shift and assignments of anions, H NMR, 13C NMR, IR, and HR-MS spectra of [P4448]HCO3, 13C NMR of SO2 loaded [P4448]HCO3, figures of images for the optimized structures of monomers and clusters by DFT calculations, explanations of the multi-peak fitting, figures of calculated Raman activities of anions in SCRF water, and of dimers of HOSO2−, and of complexes of bisulfite with SO2, temperature dependence of the H NMR. See DOI: 10.1039/c6ra25528k |
| ‡ [P4448]HCO3: 1H NMR: δ 0.8 (br), 1.2–1.6(br), 2.6(br), (δ 0.8–2.6 44H), 11.3(br, 1.01 ± 0.03H). 1H NMR (H2O with 0.20% w/w STSP): δ 0.85–0.93 (m, 12H), 1.23–1.33 (m, 8H), 1.40–1.60 (m, 16H), 2.13 (m, 8H). 13C{1H} NMR (H2O): δ 12.88 (3C), 13.85 (1C), 17.95 (d, JCP = 190 Hz, 4C), 20.88 (d, JCP = 18 Hz, 1C), 22.41 (1C), 23.00 (d, JCP = 18 Hz, 3C), 23.51 (d, JCP = 60 Hz, 3C), 28.25 (1C), 18.47 (1C), 30.06 (d, JCP = 60 Hz, 1C), 31.47 (1C), 160.49 (1C). |
| § [P4448][bisulfite] (no solvent): δ 0.8(br), 1.2–1.6(br), 2.6(br) (δ 0.8–2.6 44H), 4.06(s, 0.47H), 9.85(s, 0.53H). |
| This journal is © The Royal Society of Chemistry 2017 |