
 Open Access Article
 This Open Access Article is licensed under a Creative Commons Attribution-Non Commercial 3.0 Unported Licence
Photoelectrochemical sensing of bisphenol a based on graphitic carbon nitride/bismuth oxyiodine composites†
Li Xu,
Pengcheng Yan,
Henan Li,
Siyan Ling,
Jiexiang Xia *,
Qian Xu,
Jingxia Qiu and
Huaming Li*
*,
Qian Xu,
Jingxia Qiu and
Huaming Li*
Institute for Energy Research, School of Chemistry and Chemical Engineering, Jiangsu University, Zhenjiang 212013, P. R. China. E-mail: xjx@ujs.edu.cn; lhm@ujs.edu.cn
First published on 23rd January 2017
Abstract
Graphitic carbon nitride/bismuth oxyiodine (g-CN/BiOI) composites with excellent photoelectrochemical (PEC) performance have been designed for a facile and sensitive PEC monitoring platform of bisphenol A (BPA) for the first time. The g-CN/BiOI composites were synthesized by a facile microwave method with 1-butyl-3-methylimidazolium iodine ([Bmim]I) as precursor. The heterojunction comprising g-CN and BiOI has been fabricated. The internal electric field formed at the interface of the heterojunction contributed to the separation of photogenerated electron–hole pairs. Consequently, the g-CN/BiOI composites achieved a greatly improved photocurrent density (∼2-fold) compared to the pure BiOI. In addition, the photocurrent of g-CN/BiOI composites can be further enhanced by introducing BPA into the aqueous solution. The increased photocurrent was applied as the PEC detection signal to trace the concentration of BPA sensitively and effectively. The self-constructed BPA PEC sensor displayed a satisfactory sensing performance with a rapid response, a wide linear range (80–3200 ng mL−1) and a low detection limitation (26 ng mL−1, S/N = 3). Moreover, the BPA PEC sensor exhibited an agreeable anti-interference capacity and outstanding stability, and provided a promising analytical method to detect BPA in the environment.
1 Introduction
Bisphenol A (BPA) is one of the most significant chemical precursors, which is widely applied in producing epoxy resins and polycarbonate.1 The environment is exposed to approximately 2000 tonnes of BPA and related products every year.2 Significantly, BPA can disrupt the endocrine system of the body. Low levels of BPA can cause a variety of health problems including cardiovascular disease, thyroid hormone disruption, cancer, and so on.3,4 To protect human health, it is of critical importance to develop a rapid, simple, cost-effective and reliable method for monitoring BPA concentration. Until now, various analytical methods have been employed for the determination of BPA with high performance techniques, such as gas chromatography-mass spectrometry,5 high-performance liquid chromatography,6 immuno-chromatographic lateral flow assay,7 and so on. Electrochemical techniques are also widely accepted to monitor BPA, because of the advantages of high sensitivity, simplicity, low cost, simple operation and miniaturization.8 However, the electrochemical oxidation of BPA usually causes the formation of a polymer film on the electrode surface, which results in the passivation of electrodes and hinders the improving sensitivity of electrode.9 Thus, it is a real challenge to develop an easy and sensitive analytical method for BPA determination. Photoelectrochemical (PEC) sensors appear to be appropriate candidates to solve this problem. PEC sensors exhibit the high sensitivity and the reduced background noise owing to the complete separation of the excitation source (light) and the detection signal (photocurrent).10 Remarkably, associating the traditional electrochemical method with optical method together, PEC sensors are equipped with advantages of both methods, such as simple instrumentation setup, portability, and low cost.11–14 For a PEC sensor, the main mechanism is to detect photocurrent variations of photoactive materials (usually semiconductors) modified electrode.15,16 The photocurrent variations are increasing by the addition of analytes via hole oxidation, and decreasing by the addition of analytes via electron reduction or photocurrent inhibition.14,17 Consequently, the first premise of excellent PEC sensor is to achieve improved photocurrent via efficiently separating photogenerated electron–hole pairs at the interface of semiconductor materials.15 Undeniably, the key to design a sensitivity PEC sensor is in the selection of a suitable semiconductor material.Bismuth oxyiodine (BiOI), a p-type bismuth semiconductor, has captured massive research attention due to its excellent layered structure, unique optical and electrical properties.18 The layered structure of BiOI can build the inherent internal static electric fields and accelerate the separation of photogenerated electron–hole pair, resulting in the excellent photoelectrochemical properties.19,20 BiOI has been applied in PEC detection of organophosphate pesticide due to small band gap (∼1.8 eV) and outstanding visible-light absorption capacity.21 AgI nanoparticles-BiOI nanoflakes heterojunctions have been also designed as the low-cost photoactive electrode for the determination of perfluorooctanoic acid, which can offer a high-performance photoactive sensing platform.22 Consequently, a desired approach enhancing PEC performances is coupling with semiconductors to form heterojunction. Graphitic carbon nitride (g-CN) with suitable electronic structure (∼2.7 eV) has drawn universal interest in photoelectrochemical field due to its inexpensive, stable, non-poisonous and vast sources.23 According to the energy band calculation, the energy levels of g-CN and BiOI are matched to overlap in band structure, which can enhance the separation and transfer of photogenerated electron–hole pairs.24 Mesoporous graphitic carbon nitride/BiOI heterojunction photocatalysts with outstanding photocatalytic performance have been synthesized for visible-light-driven photocatalytic degradation of BPA.25 Z-Scheme BiOI/g-C3N4 photocatalysts exhibit highly efficient photocatalytic activity for CO2 reduction to produce CO, H2 and/or CH4 under visible light irradiation.26 Previously, we have fabricated sphere-like g-C3N4/BiOI photocatalysts by a one-pot EG-assisted solvothermal process. The sphere-like g-C3N4/BiOI photocatalysts exhibit outstanding photocatalytic activity for degradation of dyes (rhodamine B, methylene blue, methyl orange) and colourless endocrine disrupting chemical (BPA and 4-chlorophenol).27
Herein, g-CN/BiOI composites were prepared via a facile microwave method in the presence of [Bmim]I. The heterojunction comprising g-CN and BiOI can be fabricated, which contributed to the enhancement of PEC performance of g-CN/BiOI composites. The PEC properties were tested by means of the photocurrent of g-CN/BiOI composites modified electrodes. The g-CN/BiOI composites achieved great improved photocurrent density compared to the pure BiOI. Consequently, a facile and sensitive PEC monitoring platform of BPA can be fabricated by g-CN/BiOI composites at first time. The photocurrent of g-CN/BiOI composites is increasing with introducing BPA in the aqueous solution. The increased photocurrent was applied as the PEC detection signal to sensitive tracing BPA. Moreover, the BPA PEC sensor exhibited a pleasurable anti-interference capacity and outstanding stability, and provided the promising analytical method to detect BPA in environment.
2 Materials and methods
2.1 Materials
Bi(NO3)3·5H2O was purchased from Sinopharm Chemical Reagent Co., Ltd. (China). 1-Butyl-3-methylimidazolium iodine ([Bmim]I, 99%) was purchased from Shanghai Chengjie Chemical Co. Ltd. All chemicals required for experiments were of analytical purity and used without further processing. According to our previous report,28 the g-CN powder was synthesized by a simple one-step solvent thermal method.2.2 Synthesis of g-CN/BiOI composites
The typical preparation of g-CN/BiOI composites is shown in the following approach: firstly, [Bmim]I (1 mmol) and Bi(NO3)3·5H2O (1 mmol) were dissolved in ethylene glycol solution (20 mL) with stirring. Secondly, the g-CN (26.5 mg) was added to the above solution. The mixture was ultrasonically dispersed for 30 min, and then was continuously stirred for 30 min. Finally, the mixture was microwave-heated at 160 °C for 15 min and naturally cooling down to the room temperature. The microwave-heated method was operated at Microwave oven (SINEO MAS-I) with magnetic stirrer and water-cooled condenser. The obtained product was centrifuged by high-speed centrifuge, and washed by distilled water and absolute ethanol for several times to remove the impurity substance. The product was dried at 50 °C for 24 h for further characterization.2.3 Characterization
The powder X-ray diffraction (XRD) patterns of the samples were recorded on a Bruker D8 Advance diffractometer with high-intensity Cu Ka radiation (λ = 1.54 Å) in the 2θ range of 20–80°. The structural information for samples was examined by Fourier transform spectrophotometer (FT-IR, Nexus 470, Thermo Electron Corporation) using the standard KBr disk method. Chemical compositions and states were analyzed by X-ray photoelectron spectroscopy (XPS) (Thermo VG Scientific ESCALAB 250 spectrometer) using Mg-Kα radiator operated at 20 kV. The morphology of the sample was carried out by field emission scanning electron microscopy (SEM, JEOL JSM-7001F) and the transmission electron microscopy (TEM, JEOL JEM-2010). Ultraviolet-visible diffused reflectance spectra (DRS) of the samples were obtained using an ultraviolet-visible spectrophotometer (UV-2550, Shimadzu) with BaSO4 as the reflectance standard. The photoluminescence spectroscopy (PL) spectra of the obtained materials were detected by a Varian Cary Eclipse spectrometer.2.4 Photoelectrochemical measurements
All the PEC measurements were conducted using CHI660B electrochemical workstation in phosphate buffer solution (0.1 M, pH 7.0) at the applied potential of 0 V. A 150 W Xe arc lamp (150 W) was used as light source. It is a conventional three-electrode cell, which is equipped with indium tin oxide (ITO) glass as a working electrode, Ag/AgCl electrode as a reference electrode and a platinum wire as a counter electrode. For the preparation of working electrode, the g-CN/BiOI composites (1 mg) were ultrasonically dispersed in H2O (1 mL). The g-CN/BiOI composites suspension (1 mg mL−1, 70 μL) was dropped onto the surface of the ITO electrode with a fixed area of 0.5 cm2, and dried naturally in ambient air to obtain g-CN/BiOI modified ITO electrode. For comparison, BiOI modified ITO electrode was obtained using a same method. Electrochemical impedance spectroscopy (EIS) was performed in KCl solution (0.1 M) containing Fe(CN)63−/Fe(CN)64− (5 mM) with a frequency range from 0.01 Hz to 10 kHz at 0.24 V.3 Results and discussion
X-ray diffraction (XRD) is mainly used to analyze the chemical composition and crystalline phase-structure of the as-prepared samples. Fig. 1 is the XRD spectra of g-CN/BiOI composites and pure BiOI. As shown in Fig. 1, the diffraction peaks of all samples are found in the orthorhombic phase BiOI (JCPDS card no. 10-0445). No other impurities peaks are observed, suggesting high purity of the composites. However, the distinctive peak of g-CN at approximately 27.4° is not found in the XRD spectra of g-CN/BiOI composites, which may result from the low g-CN content in the composite system and excellent dispersion of the g-CN.27 Moreover, the positions of the diffraction peaks of BiOI are without any deviation in g-CN/BiOI composites, indicating that the induction of g-CN does not change the crystal lattice of BiOI.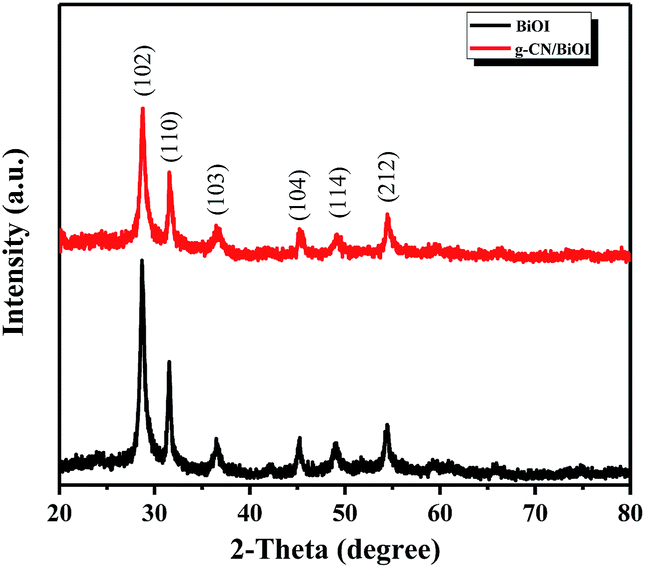 | ||
| Fig. 1 XRD patterns of the g-CN/BiOI composites and pure BiOI. | ||
In order to verify the existence of g-CN, the samples have been characterized by FT-IR spectroscopy. The FT-IR spectra of g-CN/BiOI composites, pure BiOI and g-CN are shown in Fig. 2. The g-CN/BiOI composites exhibit characteristic absorption peaks of g-CN and BiOI. The peaks at 1328 and 1412 cm−1 are observed at pure g-CN sample and g-CN/BiOI composites, corresponding to the stretching vibration of C–N and C![[double bond, length as m-dash]](https://www.rsc.org/images/entities/char_e001.gif) N bonds.29 The characteristic peak at 807 cm−1 is attributed to s-triazine ring modes.27 The characteristic broad absorption peak at 514 cm−1 corresponds to Bi–O bond of BiOI and g-CN/BiOI composites.30 In addition, no characteristic absorption peaks of [Bmim]I are found, indicating that [Bmim]I can be removed from the surface of the g-CN/BiOI composites.
N bonds.29 The characteristic peak at 807 cm−1 is attributed to s-triazine ring modes.27 The characteristic broad absorption peak at 514 cm−1 corresponds to Bi–O bond of BiOI and g-CN/BiOI composites.30 In addition, no characteristic absorption peaks of [Bmim]I are found, indicating that [Bmim]I can be removed from the surface of the g-CN/BiOI composites.
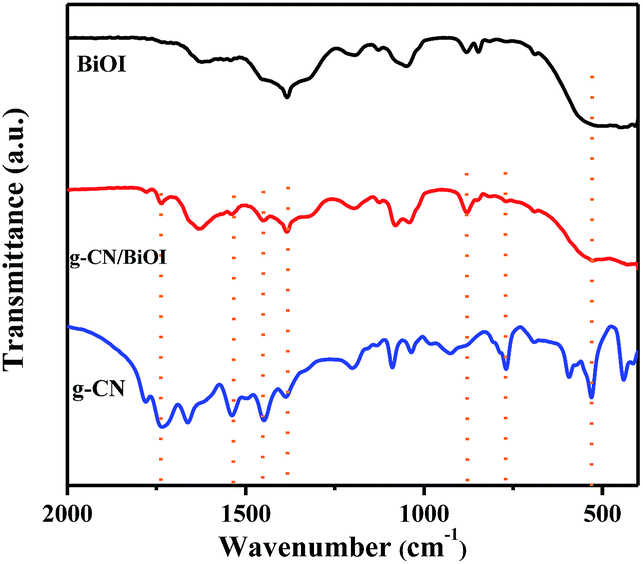 | ||
| Fig. 2 FT-IR patterns of the g-CN/BiOI composites, pure BiOI and g-CN. | ||
To further illustrate the surface element composition and chemical valence state of the g-CN/BiOI composites, XPS spectra analysis is performed. As shown in the survey XPS spectrum of the g-CN/BiOI composites (Fig. 3a), the surface of the sample is composed of five main elements (Bi, O, I, C and N). Fig. 3b is a high resolution energy spectrum of Bi 4f. Two strong diffraction peaks at 159.1 and 164.4 eV belong to Bi 4f7/2 and Bi 4f5/2, respectively. The peak at 529.4 eV is fitted well with O 1s (Fig. 3c), coming from Bi–O bond in the BiOI. As shown in the Fig. 3d, the peaks located at binding energies of 618.5 and 629.8 eV are assigned to I 3d3/2 and I 3d5/2, respectively. The two C 1s peaks located at 284.7 and 287.2 eV are ascribed to carbon (C–C/CC) and defect-containing sp2-bonded carbon (CN)28,29 (Fig. 3e), respectively. It can be seen from Fig. 3f that the N 1s peak is centered at 399.3 eV, resulting from sp2-hybridized nitrogen (CN–C).29 The result of XPS further confirms the composition of the g-CN/BiOI composites, which is consistent with the results of FT-IR analysis. The element distribution maps of g-CN/BiOI composite have been shown in Fig. S1.† It can be seen that the main elements of composite are Bi, O, I, C and N. It is also obtained from maps that C and N elements are homogeneously distributed on the surface of composites, indicating the existence and good dispersion of g-CN. Various analyses demonstrate that the g-CN/BiOCl composites have been prepared successfully by microwave method.
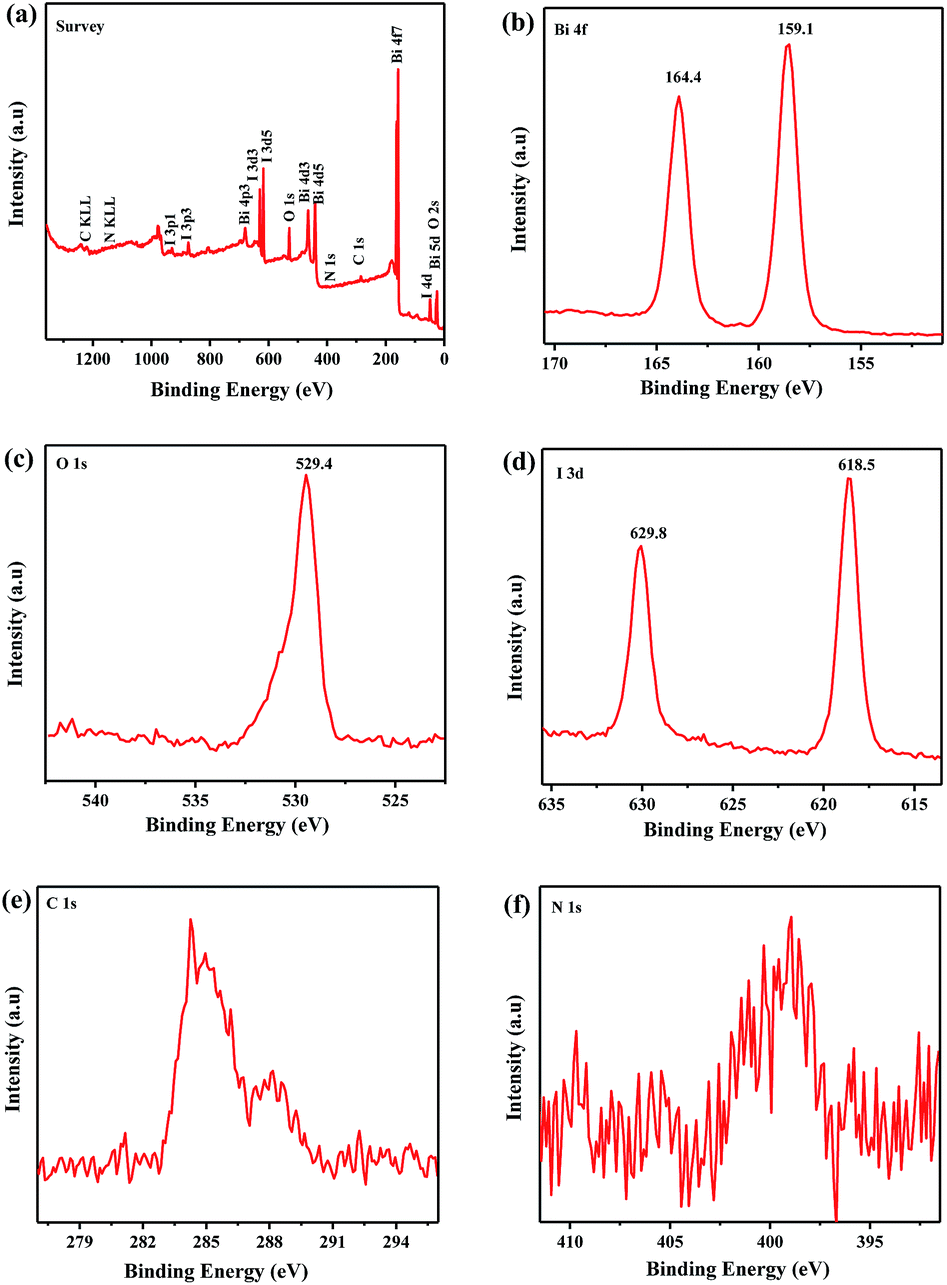 | ||
| Fig. 3 XPS spectra of the g-CN/BiOI composites. (a) Survey of the sample; (b) Bi 4f; (c) O 1s; (d) I 3d; (e) C 1s and (f) N 1s. | ||
In order to study the morphology of the samples, SEM and TEM images have been carried out. From SEM image of g-CN (Fig. 4a), g-CN is made up of nanorod structure with smooth surface. Interestingly, the pure BiOI is hexagonal nanoplate (Fig. 4b), which is different from the sphere-like structure of BiOI synthesized by hydrothermal method.27 As shown in Fig. 4c, the g-CN/BiOI composites have hexagonal nanoplates, which is similar to pure BiOI. In high-magnification SEM image (Fig. 4d), lots of g-CN nanorods are dispersed on the surface of BiOI nanoplates, revealing that g-CN nanorods have successfully coupled with BiOI nanoplate. In addition, the structures of the g-CN/BiOI composites are further investigated by TEM (Fig. 4e). It can be seen that g-CN nanorods are attached on the surface of BiOI nanoplates. As shown in Fig. 4f, the high-resolution TEM image of the g-CN/BiOI composites clearly reveals the interface between BiOI and g-CN. The lattice fringe spacing of 0.282 nm corresponds to the (110) plane for the BiOI crystallites. The result of high-resolution TEM strongly demonstrates that the heterojunction structures can be successfully formed between g-CN nanorods and BiOI nanoplates, which benefits for enhancing PEC properties of the g-CN/BiOI composites.
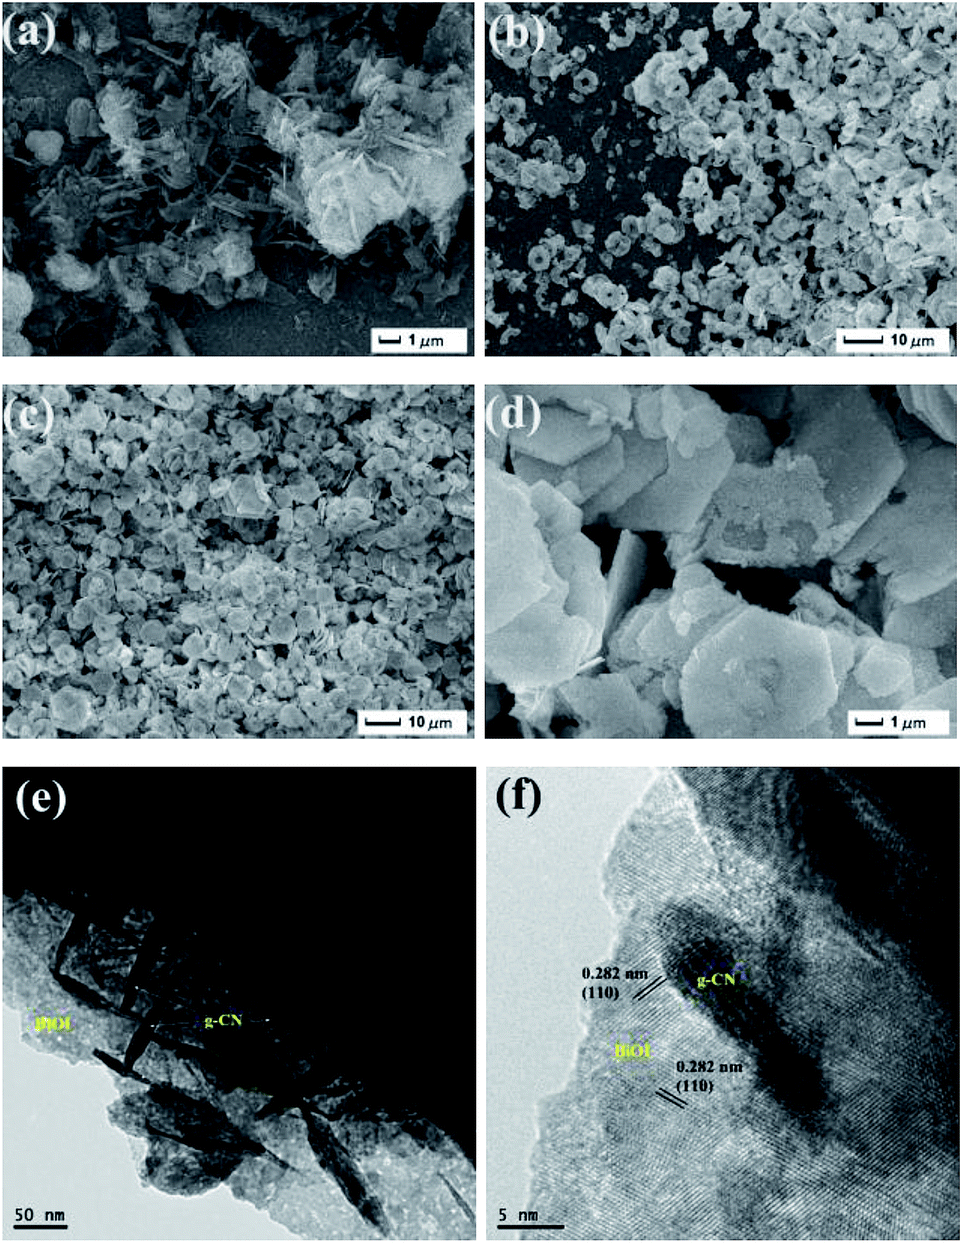 | ||
| Fig. 4 SEM and TEM images of the as-prepared samples: (a) SEM image of the g-CN; (b) SEM image of the BiOI; SEM images (c and d) and TEM images (e and f) of the g-CN/BiOI composites. | ||
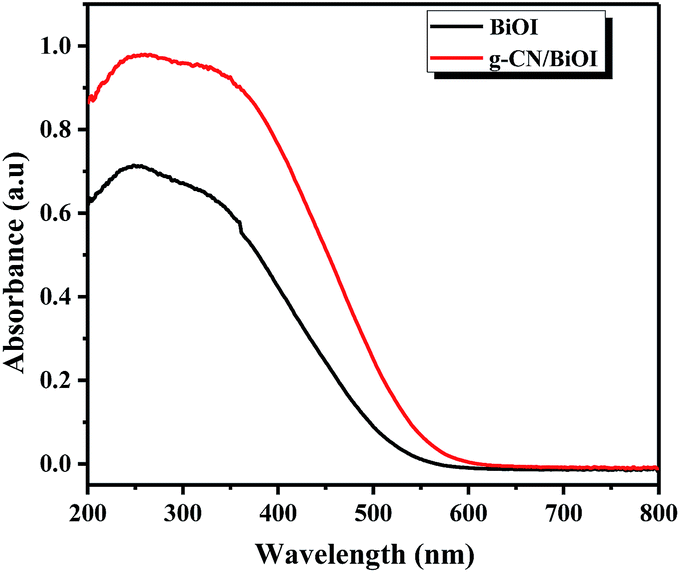
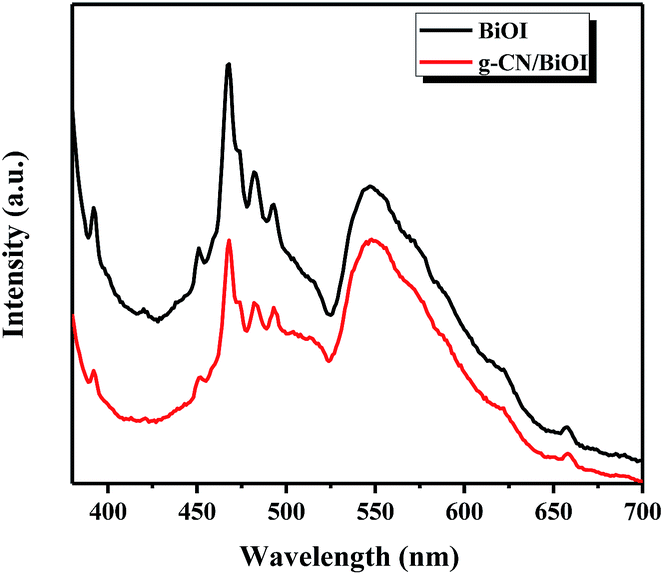
Fig. 5 shows the UV-vis diffuse reflectance spectroscopy of g-CN/BiOI composites and BiOI. It can be seen that the pure BiOI has a strong absorbance in the visible light region, with absorption edge about 600 nm. With the introduction of g-CN, the light absorption of g-CN/BiOI composites increases and appears red-shift phenomenon in the visible light region. The enhanced light absorption means that more light can be utilized to activate g-CN/BiOI to form more photogenerated electron–hole pairs, leading to excellent photoelectrochemical performance. In order to further analyze the separation efficiency between the photogenerated electrons and hole of the composites, the photoluminescence spectrum analysis has been carried out. After excited by the light, semiconductor materials produce photogenerated electrons and holes. When the electron and hole recombine together, the intensity of photoluminescence will increase. In other words, the high separation efficiency of photogenerated carrier leads to low fluorescence emission intensity. Fig. 6 is the photoluminescence spectra of g-CN/BiOI composites and the pure BiOI with an excitation wavelength of 360 nm. It can be seen that the pure BiOI has strong emission peak. The photoluminescence spectrum of g-CN/BiOI composites is similar to the pure BiOI, but the emission intensity is far weaker than the pure BiOI. This clearly shows that the composition of g-CN and BiOI greatly inhibited the recombination of the photogenerated electron and hole, leading to a high separation rate of photogenerated carrier of g-CN/BiOI composites. This is beneficial for improving the photoelectrochemical properties of g-CN/BiOI composites.
 | ||
| Fig. 5 UV-vis diffuse reflectance spectra of the g-CN/BiOI composites and pure BiOI. | ||
 | ||
| Fig. 6 Steady-state PL spectra of the g-CN/BiOI composites and pure BiOI. | ||
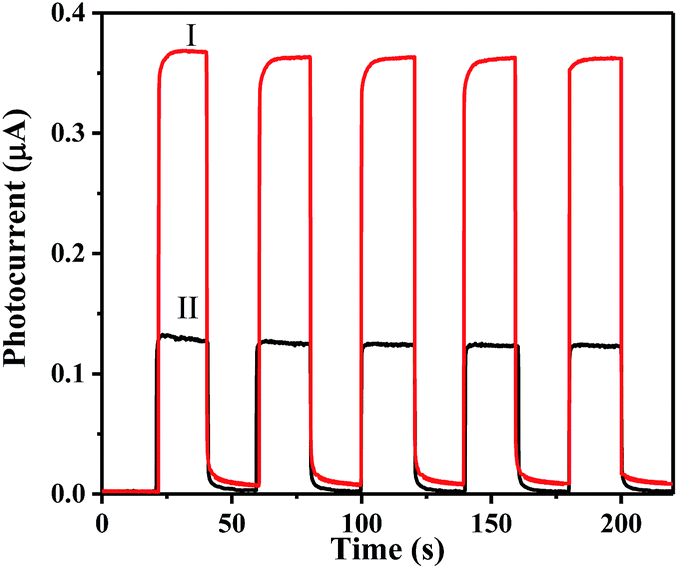
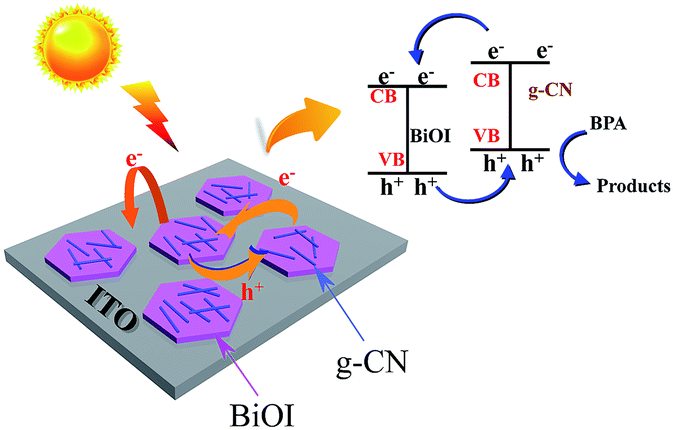
In order to investigate the PEC performance of g-CN/BiOI composites and pure BiOI, photocurrent measurements have been carried out, and the results are shown in Fig. 7. In dark conditions, all the samples have almost no photocurrent response. Upon the light source is turned on, the intensity of photoelectric response is rapidly enhanced. The photocurrent intensity of the pure BiOI modified ITO electrode is 0.13 μA at applied potential of 0 V (Fig. 7 curve II). The g-CN/BiOI modified ITO electrode exhibits a ∼2-fold increase in the photocurrent compared to the pure BiOI modified ITO electrode (Fig. 7 curve I), indicating the enhancement of the photocurrent of BiOI by the combination of g-CN because of the heterojunction structures between g-CN and BiOI. Simultaneously, an optimized special content of g-CN is crucial to obtain outstanding photocurrent response. As shown in the Fig. S2,† 7 wt% of g-CN is optimum to achieve the maximum photocurrent response. BPA (720 ng mL−1) is further injected to the solution in order to improve the photocurrent response (Fig. S3†). Interestingly, the increment of photocurrent intensity at the g-CN/BiOI modified ITO electrode is ∼3-fold more than that of photocurrent intensity at the BiOI modified ITO electrode. Compared with the BiOI modified ITO electrode, the g-CN/BiOI modified ITO electrode is more suitable for constructing PEC monitoring platform of BPA owing to the high photocurrent responses. The proposed mechanism for the PEC behaviors of the g-CN/BiOI modified ITO has been summarized in Scheme 1. Upon the light falls on the surface of the g-CN/BiOI composites, both BiOI and g-CN can be excited and generate electron–hole pairs. The photogenerated electrons can be transferred from conduction band (CB) of g-CN to CB of BiOI because the CB edge potential of g-CN is more negative than that of BiOI.27 Meanwhile, the holes can be transferred from valence band (VB) of BiOI to VB of g-CN owing to the more positive VB edge potential of BiOI compared to g-CN. The charge transfer can hinder recombination of the photogenerated electron–hole pair, which profit to enhance PEC properties of the g-CN/BiOI composites. Upon BPA addition, the holes can be sacrificed by BPA, which can further enhance charge separation efficiency and lead to improvement of photocurrent. The increment of photocurrent can be applied as the detection signal for BPA.
 | ||
| Fig. 7 Photocurrent response of the g-CN/BiOI composites (I) and pure BiOI (II). | ||
 | ||
| Scheme 1 Schematic illustration of the mechanism for the PEC sensor based on the g-CN/BiOI modified ITO for BPA detection. | ||
The effect of pH in a range between 2 and 12 was studied to select the optimum conditions for PEC performance of the g-CN/BiOI modified ITO. As shown in Fig. S4,† the g-CN/BiOI modified ITO exhibits the optimal PEC performance on pH 7.0. The phosphate buffer solution (0.1 M, pH 7.0) is recommended in this work.
The PEC sensing platform of BPA can be fabricated with the g-CN/BiOI modified ITO. As shown in Fig. 8a, it can be seen that the photocurrent increment is proportional to the concentrations of BPA (80, 160, 240, 320, 400, 560, 720, 880, 1100, 1200, 1600, 2000, 2400, 2800 and 3200 ng mL−1). By further study of the relationship between the intensity of the photocurrent and the concentration of BPA (Fig. 8b), the excellent linear relationship are acquired between the change of photocurrent density (Δi = i − i0) and the concentration of BPA, where i0 and i are the photocurrent before and after injection of BPA. The calibration curve can be constructed by plotting two linearization equations which are (1) Δi = 7.959 × 10⁻⁴ + 1.641 × 10⁻⁴ c/ng mL−1 (R2 = 0.994, c: 80–1100 ng mL−1); (2) Δi = 0.153 + 2.315 × 10⁻⁵ c/ng mL−1 (R2 = 0.992, c: 1100–3200 ng mL−1), respectively. The limit of detection (S/N = 3) for BPA is calculated to be 26 ng mL−1, which is lower than that of previous detection methods (Table S1†).31–35
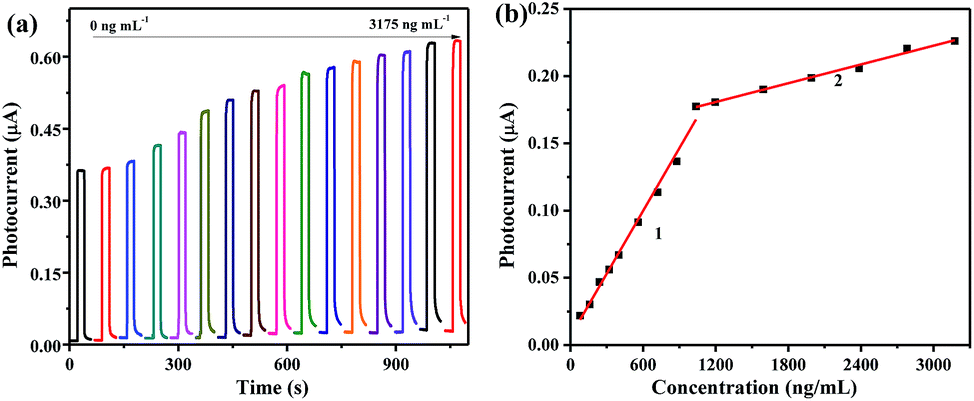 | ||
| Fig. 8 (a) Photocurrent response of the g-CN/BiOI modified ITO upon addition of serial concentrations of BPA in phosphate buffer solution (0.1 M, pH 7.0) at the voltage of 0 V with light excitation; (b) the corresponding linear calibration curve for BPA determination. | ||
To investigate the selectivity of BPA PEC sensor, the interference study has been measured by inspecting the photocurrent responses of the sensor to the typical interfering substances including Mg2+, Ca2+, Na+, Zn2+, Fe3+, phenol, 4-hydroxybenzoic acid (HBA), 4-aminobenzoic acid (ABA), 4-chlorophenol (4-CP), rhodamine B (RhB), methyl orange (MO), methylene blue (MB), benzyl alcohol (BP), bromophenol blue (BPB) and 4,4′-(hexafluoroisopropylidene) diphenol (6F-BPA). The concentration of the interfering substances is 100-fold to BPA. As shown in Fig. S5,† the photocurrent responses of the interfering substances are not much difference compared with BPA. The result indicates that the BPA PEC sensor has excellent anti-interference ability for BPA monitor.
The proposed PEC sensor was applied to detection of BPA in real water samples from Yangtze River (Table S2†). The recoveries range from 96.2% to 106.1% for the BPA in real water samples, indicating acceptable accuracy for the requirement of real samples testing.
Storage stability of the proposed PEC sensor was also investigated by storing the same patch of g-CN/BiOI modified ITO under darkness for different periods before the PEC detection of 1200 ng mL−1 BPA. It is obviously observed that 93.2% of the initial signal for the PEC sensor was retained after storage for two weeks, indicating that good stability and potential for practical application (Fig. S6†) can be approved from the prepared PEC sensors.
4 Conclusion
In summary, we investigated a PEC monitoring platform for sensitive BPA determination utilizing g-CN/BiOI composites as signal-transduction materials. The g-CN/BiOI composites were synthesized by a facile microwave method with [Bmim]I as precursor. SEM and TEM analysis indicated g-CN nanorods dispersed the surface of BiOI nanoplates and formed heterojunctions. The internal electric field formed at the interface of heterojunction contributed to separation of photogenerated electron–hole pairs effectively, resulting to the enhancement of the PEC response of the g-CN/BiOI composites. The photocurrent response of the g-CN/BiOI composites is ∼2-fold to those of BiOI. In addition, the photocurrent of g-CN/BiOI composites can be further enhanced via introducing BPA in the aqueous solution. The photocurrent increment was applied as the PEC detection signal to sensitive tracing BPA, and was proportional to the BPA concentrations over the range of 80 to 3200 ng mL−1. The detection limit of the BPA PEC sensor was as low as 26 ng mL−1. Moreover, the BPA PEC sensor exhibited a pleasurable anti-interference capacity. All results demonstrated that the BPA PEC sensor exhibited satisfactory sensing performance with wide detection linear range, acceptable detection limit, and excellent selectivity.Acknowledgements
This work was financially supported by the National Natural Science Foundation of China (No. 21576123, 21506081, and 21506077), Jiangsu University Scientific Research Funding (15JDG048), University Natural Science Research of Jiangsu (15KJB530004), the Jiangsu Province Postdoctoral Science Foundation (1501026B), Chinese Postdoctoral Foundation (2016M590420), and a Project Funded by the Priority Academic Program Development of Jiangsu Higher Education Institutions.References
- B. Kaur, B. Satpati and R. Srivastava, RSC Adv., 2016, 6, 65736–65746 RSC
.
- P. Q. Fu and K. Kawamura, Environ. Pollut., 2010, 158, 3138–3143 CrossRef CAS PubMed
- K. S. Kim, J. Jang, W. S. Choe and P. J. Yoo, Biosens. Bioelectron., 2015, 71, 214–221 CrossRef CAS PubMed
- L. S. Hu, C. C. Fong, X. M. Zhang, L. L. Chan, P. K. S. Lam, P. K. Chu, K. Y. Wong and M. S. Yang, Environ. Sci. Technol., 2016, 50, 4430–4438 CrossRef CAS PubMed
- J. Zhang, J. M. Cooke, I. H. Curran, C. G. Goodyer and X. L. Cao, J. Chromatogr. B: Anal. Technol. Biomed. Life Sci., 2011, 879, 209–214 CrossRef CAS PubMed
- C. Y. Lin, M. R. Fuh and S. D. Huang, J. Sep. Sci., 2011, 34, 428–435 CrossRef CAS PubMed
- Z. L. Mei, Y. Deng, H. Q. Chu, F. Xue, Y. H. Zhong, J. J. Wu, H. Yang, Z. C. Wang, L. Zheng and W. Chen, Microchim. Acta, 2013, 180, 279–285 CrossRef CAS
- J. Yang, S. E. Kim, C. Misuk, I. K. Yoo, W. S. Choe and Y. Lee, Biosens. Bioelectron., 2014, 61, 38–44 CrossRef CAS PubMed
- B. J. Lu, M. C. Liu, H. J. Shi, X. F. Huang and G. H. Zhao, Electroanalysis, 2013, 25, 771–779 CrossRef CAS
- Z. Yue, F. Lisdat, W. J. Parak, S. G. Hickey, L. P. Tu, N. Sabir, D. Dorfs and N. C. Bigall, ACS Appl. Mater. Interfaces, 2013, 5, 2800–2814 CAS
- H. J. Shi, J. Z. Zhao, Y. L. Wang and G. H. Zhao, Biosens. Bioelectron., 2016, 81, 503–509 CrossRef CAS PubMed
- X. Y. Li, R. J. Cheng, H. J. Shi, B. Tang, H. S. Xiao and G. H. Zhao, J. Hazard. Mater., 2016, 304, 474–480 CrossRef CAS PubMed
- W. W. Zhao, S. Shan, Z. Y. Ma, L. N. Wan, J. J. Xu and H. Y. Chen, Anal. Chem., 2013, 85, 11686–11690 CrossRef CAS PubMed
- Y. Zhang, H. M. Ma, D. Wu, R. X. Li, X. P. Wang, Y. G. Wang, W. J. Zhu, Q. Wei and B. Du, Biosens. Bioelectron., 2016, 77, 936–941 CrossRef CAS PubMed
- Y. Zhang, A. Shoaib, J. J. Li, M. W. Ji, J. J. Liu, M. Xu, B. Tong, J. T. Zhang and Q. Wei, Bioelectronics, 2016, 79, 866–873 CrossRef CAS PubMed
- L. F. Fan, G. H. Zhao, H. J. Shi, M. C. Liu, Y. B. Wang and H. Y. Ke, Environ. Sci. Technol., 2014, 48, 5754–5761 CrossRef CAS PubMed
- Y. Q. Wang, W. Wang, S. S. Wang, W. J. Chu, T. Wei, H. J. Tao, C. X. Zhang and Y. M. Sun, Sens. Actuators, B, 2016, 232, 448–453 CrossRef CAS
- Y. X. Guo, H. W. Huang, Y. He, N. Tian, T. R. Zhang, P. K. Chu, Q. An and Y. H. Zhang, Nanoscale, 2015, 7, 11702–11711 RSC
- J. Jiang, K. Zhao, X. Y. Xiao and L. Z. Zhang, J. Am. Chem. Soc., 2012, 134, 4473–4476 CrossRef CAS PubMed
- D. Jiang, X. J. Du, D. Y. Chen, Y. Q. Li, N. Hao, J. Qian, H. Zhong, T. Y. You and K. Wang, Carbon, 2016, 102, 10–17 CrossRef CAS
- J. M. Gong, X. Q. Wang, X. Li and K. W. Wang, Biosens. Bioelectron., 2012, 38, 43–49 CrossRef CAS PubMed
- J. M. Gong, T. Fang, D. H. Peng, A. M. Li and L. Z. Zhang, Biosens. Bioelectron., 2015, 73(15), 256–263 CrossRef CAS PubMed
- J. Cui, Z. X. Ding, X. Z. Fu and X. C. Wang, Angew. Chem., Int. Ed., 2012, 51, 11814–11818 CrossRef PubMed
- L. W. Lei, H. H. Jin, Q. Zhang, J. Xu, D. Gao and Z. Y. Fu, Dalton Trans., 2015, 44, 795–803 RSC
- C. Chang, L. Y. Zhu, S. F. Wang, X. L. Chu and L. F. Yue, ACS Appl. Mater. Interfaces, 2014, 6, 5083–5093 CAS
- J. C. Wang, H. C. Yao, Z. Y. Fan, L. Zhang, J. S. Wang, S. Q. Zang and Z. J. Li, ACS Appl. Mater. Interfaces, 2016, 8, 3765–3775 CAS
- J. Di, J. X. Xia, S. Yin, H. Xu, L. Xu, Y. G. Xu, M. Q. He and H. M. Li, J. Mater. Chem. A, 2014, 2, 5340–5351 CAS
- T. T. Zhu, Y. H. Song, H. Y. Ji, Y. G. Xu, Y. X. Song, J. X. Xia, S. Yin, Y. P. Li, H. Xu, Q. Zhang and H. M. Li, Chem. Eng. J., 2015, 271, 96–105 CrossRef CAS
- L. Xu, H. Li, P. C. Yan, J. X. Xia, J. X. Qiu, Q. Xu, S. Q. Zhang, H. M. Li and S. Q. Yuan, J. Colloid Interface Sci., 2016, 483, 241–248 CrossRef CAS PubMed
- X. M. Tu, S. L. Luo, G. X. Chen and J. H. Li, Chem.–Eur. J., 2012, 18, 14359–14366 CrossRef CAS PubMed
- M. Portaccio, D. D. Tuoro, F. Arduini, M. Lepore, D. G. Mita, N. Diano, L. Mita and D. Moscone, Biosens. Bioelectron., 2010, 25, 2003–2008 CrossRef CAS PubMed
- L. L. Zhu, Y. H. Cao and G. Q. Cao, Biosens. Bioelectron., 2014, 54, 258–261 CrossRef CAS PubMed
- P. Y. Sun and Y. H. Wu, Sens. Actuators, B, 2013, 178, 113–118 CrossRef CAS
- L. Wu, D. Deng, J. Jin, X. Lu and J. Chen, Biosens. Bioelectron., 2012, 35, 193–199 CrossRef CAS PubMed
- Q. Li, H. Li, G. F. Du and Z. H. Xu, J. Hazard. Mater., 2010, 180, 703–709 CrossRef CAS PubMed
Footnote |
| † Electronic supplementary information (ESI) available: Element mapping of g-CN/BiOI composites, photocurrent response of the g-CN/BiOI modified ITO electrodes with different content of g-CN, photocurrent responses of the g-CN/BiOI modified ITO and BiOI modified ITO for BPA, influence of the interfering substances on the responses of the PEC sensor for BPA, comparison results of the determination of BPA by other monitoring methods. See DOI: 10.1039/c6ra25525f |
| This journal is © The Royal Society of Chemistry 2017 |