
 Open Access Article
 This Open Access Article is licensed under a
 Creative Commons Attribution 3.0 Unported Licence
Direct determination of graphene amount in electrochemical deposited Cu-based composite foil and its enhanced mechanical property
Gongsheng Song a,
Zhongchi Wanga,
Youning Gonga,
Yanpeng Yanga,
Qiang Fuab and
Chunxu Pan*ab
a,
Zhongchi Wanga,
Youning Gonga,
Yanpeng Yanga,
Qiang Fuab and
Chunxu Pan*ab
aSchool of Physics and Technology, MOE Key Laboratory of Artificial Micro- and Nano-Structures, Wuhan University, Wuhan, 430072, China. E-mail: cxpan@whu.edu.cn; Tel: +86-27-68752481 ext. 8168
bCenter for Electron Microscopy, Wuhan University, Wuhan, 430072, China
First published on 5th January 2017
Abstract
The amount of graphene (Gr) in a composite plays a key role in enhancing the performance of the composite. In general, an indirect method, that is, by adjusting the concentration of Gr (or GO) in the electrolyte, is used to study the influence of the graphene content on the properties of copper (Cu)–Gr composite foil. In this paper, we firstly propose a direct and accurate approach, that is, by using an instrumental carbon and sulfur analyzer, to determine the amount of Gr in the direct current electrodeposited Cu–Gr composite foil, and also obtain the relationship between the amount of Gr in the composite foils and the concentration of GO in the electrolyte. Further, mechanical property measurements reveal that: (1) the variations in the mechanical properties (involving the elastic modulus, hardness and tensile strength) of the Cu–Gr foils along with the concentration of GO in the electrolyte exhibit similar tendencies to that of the Gr content in the Cu–Gr foils. (2) According to current experimental conditions, the optimal values of the mechanical properties and the amount of Gr in the foils appears at a GO concentration of 0.5 g L−1 in the electrolyte. (3) When the GO concentration is less than 0.5 g L−1, the values of the mechanical properties and the amount of Gr in the foils present an approximately linear relationship; and beyond 0.5 g L−1, the values become unstable and declining, which can be attributed to an agglomeration of excess GO in the electrolyte which makes it difficult to be co-deposited into the foil.
Introduction
Graphene (Gr), which emerged recently as a new carbon material with a one-atom thick 2D layer structure, has been recognized as an attractive reinforcing phase due to its unique and excellent physical, chemical and mechanical properties.1 In general, Gr reinforced metal composites can improve numerous properties of metals, such as: hardness, elastic modulus, tensile strength, corrosion resistance, and wear resistance,2–4 which indicates an important prospect for the application of Gr in the field of composites.So far, various metals including stainless steel,5 Au,6 Pt,7 Ag,8 Ti,9 and Cu10 have been used to prepare Gr–metal composites by using different processes, such as power metallurgy,11–14 the sol–gel method,15–17 hydrothermal18,19 and electrochemical deposition.20–22 Among those processes, power metallurgy was the most frequently studied for producing the Cu–Gr composite, in which Gr is mixed with copper powders and composites obtained by hot pressing sintering.23 The sol–gel method refers to a process in which Gr and metal alkoxide are dissolved into organic solvents to form a homogeneous solution, and then the other components are added for a reaction to form a gel at certain temperatures, and finally dry products. The hydrothermal method is a process in which a specific metal is added into a Gr suspension, reacting under conditions of high temperature and high pressure in a sealed pressure vessel. However, only a few studies are related to the preparation of Gr–copper (Cu) composite foil by electrochemical deposition.
It has been recognized that adding Gr into the copper matrix will greatly affect the mechanical and electric performance of the composites. However, for the preparation of the electrodeposited Cu–Gr composite foil, there are two critical problems still unsolved: (1) the direct and accurate determination of the amount of Gr in the foil; (2) the relationship between the concentration of Gr or graphene oxide (GO) in the electrolyte and the amount of Gr in the foil. Obviously, the solution of these problems will have a great significance for the applications of graphene in composites.
Recently, most research has indirectly determined the relationship between the performance of the Cu–Gr composite foil and the Gr content by adjusting the concentration of Gr or GO in the electrolyte. For instance, Pavithra et al.24 prepared Cu–Gr composite foils by pulse reverse electrochemical deposition. Compared with a pure Cu foil, the hardness and elastic modulus of the Cu–Gr foil increased by 96%, but the electric conductivity decreased by 35%. They found that the optimal concentration of GO in the electrolyte (from 0.1 g L−1 to 1.0 g L−1) was 0.5 g L−1. Jagannadham25–27 prepared Cu–Gr composites at a low current density of 1.75 mA cm−2 by electrochemical co-deposition. An indirect method, named effective mean field analysis (EMA), was used to determine the volume fraction of Gr in the composites. It was found that the thermal conductivity of Cu–Gr foils decreased from 510 W m−1 K−1 at 250 K (−23 °C) to 440 W m−1 K−1 at 350 K (77 °C) and the resistivity of electrolytic Cu was reduced by 10–20% with the addition of 8–11% Gr volumes. Xie et al.28 adopted cyclic voltammetry (CV) to define the electrochemical deposition conditions in CuSO4 solutions, including GO concentrations ranging from 0.1 mg mL−1 to 0.5 mg mL−1. The electrical and electroactive properties of the Cu–Gr composite foils were investigated. The results showed that compared with polished Cu foil and electrodeposited Cu foil, the Cu–Gr composite foils maintained a lower electrical resistivity. The order of the electroactivity was polished Cu foil > Cu–Gr composite foil > electrodeposited Cu foil. Huang et al.29 also prepared Cu–Gr composite foil by using a pulse current electrochemical deposition and adding different amounts of Gr from 0.05 g L−1 to 0.3 g L−1 to the electrolyte. The results revealed that the Cu–Gr composite had an equal resistivity to Cu, and the tensile strength and yield strength increased by 21.1% and 39.1%, respectively.
In general, for practical applications, it is best to know the Gr content in the composite foil and to measure its influence on the foil's mechanical and electrical properties. In this paper, we prepared Cu–Gr composite foils through direct current electrochemical deposition, and firstly proposed a direct approach to accurately determine the amount of Gr in the foil through the measurement of the carbon (C) content in the foil by using a high frequency infrared carbon and sulfur analyzer. Simultaneously, the relationship between the Gr content in the foils and the corresponding GO concentration in the electrolyte was figured out. Due to the complexity of the electrochemical process and numerous influencing factors on the amount of Gr in the foils, we only investigated the relationship between the Gr content in the foils and concentration of GO in the electrolyte under certain constant parameters, and the effects of other possible factors will be studied in our following work.
Experimental section
All experimental reagents were of analytical grade and deionized water was utilized to prepare the electrolyte. Graphene oxide (GO) was synthesized from natural graphite powders by a modified Hummers' method.30 The Cu–Gr composite foils were prepared by using direct current electrochemical deposition in an electrolytic bath consisting of 250 g L−1 CuSO4 and 130 g L−1 H2SO4. In order to avoid the agglomeration of GO during deposition, 50 × N ppm surfactant polyacrylic acid (PAA 5000) was added into the electrolyte, where N is the concentration of GO (from 0.05 g L−1 to 1 g L−1). The bath temperature was maintained between 20 and 25 °C. The 30 micron composite foils were achieved under conditions of magnetic stirring, when the current density and deposition time were 5 A dm−2 and 30 minutes, respectively. For comparison, electrodeposited pure Cu foil was also prepared by using the same electrolyte without the addition of GO.Carbon content measurements of the Cu–Gr foils were made by using a frequency infrared carbon and sulfur analyzer (CS-206, Shanghai Baoying Tech Co., Ltd., China) with an accuracy of 1.0 ppm. The morphologies and chemical compositions of the samples were characterized by a scanning electron microscope (SEM) (S-4800, Hitachi, Japan, and SIRON, FEI, The Netherlands) equipped with an energy-dispersive X-ray spectroscope (EDS); transmission electron microscope (TEM, JEM-2100, JEOL, Japan) with an acceleration voltage of 200 kV; high-resolution transmission electron microscopy (HRTEM) (JEM 2010 FEF-HRTEM, JEOL, Japan); a laser scanning confocal micro-Raman spectrometer (LabRAM HR, HORIBA, France) with a laser excitation wavelength of 488 nm and scans on an extended range of 1000–3000 cm−1; a Fourier transform infrared spectrometer (FT-IR, Nicolet iS10, Thermo Fisher, USA) with a scanning range of 525–4000 cm−1; an X-ray photoelectron spectroscope (XPS, ESCALAB 250Xi, Thermo Fisher, USA) with Al Kα radiation of 1486.6 eV as the excitation source; an atomic force microscope (AFM, Multimode 8, Bruker, Germany) with scan assist-air probe under peak force mode in ambient conditions.
The hardness and elastic modulus of the samples were measured using an instrumental nanoindenter (Agilent G200 Nanoindenter, Agilent Technologies, USA). The CSM standard hardness and modulus test programs were used, in which the harmonic depth and frequency were 2 nm and 45 Hz, respectively. The maximum indentation depth was 2000 nm. For each sample, 10 points were tested to get an average value. The tensile strength of the samples was measured by an electronic universal testing machine (model CMT6203, MTS systems Co., Ltd.) in accordance with the testing method IPC-TM-650, where the width of the samples was 12.7 mm and the tensile rate was 2 mm min−1.
Results and discussion
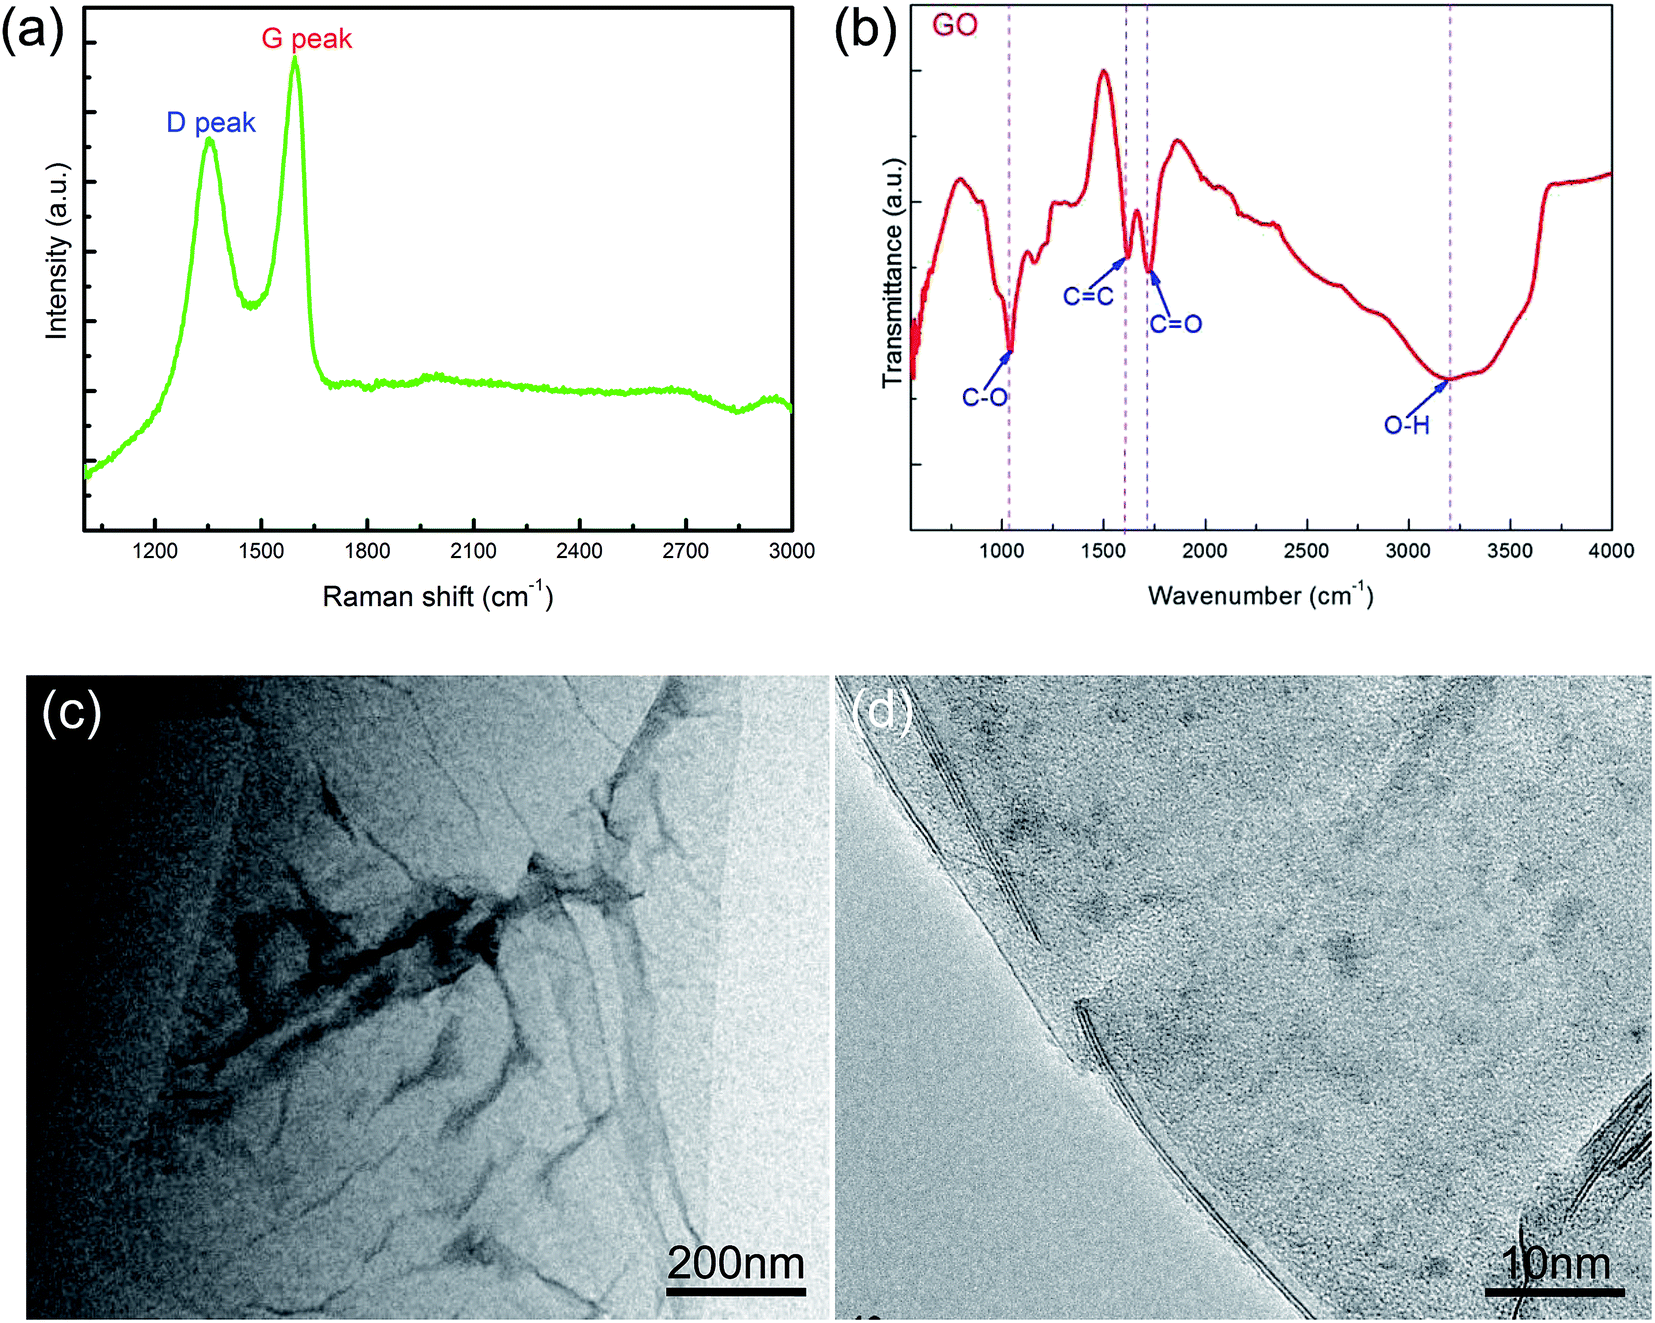
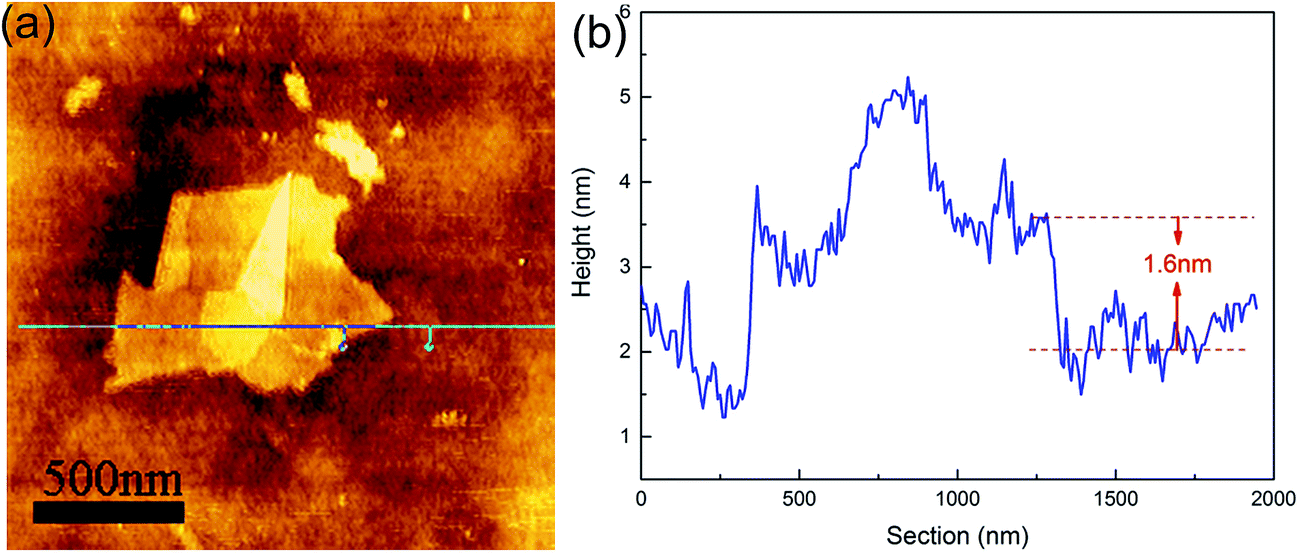
Fig. 1 shows the characterizations of the GO by using Raman and FT-IR spectrometers and TEM. The Raman spectra showed a D peak at 1361.8 cm−1, a G peak at 1594.9 cm−1, and the ID/IG ratio was 0.84, which revealed the defects in GO. The FT-IR result showed the characteristic peaks, i.e., O–H stretching vibration at ≈3189 cm−1, C![[double bond, length as m-dash]](https://www.rsc.org/images/entities/char_e001.gif) O (carboxyl/carbonyl) stretching at ≈1720 cm−1, CC (aromatic ring) at ≈1620 cm−1, and C–O (alkoxy) stretching at ≈1043 cm−1, corresponding to the typical peaks of GO. The TEM image showed that the GO exhibited a kind of layered structure, and HRTEM observation revealed that it was a bilayer GO. AFM measurement indicated that the GO thickness was about 1.6 nm, as shown in Fig. 2, which also confirmed a bilayer structure for the GO.
O (carboxyl/carbonyl) stretching at ≈1720 cm−1, CC (aromatic ring) at ≈1620 cm−1, and C–O (alkoxy) stretching at ≈1043 cm−1, corresponding to the typical peaks of GO. The TEM image showed that the GO exhibited a kind of layered structure, and HRTEM observation revealed that it was a bilayer GO. AFM measurement indicated that the GO thickness was about 1.6 nm, as shown in Fig. 2, which also confirmed a bilayer structure for the GO.
 | ||
| Fig. 1 Characterization of the GO. (a) Raman spectrum; (b) FT-IR spectrum; (c) TEM image; (d) HRTEM image. | ||
 | ||
| Fig. 2 (a) AFM image and (b) its height profile of the GO. | ||
Fig. 3 shows the SEM images of the GO, pure Cu foil and composite foil prepared by electrochemical deposition. Clearly, GO presented a sheet morphology with wrinkles on the surface, so that it could be dispersed uniformly in the electrolyte. In the Cu–Gr foil, the layered Gr structures were observed on the etched surface, but the layered Gr was not found in the pure Cu foil. In addition, it was noted that after etching, the Cu–Gr foil exhibited stronger corrosion resistance than the pure Cu foil in hydrochloric acid, because there were a lot of etching holes on the surface of the pure Cu foil, while there were very few holes on the surface of the Cu–Gr foil. EDS chemical composition analysis revealed that only the peaks of Cu Lα and Cu Kα were observed for the pure Cu foil; while an additional relatively strong peak of C Kα and a weak peak of O Kα existed for the composite foil, as shown in Fig. 4. This result further indicated that GO has been co-deposited into the composite foil, but the amount was low.
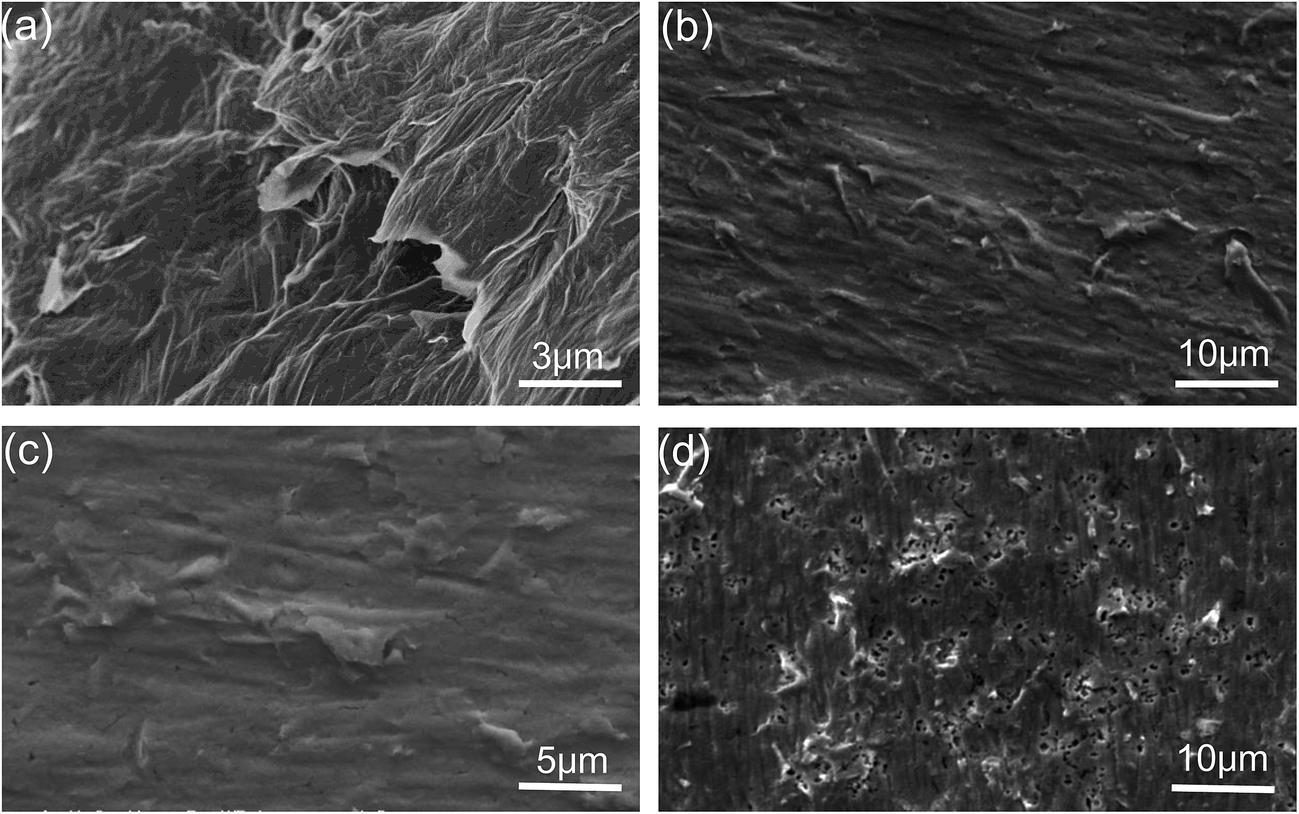 | ||
| Fig. 3 SEM images of the samples. (a) GO; (b) Cu–Gr composite foil etched in HCl and FeCl3 solution; (c) high magnification of the foil; (d) pure copper foil etched in HCl and FeCl3 solution. | ||
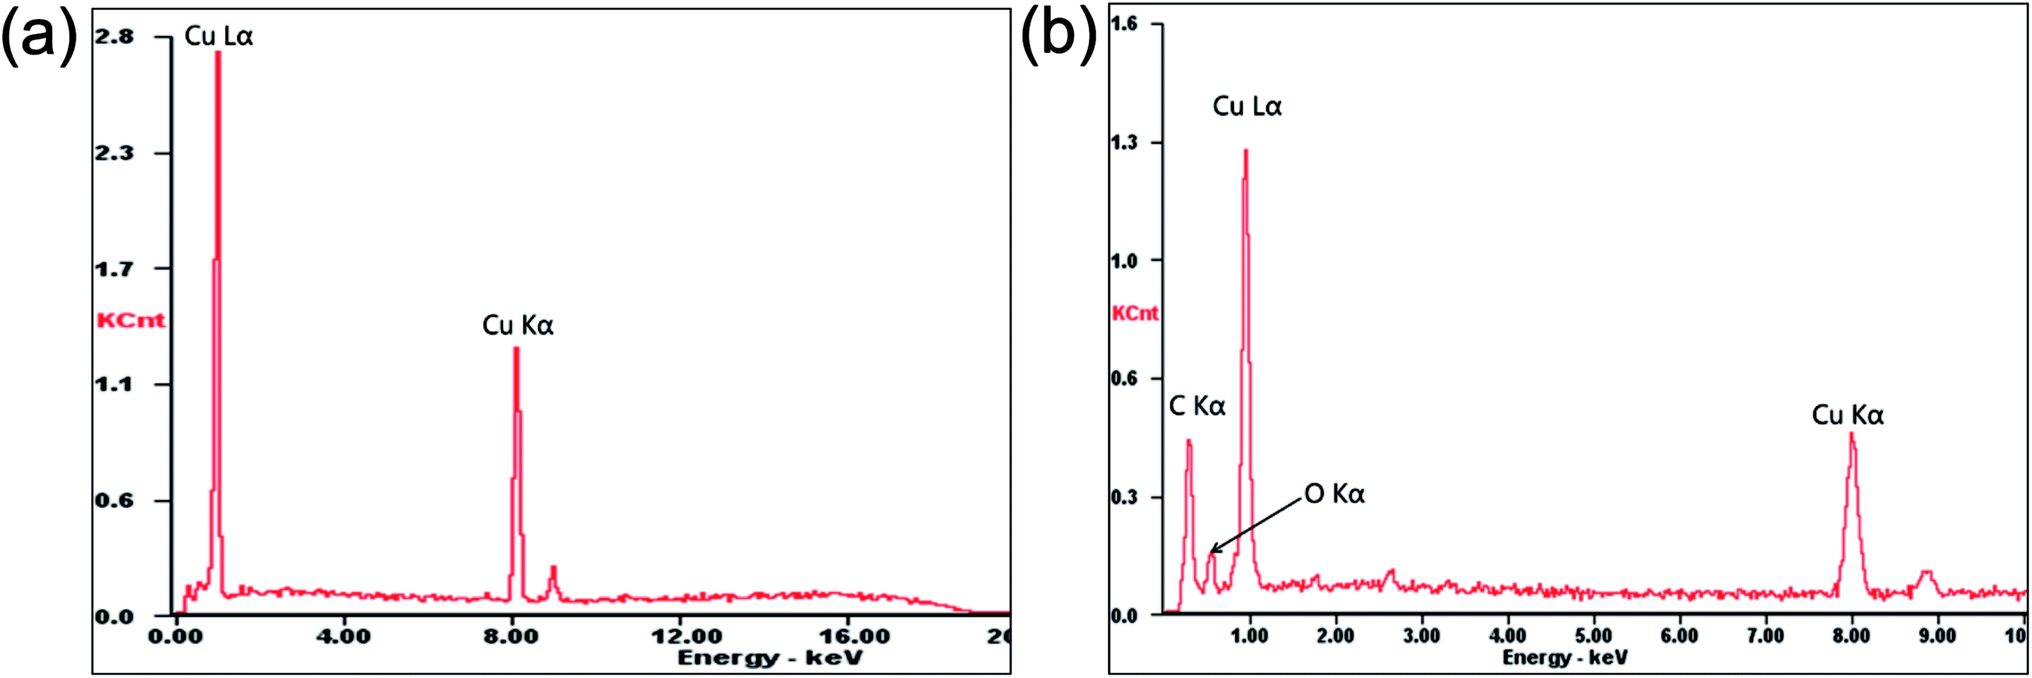 | ||
| Fig. 4 EDS spectra of the samples. (a) Pure Cu foil; (b) Cu–Gr composite foil. | ||
Fig. 5 shows the EDS mapping of the element distributions in the Cu–Gr foil. It can be seen that the Cu, C and O elements were distributed uniformly in the foil, and a few Gr aggregated in some areas, which demonstrated that GO has been co-deposited uniformly in the Cu–Gr foil. This was because the hydrophilicity of GO was improved by oxygen functional groups like carboxylic acid, and GO could also suspend stably in the electrolyte due to the addition of a few proper surfactants. However, during electrochemical deposition, GO was reduced partially to Gr at high current,28 which decreased the oxygen functional groups and increased the hydrophobicity of GO, so that it was easier to form GO agglomerations.
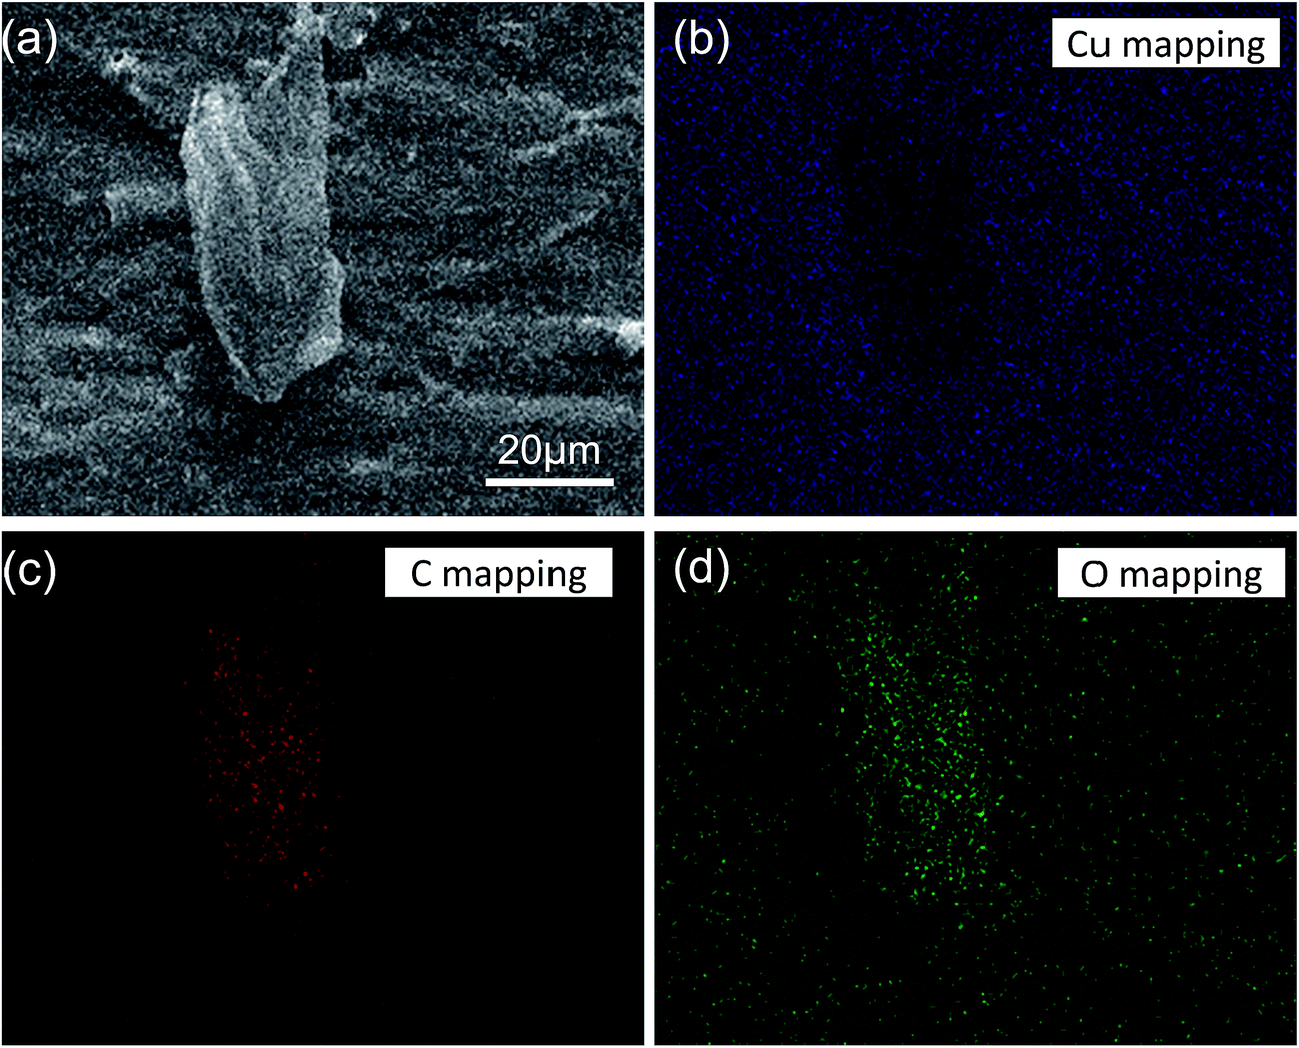 | ||
| Fig. 5 EDS elemental mapping analysis of the Cu–Gr composite foil. (a) SEM image; (b) Cu element; (c) C element; (d) O element. | ||
Fig. 6 illustrates XPS spectra of the composite foil. For the C 1s spectrum, the main peak at 284.8 eV is the sp2-bonded carbon, and the minor peaks at 288.6 eV represent the O–CO bonds. Correspondingly, the O 1s spectrum can be divided into two peaks with binding energies of 530.61 and 531.8 eV, which can be assigned to the Cu2O and O–CO bonds, respectively.28 The XPS measurements revealed that the C/O ratio was 2.73 for Gr in composite foil, and 1.14 for original GO, which indicated that the GO had been reduced during the process.
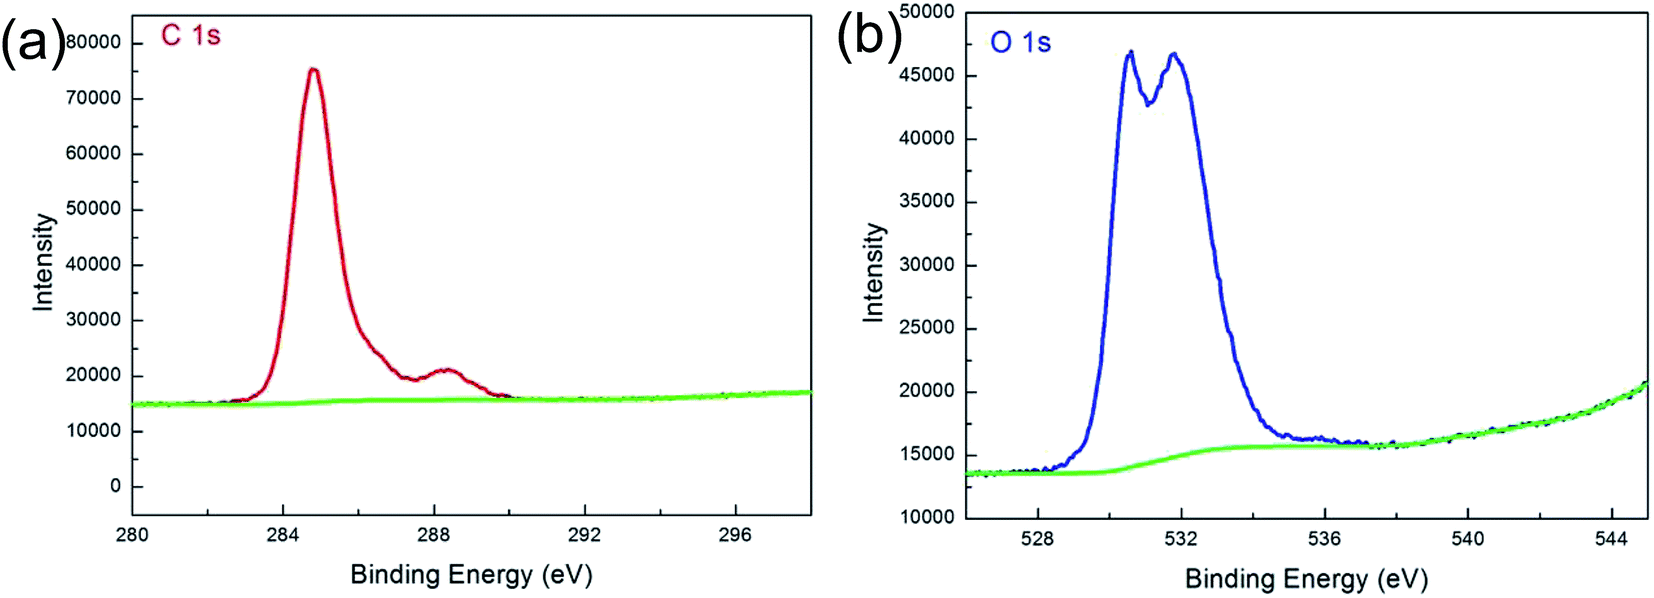 | ||
| Fig. 6 XPS spectra of the Cu–Gr composite foil. (a) C 1s; (b) O 1s. | ||
Fig. 7 shows the cross sections of pure Cu foil and the composite foil after tensile failure. It was found that the facture surface of the composite foils was significantly different from that of pure Cu foil. That is, the dimples in the composite foil revealed a higher ductility than pure Cu foil. It seemed that the GO exhibited an adhesive effect on the composite foil, and improved the tensile strength. More in-depth work is being carried out in our further experiments.
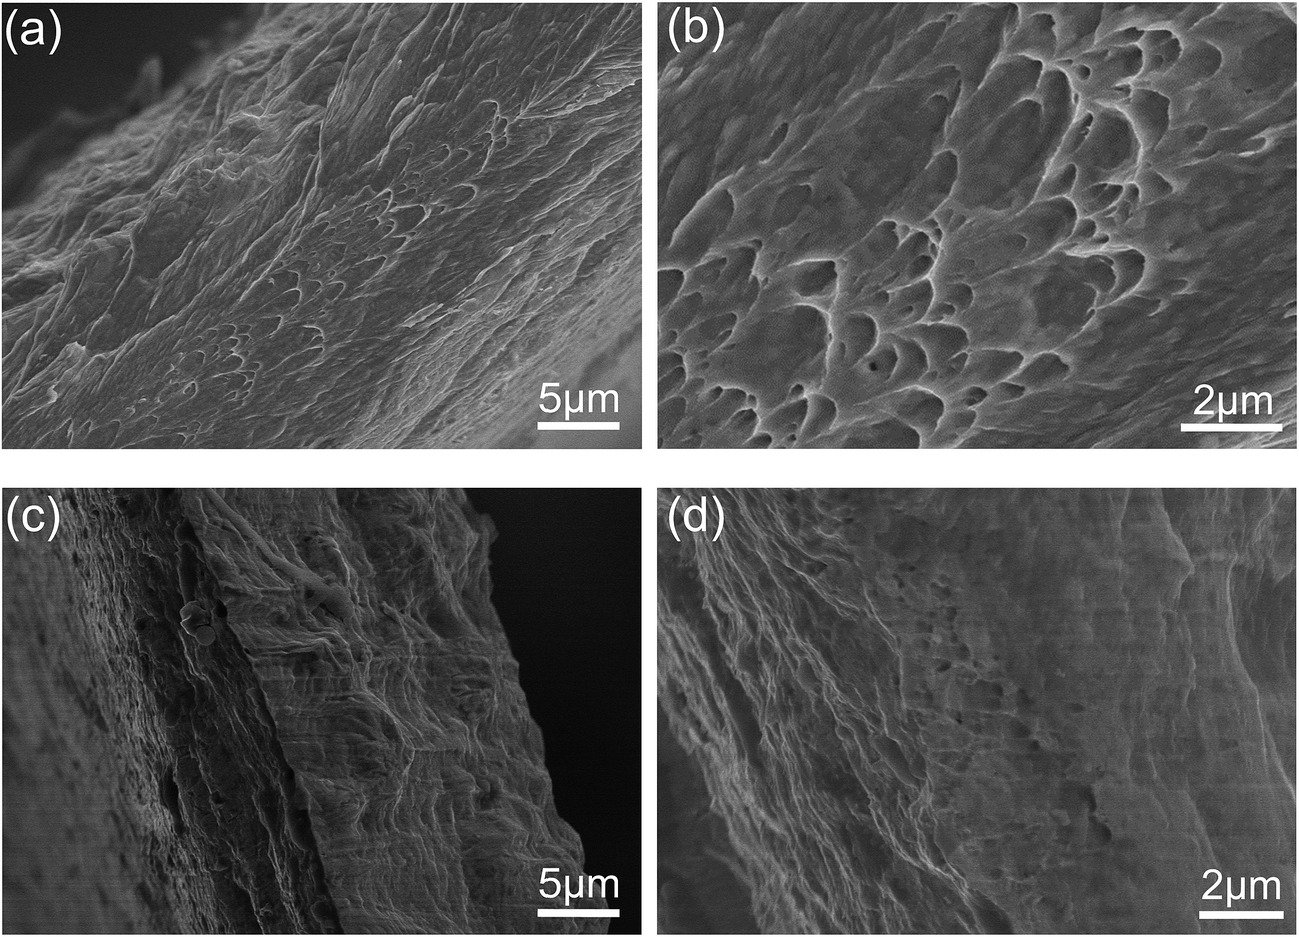 | ||
| Fig. 7 SEM images of the tensile facture surfaces from the cross section of the foils. (a) Low magnification and (b) high magnification of the composite foil; (c) low magnification and (d) high magnification of pure copper foil. | ||
It is well known that besides the homogeneous distribution of Gr in the composite, its amount is also a main factor affecting the performance of the composite. So far, most research work estimates the Gr content and its influence on the property of the composite indirectly by controlling the concentration of Gr or GO in the electrolyte.24,28,29 However, at present electrochemical deposition is a complex process, because Cu ions (+0.34 V) and Gr (+1.2 V) deposit at different sedimentation potentials. Therefore Cu and Gr do not deposit and reduce at the same time. That is to say, during the deposition, the relationship between the amount of Gr in the foil and Gr (or GO) in the electrolyte is not necessarily linear. Strictly speaking, the amount of Gr in the foil should be determined directly and accurately in order to reveal the exact effect on the performance of the composite foil.
In this work, we present an approach to directly and accurately determine the Gr amount in the Cu–Gr composite foil through the measurement of carbon content in the foil by using a hypersensitized carbon and sulfur analyzer, which is commonly used in the iron and steel industry for chemical composition analysis. The working principle of the carbon and sulfur analyzer is as follows: firstly the refined carrier gas (oxygen gas) is passed into the burner (a resistance furnace or high-frequency furnace), and then the carbon and sulfur elements in the samples will be oxidized into CO, CO2 and SO2. These gas mixtures are transported into a sulfur detection pool in order to determine the amount of sulfur. Subsequently, gas mixtures are further oxidized in order to convert CO into CO2 and transported into the carbon detection pool to determine the amount of carbon. The residual gas is discharged into the outside. The accuracy grade of this equipment can be up to ppm for measurements of carbon and sulfur.
In addition, establishing the relationship between the concentration of Gr (or GO) in the electrolyte and the amount of co-deposited Gr in the composites also has great value both in theory and in practice. Fig. 8 illustrates the relationship between the GO concentrations in the electrolyte and the Gr content in the composite foils. It was found that with a sequential increase in the GO concentration in the electrolyte, the amount of carbon (C) in the composite foils increased at first and then decreased. And the first portion exhibited an approximately linear relationship with a slope of 0.0595, which revealed that the C content in the foil increased slowly along with the increase in GO concentration in the electrolyte. After the amount of co-deposited Gr reached its maximum value (about C = 0.03594 wt%) at 0.5 g L−1 GO concentration in the electrolyte, with a further increase in GO concentrations in the electrolyte, the Gr content in the foil showed an abrupt downward trend at first, and then continued down. This is because the rheological behaviour of the electrolyte changed with an increase in the GO concentration. That is to say, the dominant interparticle forces, including electrostatic repulsive forces and van der Waals forces, change according to the GO concentration in the electrolyte during electrodeposition. Considering the complex hydrodynamic interactions, we propose the following possible changes: (1) in the range 0.1–0.5 g L−1, electrostatic repulsive forces play a leading role, because GO with charged ions disperses uniformly under the presence of a surfactant. (2) However, when the concentration is higher than 0.5 g L−1, the dominant interparticle force gradually becomes the van der Waals force because of the over high surface Gibbs free energy of GO. Thus, when the concentration of GO in the electrolyte is excessive, despite the presence of a surfactant, the oversized GO agglomerations occurred and the GO dispersion in the electrolyte also became worse. In this way, these agglomerations would be easier to be desorbed from the cathode under the strong convection, so that they were more difficult to capture into the composite foil.31
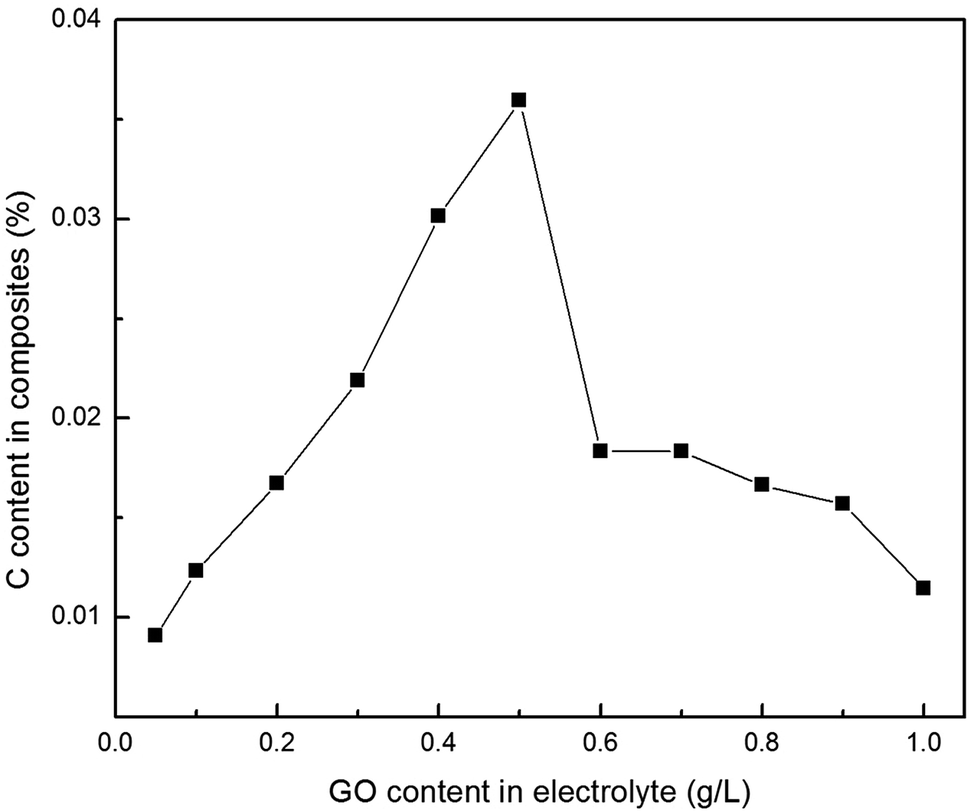 | ||
| Fig. 8 Relationship between the GO concentrations in the electrolyte and the C content in the Cu–Gr composite foil. | ||
Fig. 9 and 10 show the changes in mechanical properties of the composite foils with an increase in the GO concentration in the electrolyte. Obviously, compared to Fig. 8, the values of elastic modulus, hardness and tensile strength exhibited similar tendencies with variations in the GO concentration in the electrolyte. That is to say, when the GO concentration was up to 0.5 g L−1 in the electrolyte, the amounts of C or Gr in the foils were at their highest, and the corresponding mechanical properties also reached their maximum values, which is coincident with the results of many studies.20,24,32 However, when the GO concentration in the electrolyte further increased, the decrease in the co-deposited Gr in the foil resulted in a decrease in its mechanical properties. Actually, at a high concentration of GO in the electrolyte, the mechanical properties of the foils were unstable due to the GO agglomerations and the complexity of electrochemical deposition. This phenomenon suggested that the GO concentration in the electrolyte should not be too high.
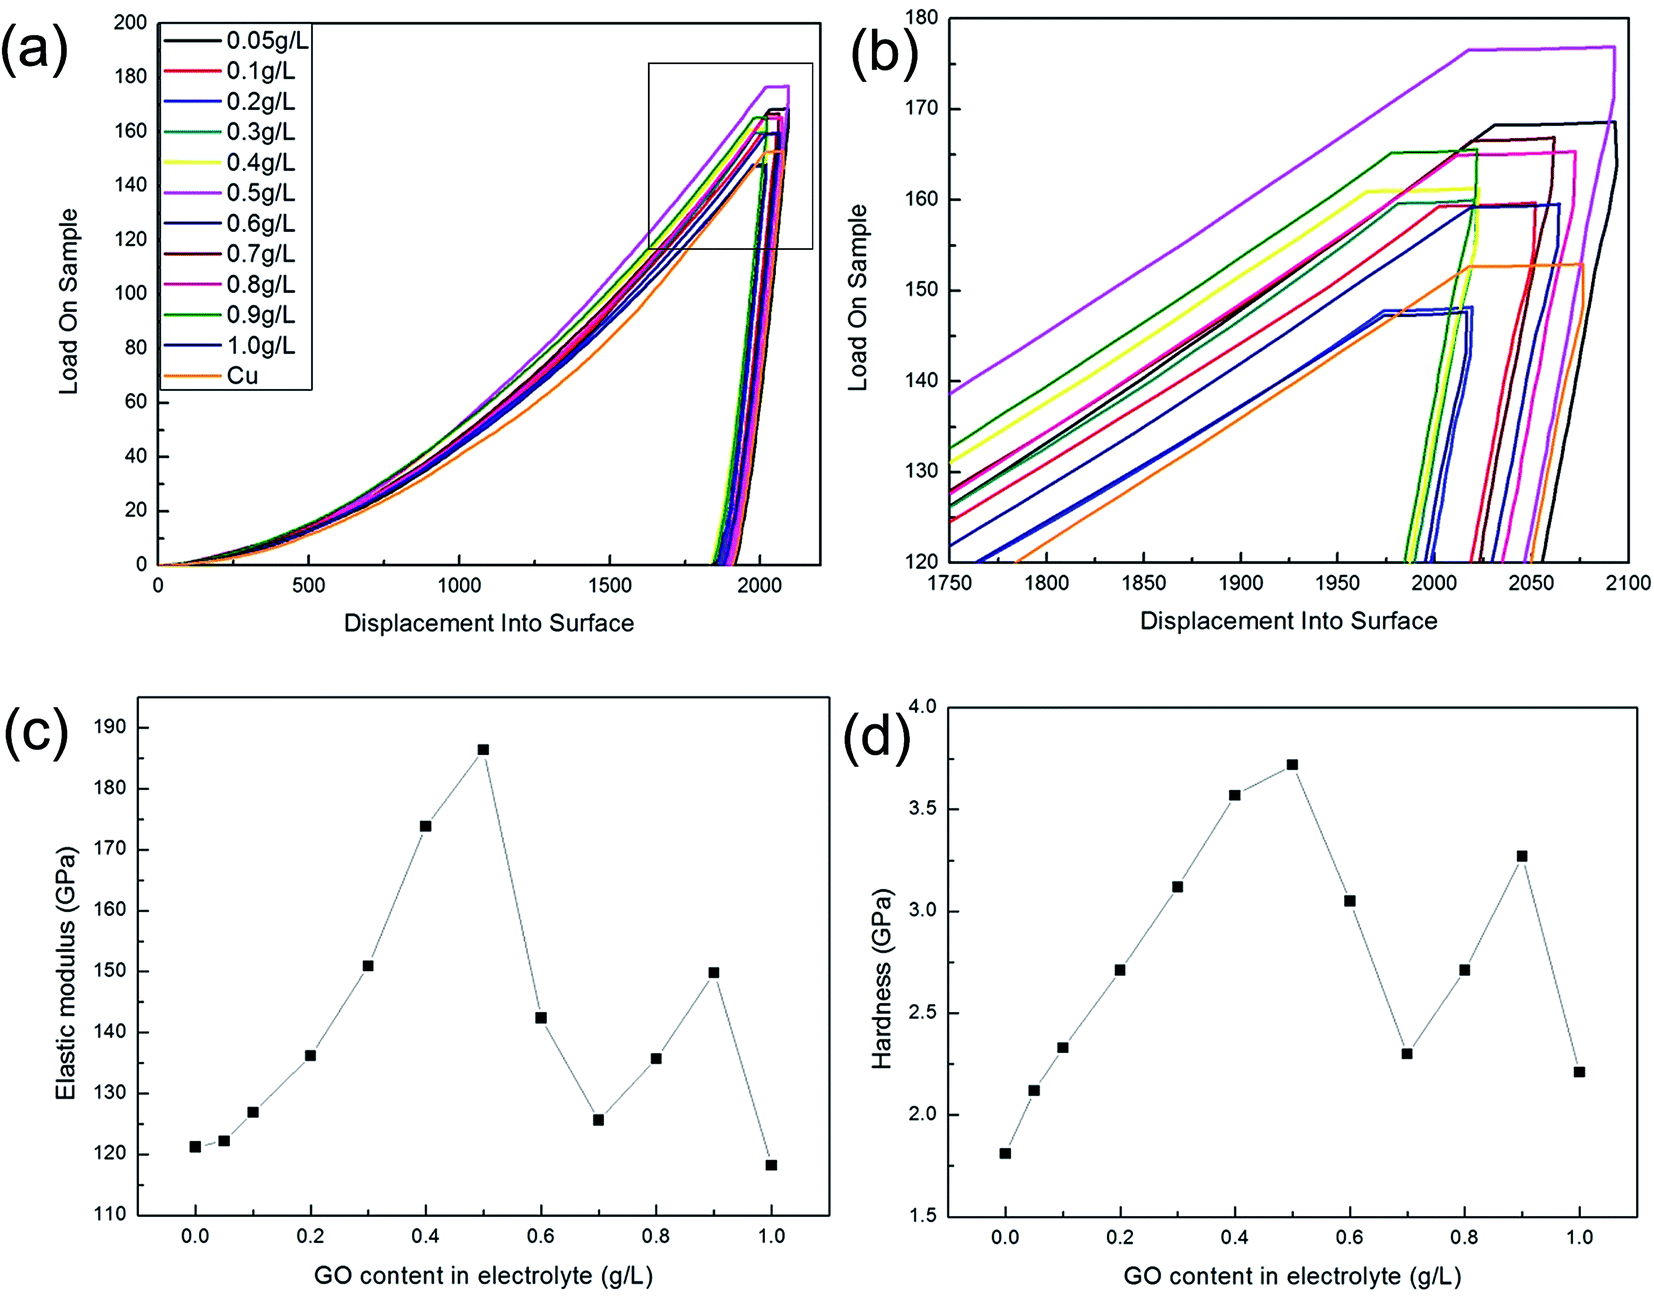 | ||
| Fig. 9 Nanoindentation measurements of the samples. (a) Load–displacement curves; (b) partial enlarged drawing; (c) elastic modulus; (d) hardness. | ||
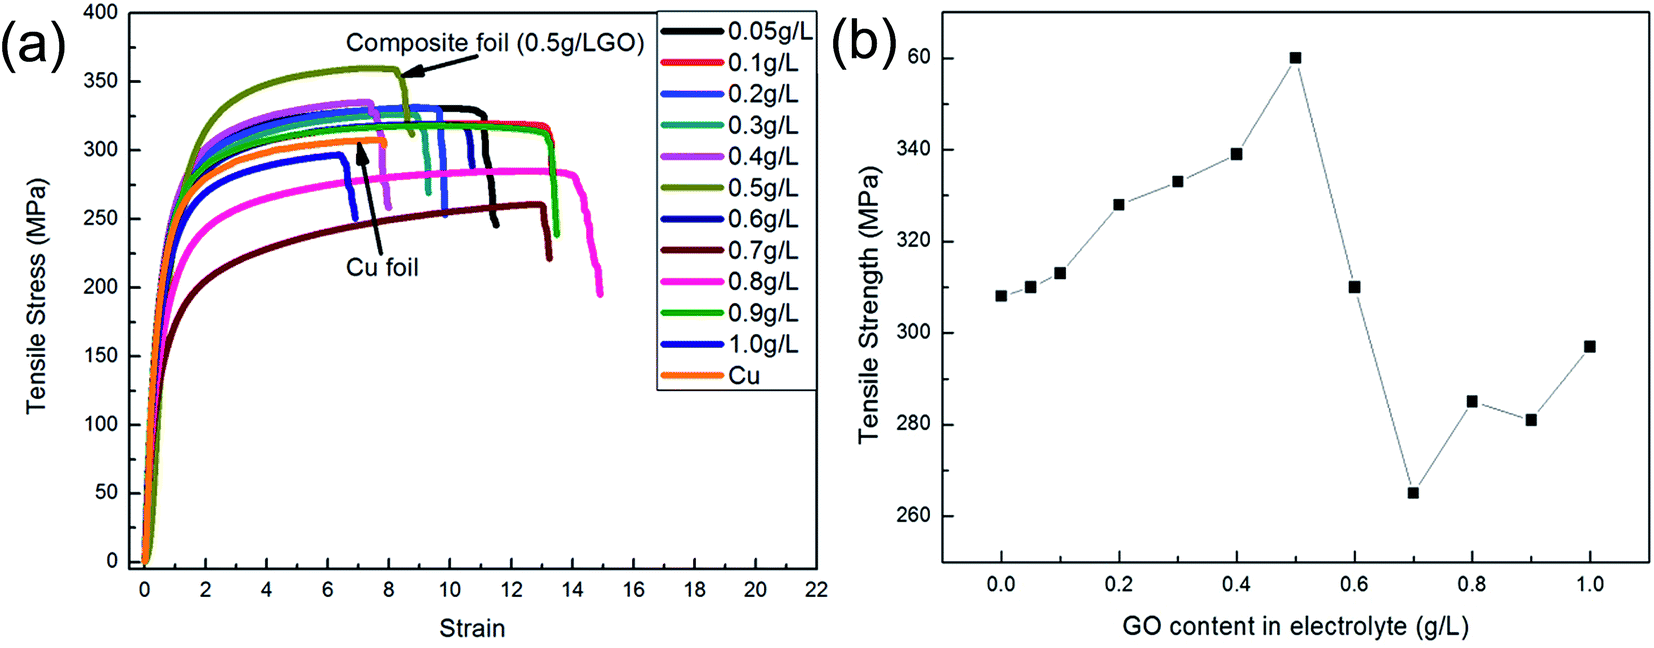 | ||
| Fig. 10 Tensile test of the samples. (a) Stress–strain curves; (b) tensile strength. | ||
Conclusions
(1) A Cu–Gr composite foil was prepared by using direct current electrochemical deposition. The amount of Gr in the foil was directly and accurately determined through measurement of the carbon (C) content in the foil by using a high frequency infrared carbon and sulfur analyzer. And the relationship between the Gr content in the foils and the corresponding GO concentration in the electrolyte was obtained for the first time.(2) The variations in mechanical properties involving elastic modulus, hardness and tensile strength of the Cu–Gr foils were similar to the changes in amount of Gr in the foils with an increase in the GO concentration in the electrolyte.
(3) According to the current process, the optimal GO concentration in the electrolyte was 0.5 g L−1, which resulted in a maximum value of corresponding amount of C (0.03594 wt%) in the foil and the highest mechanical properties of the foil. However, excessive GO concentration in the electrolyte would cause agglomeration and make it more difficult for co-deposition into the foil. Compared with the pure Cu foil, the Cu–Gr foil exhibited a great enhancement in mechanical properties and had optimum values.
(4) The present approach for directly determining the amount of Gr in composites by using a carbon and sulfur analyzer has many advantages, such as simplicity, rapidity, high accuracy and good repeatability. It is expected to be employed in other areas of metal–graphene composites, and shows important significance both in investigation in the laboratory and in industrial applications.
Acknowledgements
This work was supported by the National Nature Science Foundation of China (No. 11174227), Kingboard Laminates Holdings Limited and Chinese Universities Scientific Fund. The authors would like to thank Shanghai Baoying Tech Co., Ltd. for testing cooperation.References
- K. S. Novoselov, V. I. Fal'ko, L. Colombo, P. R. Gellert, M. G. Schwab and K. Kim, Nature, 2012, 490, 192–200 CrossRef CAS PubMed.
- A. Majeed, W. Ullah, A. W. Anwar, F. Nasreen, A. Sharif, G. Mustafa and A. Khan, J. Alloys Compd., 2016, 671, 1–10 CrossRef CAS.
- Q. Ke and J. Wang, Journal of Materiomics, 2016, 2, 37–54 CrossRef.
- H. G. P. Kumar and M. A. Xavior, Procedia Eng., 2014, 97, 1033–1040 CrossRef CAS.
- A. C. Stoot, L. Camilli, S.-A. Spiegelhauer, F. Yu and P. Bøggild, J. Power Sources, 2015, 293, 846–851 CrossRef CAS.
- Y. Luo, F. Y. Kong, C. Li, J.-J. Shi, W.-X. Lv and W. Wang, Sens. Actuators, B, 2016, 234, 625–632 CrossRef CAS.
- C. Zhang, Y. Zhang, X. Du, Y. Chen, W. Dong, B. Han and Q. Chen, Talanta, 2016, 159, 280–286 CrossRef CAS PubMed.
- X. Wang, N. Wang, T. Gong, Y. Zhu and J. Zhang, Appl. Surf. Sci., 2016, 387, 707–719 CrossRef CAS.
- Z. Li, Y. Zhou, Y. Yang and H. Dai, Mater. Des., 2016, 105, 352–358 CrossRef CAS.
- J. Hwang, T. Yoon, S. H. Jin, J. Lee, T. S. Kim, S. H. Hong and S. Jeon, Adv. Mater., 2013, 25, 6724–6729 CrossRef CAS PubMed.
- D. Zhang and Z. Zhan, J. Alloys Compd., 2016, 654, 226–233 CrossRef CAS.
- J. Li, L. Zhang, J. Xiao and K. Zhou, Trans. Nonferrous Met. Soc. China, 2015, 25, 3354–3362 CrossRef CAS.
- D. Zhang and Z. Zhan, J. Alloys Compd., 2016, 658, 663–671 CrossRef CAS.
- M. Li, H. Che, X. Liu, S. Liang and H. Xie, J. Mater. Sci., 2014, 49, 3725–3731 CrossRef CAS.
- C. Hintze, K. Morita, R. Riedel, E. Ionescu and G. Mera, J. Eur. Ceram. Soc., 2016, 36, 2923–2930 CrossRef CAS.
- Z. Tian, Z. Zhou, S. Liu, F. Ye and S. Yao, Solid State Ionics, 2015, 278, 186–191 CrossRef CAS.
- C. T. Chou, F. H. Wang and W. C. Chen, Thin Solid Films, 2016, 605, 143–148 CrossRef CAS.
- Z. L. Wu, C. K. Li, J. G. Yu and X. Q. Chen, Sens. Actuators, B, 2017, 239, 544–552 CrossRef CAS.
- W. Zhang, H. Guo, H. Sun and R. C. Zeng, Appl. Surf. Sci., 2016, 382, 128–134 CrossRef CAS.
- H. Wu, F. Liu, W. Gong, F. Ye, L. Hao, J. Jiang and S. Han, Surf. Coat. Technol., 2015, 272, 25–32 CrossRef CAS.
- J. Chen, J. Li, D. Xiong, Y. He, Y. Ji and Y. Qin, Appl. Surf. Sci., 2016, 361, 49–56 CrossRef CAS.
- C. Zhao and J. Wang, Phys. Status Solidi A, 2014, 211, 2878–2885 CrossRef CAS.
- W. Li, D. Li, Q. Fu and C. Pan, RSC Adv., 2015, 5, 80428–80433 RSC.
- C. L. Pavithra, B. V. Sarada, K. V. Rajulapati, T. N. Rao and G. Sundararajan, Sci. Rep., 2014, 4, 4049 CrossRef PubMed.
- K. Jagannadham, Metall. Mater. Trans. A, 2012, 44, 552–559 CrossRef.
- K. Jagannadham, Metall. Mater. Trans. B, 2011, 43, 316–324 CrossRef.
- K. Jagannadham, J. Vac. Sci. Technol., B: Microelectron. Nanometer Struct., 2012, 30, 03D109 Search PubMed.
- G. Xie, M. Forslund and J. Pan, ACS Appl. Mater. Interfaces, 2014, 6, 7444–7455 CAS.
- G. Huang, H. Wang, P. Cheng, H. Wang, B. Sun, S. Sun, C. Zhang, M. Chen and G. Ding, Microelectron. Eng., 2016, 157, 7–12 CrossRef CAS.
- Y. Gong, D. Li, Q. Fu and C. Pan, Prog. Nat. Sci.: Mater. Int., 2015, 25, 379–385 CrossRef CAS.
- H. Gül, F. Kılıç, M. Uysal, S. Aslan, A. Alp and H. Akbulut, Appl. Surf. Sci., 2012, 258, 4260–4267 CrossRef.
- H. Algul, M. Tokur, S. Ozcan, M. Uysal, T. Cetinkaya, H. Akbulut and A. Alp, Appl. Surf. Sci., 2015, 359, 340–348 CrossRef CAS.
| This journal is © The Royal Society of Chemistry 2017 |