 Open Access Article
Porous silver coating fiber for rapidly screening organotin compounds by solid phase microextraction coupled with surface enhanced Raman spectroscopy†
Zhen Liua,
Le Wangb,
Weiwei Bianac,
Min Zhanga and
Jinhua Zhan*a
aKey Laboratory of Colloid and Interface Chemistry, Ministry of Education, Department of Chemistry, Shandong University, Jinan 250100, China. E-mail: jhzhan@sdu.edu.cn
bCenter of Technology, Jinan Entry-Exit Inspection and Quarantine Bureau of the People's Republic of China, Jinan 250014, China
cDepartment of Pharmacy, Weifang Medical University, Weifang 261053, China
First published on 13th January 2017
Abstract
Preclinical research reveals the risk of organotin compounds (OTCs) as potent endocrine disruptors, immunotoxicants and environmental obesogens for mammals. OTCs are commercial antifungal agents which are found extensively in clothing, female hygiene products and childcare articles. OTCs have been listed as restricted chemicals by REACH Regulation (Annex XVII). Here, a hyphenated method combining surface enhanced Raman spectroscopy (SERS) with solid phase microextraction (SPME) is proposed for rapid screening of OTCs. A porous Ag layer was synthesized in situ and served as the SERS-active SPME coating for adsorption. The SERS spectra of trimethyltin chloride, tributyltin chloride and triphenyltin chloride were investigated, the bands at 554 cm−1, 1410 cm−1 and 999 cm−1, respectively, being selected as the characteristic peaks for quantitative determination. The extraction conditions were optimized. The good stability and uniformity of porous Ag fibers insure a high enhancement factor of 9.1 × 10⁵ and low LOD of 0.2 ppb for triphenyltin chloride. The proposed method was successfully applied to identify a mixture of OTCs in a textile matrix with satisfactory results.
Introduction
Organotin compounds (OTCs) are highly toxic and persistent chemicals with potential bioaccumulation.1 OTCs, and especially tributyltin, can perform as agonists for nuclear retinoid X receptors (RXR). This represses the transcription in target genes, eventually blocking many hormonal signals and regulatory pathways within the cells,2,3 such as lipid homeostasis and adipogenesis.4,5 OTCs have been listed as endocrine disruptors, immunotoxicants, and potent environmental obesogens for mammals.6 OTCs are commercial antifungal agents, PVC stabilizers and catalysts for the manufacture of consumer products, e.g., textiles, clothing, female hygiene products, childcare articles and toys.7–9 The intake of OTCs by a baby may, via skin contact with a diaper or chewing of soft toys and clothing, induce possible impairment of the central nervous system, immune system and reproductive system even at low concentrations.10 Consequently, the European Commission Directive 2009/425/EC has restricted the maximum concentration of dibutyltin (DBT), dioctyltin (DOT) and tri-substituted organotin in all consumer products to not more than 0.1% by weight of tin. These compounds are listed as restricted substances in the Annex XVII to the REACH Regulation.11Various methods have been developed for the identification and quantification of OTCs, e.g., gas chromatography (GC),12 high performance liquid chromatography (HPLC),13 capillary electrophoresis,14,15 fluorescence,16,17 colorimetric methods18 and atomic absorption spectra.19 Chromatography followed by mass spectrometry detection (MS, ICP-MS) is a conventional tool in the speciation analysis of OTCs, involving a derivatization procedure with sodium tetraethylborate.20 In order to fulfill the regulatory demands (e.g., Water Framework Directive, 2000/60/EC, 2008/105/EC and 2013/39/EU), most methods have focused mainly on the monitoring of OCTs in environmental samples.21 On the one hand, this strategy is usually required for traditional sampling and laboratorial detection. On the other hand, recent trends have focused on simplifying the operational steps, and then developing rapid, highly sensitive and on-site methods which can meet the demands of product safety, market supervision and import & export trading.22–24
Sampling techniques like liquid–liquid extraction (LLE), solid-phase extraction (SPE) and solid-phase microextraction (SPME) are effective, clean-up methods for organic sample extraction from a complex matrix.25 SPME is a speedy and efficient equilibrium extraction method, which has been proved to be a powerful pre-concentration procedure in OTCs analysis.26–28 SPME is based on the equilibrium distribution of a substance between the solvent and stationary phase on the supporting substrate. The stationary phase is usually composed of a thin coating layer of sorbent material, which plays a crucial role in the extraction and desorption process.29 On the other hand, the properties of the coating will determine the performance of extraction. Porous materials have unique properties, such as good porosity, large specific surface area, tunable polarity, and excellent mechanical and thermal stability, which make them very attractive as adsorbents in coating materials.30 Porous materials like silica,31 carbon,32,33 polymers,34,35 metal–organic frameworks (MOFs)36,37 and metals38–41 with excellent properties have been successfully used for fabrication of a high-capacity SPME coating layer.
Recently, the application of SPME coupled with surface enhanced Raman spectroscopy (SERS) has been proven to be an excellent technique, which integrates the pre-concentration and the sensitive identification in one step. The samples can be probed in situ using a portable Raman spectrometer, overcoming the need to transport them to the laboratory.42,43
SERS is an ultrasensitive analytical method, which has been widely used in the detection of explosives,44,45 illegal additives46,47 and cultural properties,48,49 particularly in the analysis of environmental pollutants, e.g. POPs,50–52 pesticides,53–55 and harmful ions.56–58 SERS can provide the detail of fingerprint spectra under electromagnetic and chemical enhancement. The electromagnetic enhancement is related to the surface plasmon resonance, which mainly depends on the surface nanostructures of the substrate.59,60 Various nanostructured noble metal substrates have been reported for improving the enhancement, such as nanoparticle colloids, nanowires, nano-arrays and nano-films.61,62 While conventional electrochemical methods can provide an effective, stable and reproducible porous substrate for SERS, in particular, in analytical applications.63,64
In this article, a porous Ag layer was electrochemically synthesized in situ and served as the SERS-active substrate for an absorption-type SPME coating. The SERS responses of triphenyltin, tributyltin and trimethyltin on this nanostructure surface were investigated, and the extraction capacities for these OTCs were subsequently evaluated and the extraction parameters were optimized. A fast and in situ analysis method for OTCs was established through SPME coupled with SERS by a portable Raman spectrometer. The proposed method was successfully applied to the determination of OTCs in textile samples, and the results were validated by ICP-MS.
Experimental
Chemicals
Trimethyltin chloride, triphenyltin chloride, tributyltin chloride (analytical standards) were purchased from Aladdin chemicals Co. Ltd. Silver wire (ø 0.4 mm, 99.9%) was purchased from Beijing nonferrous metal research institute. The organotins were dissolved in methanol (for HPLC, TEDIA®) to get a stock solution at 1.0 mM. Milli-Q water (18.2 MΩ) was used in all experiments.Preparation and characterization
Electrochemical synthesis was performed on a Princeton® PARSTAT 4000 electrochemical workstation in a three-electrode system; silver wires (effective area ø 0.4 × 30 mm), silver bucket, and SCE were employed as the working, auxiliary and reference electrode, respectively. The silver wires were firstly ultrasonically cleaned with acetone and ethanol to degrease them for 10 min, and then washed with ultrapure water. The nanoporous silver structure was prepared by cyclic voltammetry (CV) as in previous methods.63 The silver wires were immersed into 0.1 M HCl electrolyte for CV scanning from −0.2 V to +0.2 V at a rate of 25 mV s−1 for 15 cycles. The morphology of the prepared nanoporous layer was characterized by a scanning electron microscope (JEOL JSM-6700F), and the component was confirmed by EDS equipment (Oxford Instruments). The surface topography of the nanoporous layer was imaged by atomic force microscopy (Multimode, Veeco Instruments & Bruker); the crystallinity was also determined by X-ray diffraction (XRD) using a Bruker D8 Advance X-ray diffractometer.Extraction and SERS analysis
The SPME procedure was performed by immersing the nanoporous Ag fibers into 20 mL of extraction solution for 60 min without stirring at 25 °C. After that, the SPME fibers were then directly introduced for SERS analysis. The Raman spectra were performed on an Ocean Optics QE Pro Raman Spectrometer with an excitation wavelength of 785 nm, laser power of 100 mW and integration time of 1 s. The influence of extraction temperature and static placing time on the extraction effect were optimized. The kinetic parameter was determined from time curves of equilibrium at different concentrations. Thermodynamic information was also obtained from the adsorption isotherm at different temperatures. The analytes were qualitatively identified through the molecular fingerprint peaks of SERS. Under the optimum conditions, a quantitative determination was established through the relationship between the concentration and the intensity of the most sensitive characteristic peak.Validation in a textile matrix
The spiked sample was prepared by the following steps. 1.0 g of three types of textile (cotton, polyester, cotton/polyester blend, cut into pieces less than 5 mm × 5 mm) and 20.0 mL of standard working solutions of TMT, TBT and TPT were added into a 25.0 mL glass flask, separately. The textile samples were mixed thoroughly for 24 h to reach equilibration under stirring. After that, the solvent was removed by rotary evaporation, and the remaining textile samples were used for the extraction.23 1.0 g of spiked textile samples were added into 50.0 mL of methanol, and treated by ultrasonic extraction with water cooling for 60 min. Then, the mixture was filtrated, and 50.0 μL of filtrate was diluted with water to reach a final volume of 20.0 mL. These solutions were used for SPME-SERS analysis. ICP-MS (ThermoFisher Element XR) was also employed to validate the results for those target analytes.Statistical analysis
Principal component analysis (PCA) is a statistical procedure that uses an orthogonal transformation to convert a set of observations of possibly correlated variables into a set of values of linearly uncorrelated variables. PCA can reduce the dimensionality of the spectroscopic data, thus facilitating the discrimination of SERS spectra. In particular, isomers with very similar SERS bands can be effectively identified through a PCA procedure performed on their spectra.65,66 This was employed to discriminate TMT, TBT and TPT based upon their SERS spectral data. The spectra were firstly pre-treated by smoothing and baseline subtraction using the software LabSpec5 to improve the spectral quality. Then the spectra were input into the PCA procedure and compiled with MATLAB R2014a.Results and discussion
Fabrication and characterization of the porous Ag fiber
The nanoporous Ag layer on the fiber was synthesized with electrochemical assistance by CV scanning from −0.2 V to 0.2 V at 25 mV s−1 for 15 cycles in 0.1 M HCl electrolyte. The electrochemical response of the Ag wire is shown in Fig. S1.† The current (I) and capacitance (Q) of the Ag wire electrode increased as the scanning progressed. The oxidation peak can be observed at approximately 0.185 V in the anodic scan region, and the opposite redeposition peak was observed at −0.095 V in the cathodic region (I–E curve). After 15 cycles, the value of Qs (the charge summit) reached its maximum. This suggests that the local dissolution/redeposition equilibrium occurs on the Ag surface, and the effective surface area of Ag electrode reaches a maximum (Fig. S1B†). The morphology and components of the prepared nanoporous layer were characterized by SEM and XRD analysis. Fig. 1A shows that the Ag fiber was covered with coralline nanoparticles, whose diameter is about 100–150 nm. These aggregated nanoparticles form the unconsolidated porous structure. The structure of the nanoparticles was characterized by XRD, and Fig. 1B shows that the main diffraction peaks were assigned to the (110), (220) and (311) of cubic phase Ag (standard card JCPDS no. 04-0783), which demonstrates that the silver nanoparticles have good crystallinity. The EDS spectrum also confirms that the porous layer consists mainly of elemental Ag (Fig. S2†). The surface topography of the nanoporous layer was characterized by AFM, as illustrated in Fig. 2. A 10 μm × 10 μm area was imaged by 2D and 3D patterns, and the size distribution and RMS roughness were measured by particle and section analysis. The results give a mean diameter of about 150 nm and an RMS of 69.3 nm, which demonstrate that the nanoporous layer was successfully synthesized by the electrochemical method.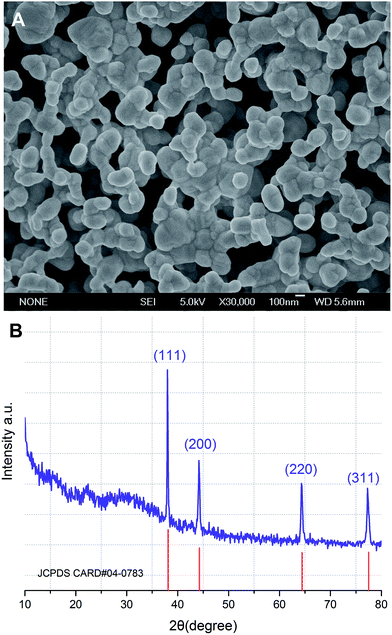 | ||
| Fig. 1 (A) SEM image of porous layer on Ag fiber surface, (B) XRD pattern of porous Ag fiber compared with the standard JCPDS card no. 04-0783. | ||
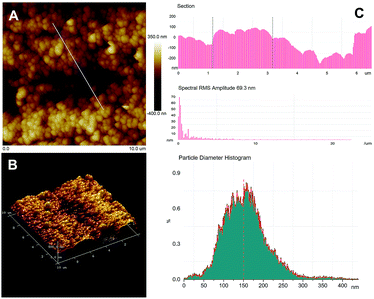 | ||
| Fig. 2 The topographic map of porous layer Ag by AFM. (A) 2D pattern of 10 μm × 10 μm area, (B) 3D pattern, (C) the histogram of section-view, RMS roughness and particle size. | ||
SERS performance of OTCs on porous Ag fiber
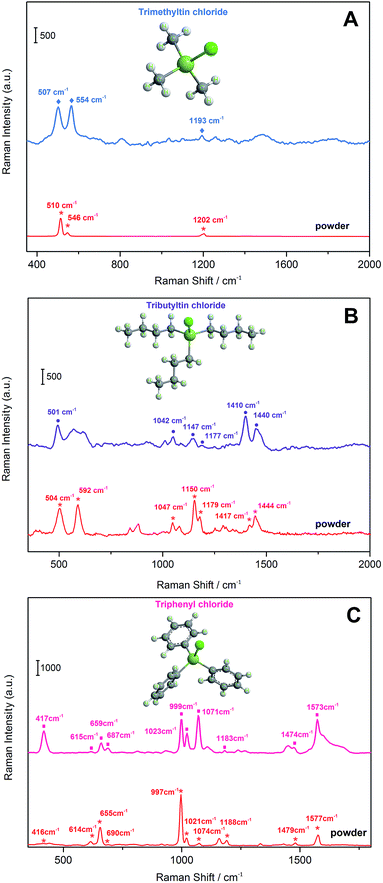
To evaluate the capacity of this SERS-active porous Ag fiber for extraction, the fibers were immersed in a working solution of 10.0 μM of TMT, 1.0 μM of TBT and 1.0 μM of TPhT for 60 min at 25 °C, respectively. After extraction, SERS spectra were measured, as shown in Fig. 3. Fig. 3A shows the SERS spectrum of TMT on porous Ag substrate in the region from 400 cm−1 to 1800 cm−1. The SERS bands at 507 cm−1, 554 cm−1 and 1193 cm−1 can be clearly identified, which is consistent with the Raman bands of TBT solid powder at 510 cm−1, 546 cm−1 and 1205 cm−1.67 For TBT in Fig. 3B, six obvious characteristic bands at 501 cm−1, 1042 cm−1, 1147 cm−1, 1177 cm−1, 1410 cm−1, and 1440 cm−1 were identified, and the corresponding Raman bands of solid powder were at 504 cm−1, 1047 cm−1, 1150 cm−1, 1179 cm−1, 1417 cm−1, and 1444 cm−1.68–70 The characteristic SERS bands of TPhT appear at 417 cm−1, 615 cm−1, 659 cm−1, 687 cm−1, 999 cm−1, 1023 cm−1, 1071 cm−1, 1183 cm−1, 1474 cm−1, and 1573 cm−1, which agrees well with the Raman spectrum of the solid powder (Fig. 3C).71,72 The assignment of the vibrational bands is shown in Table S1.† The characteristic SERS bands at 554 cm−1 (TMT), 1410 cm−1 (TBT) and 999 cm−1 (TPhT) were assigned to the νas(Sn–C), νas(C–C) and νs–as(phenyl ring breathing), respectively. These results indicate that organotin could be extracted and detected simultaneously on the surface of porous Ag fibers using SERS spectra.The rate of dissolution/redeposition was mainly determined by the scan rate in the electrochemical redox reaction. The increase in scan rate would produce a high over-potential on the electrode surface, which can speed the electron transport between the Ag electrode and the electrolyte solution.73 The SERS enhancement response of porous Ag substrate under different scan rates was investigated in TMT, TBT and TPhT solutions, respectively. Fig. S3† shows that the SERS intensity increases as the scan rate ranges from 5 mV s−1 to 100 mV s−1. The characteristic SERS bands (TMT 554 cm−1, TBT 1410 cm−1 and TPhT 999 cm−1) reach a maximum at 25 mV s−1. The enhancement factor was also calculated for different substrates according to the characteristic SERS intensity. The variation in enhancement effect can be attributed to the density of local hotspots and uniformity on SERS-active substrate (Fig. S4†). The SEM images of different porous Ag layers show that the particle size decreases as the scan rate increases, so the aggregation from small particles can supply more hotspots for a large enhancement of the Raman signal. On other hand, when a high scan rate (75 mV s−1) was implemented, the electrode reaction would be mainly controlled by the diffusion step; rapid electron transport would result in cavitation damage in local places; and the uniformity of the porous layer would become worse. Consequently, 25 mV s−1 was selected in the following experiments for strong SERS enhancement.
Stability, uniformity and reproducibility
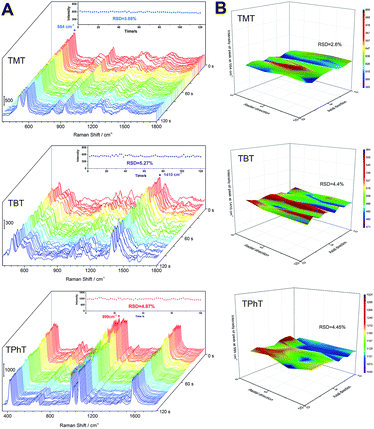
The stability, uniformity and reproducibility are crucial properties of a SERS-active substrate, which insure the accuracy and precision of signals in quantitative detection. Firstly, the stability of the fiber under laser irradiation was evaluated. SERS spectra of OTCs were continuously measured for 120 s (sampling interval 2 s) with a laser power of 100 mW. As shown in Fig. 4A, there is no obvious change in SERS intensity under 120 s of continuous irradiation. The RSD of characteristic SERS band intensity changes at 554 cm−1 (TMT), 1410 cm−1 (TBT) and 999 cm−1 (TPhT) were 3.05%, 5.27% and 4.87%, which indicates an acceptable stability for routine SERS analysis.Secondly, the uniformity was investigated by measuring Raman spectra along the axial and radial directions on the Ag fiber surface, with sampling intervals of 3.0 mm and 0.3 mm, respectively. The number of sampling points for each substrate was 40 sites. The characteristic band intensities of TMT, TBT and TPhT were selected for mapping in a 3D pattern, as illustrated in Fig. 4B. The RSDs of the SERS band intensity were 2.6% (TMT), 4.4% (TBT) and 4.45% (TPhT), suggesting the good uniformity of the substrate.
The reproducibility of porous Ag fibers was also evaluated by comparing the SERS spectra after extraction and elution. Firstly, the extraction was performed in solution for 100 min to reach equilibrium. After SERS measurement, the porous Ag fibers were desorbed by ultrasonic cleaning for 1 min in methanol, and the SERS spectrum of the blank fibers was finally recorded, as shown in Fig. S5.† The fibers have good reproducibility in six cycles. The RSDs of the characteristic band intensities were 5.5% (TMT), 4.6% (TBT) and 2.6% (TPhT).
Optimization of extraction
The optimization of the extraction temperature was evaluated. The influence of temperature on extraction was investigated. As shown in Fig. S6,† the intensity of the characteristic band decreased as the temperature increased from 25 °C to 60 °C. Traditionally, the adsorption of a molecule on a solid surface is generally an exothermic process. To gather more information, the adsorption was determined at different temperatures. As shown in Fig. S7,† the isotherm curve closely approximated to type I. On the other hand, according to the fitted results, the isotherm curve agrees well with the Langmuir adsorption formula in aqueous solution.74
 | (1) |
 | (2) |
When 1/w is plotted versus 1/Ca, the ke can be calculated from the intercept and slope. The SERS intensity was explained by the following formula:75
| ISERS ∝ NIL|A(νL)|2|A(νS)|2σRads |
| ISERS ∝ w |
In consequence, the SERS intensity is proportional to the surface adsorption quantity in the Langmuir adsorption model. According to the plot of 1/ISERS versus 1/Ca, the ke was calculated from the intercept and slope and listed in Table S2.† The adsorption equilibrium constant decreases as the extraction temperature rises, which demonstrates that the adsorption of OTCs on the porous Ag surface is generally an exothermic process.
The effect of extraction time on detection was investigated, and the kinetic curves for different concentrations of TMT, TBT and TPhT were determined. As shown in Fig. S8,† the saturated adsorption times were 60 min and 40 min for low and high concentrations, respectively. The lower the concentration of the sample, the longer the time required to reach adsorption equilibrium. Hence, an extraction time of 60 min was selected to ensure that the adsorption of porous Ag fibers reaches equilibrium. Under the optimal conditions, saturated adsorption curves were determined by immersing the porous Ag fibers into solutions of TMT (10.0 μmol L−1 to 10 nmol L−1), TBT (1.0 μmol L−1 to 0.1 nmol L−1) and TPhT (1.0 μmol L−1 to 0.05 nmol L−1), respectively. The SERS spectra and adsorption curves (the intensity of characteristic band vs. the solution concentration) are shown in Fig. S9.† The Raman intensity of the characteristic band was saturated at higher concentrations. This could be attributed to the saturation adsorption of molecules on surface hotspots.
Quantitative detection of OTCs in a textile matrix
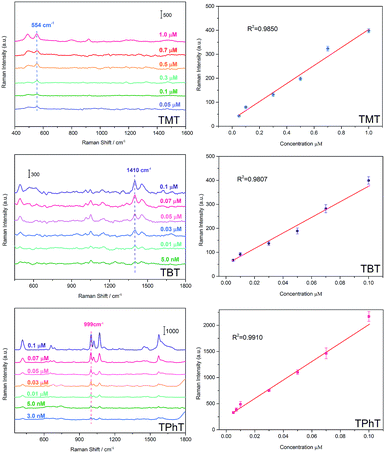
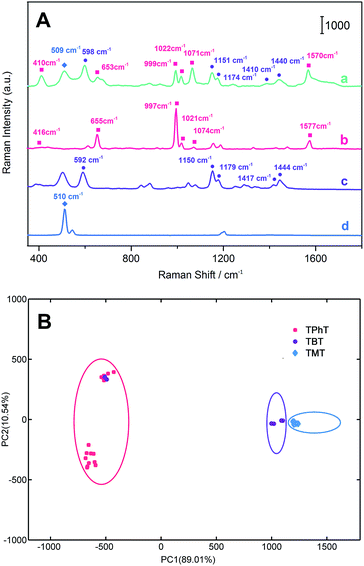
The quantitative detection of TMT, TBT and TPhT in a textile matrix was performed as in the above described steps. The textile sample was spiked and pre-extracted in methanol. Then the mixture was filtrated, and the filtrate was diluted with water to prepare the solution for SPME-SERS analysis. Fig. 5 shows the Raman intensity of TMT at 554 cm−1, which increases linearly with the concentration ranging from 1.0 μmol L−1 to 0.05 μmol L−1. The correlation coefficient (R2) was 0.9850, and the limit of detection (LOD) was 6.9 ppb. The linear relationship of TBT at 1410 cm−1 ranges from 0.1 μmol L−1 to 5.0 nmol L−1. The R2 was 0.9807, and the LOD was 1.1 ppb. Meanwhile, the linear relationship of TPhT at 999 cm−1 ranges from 0.1 μmol L−1 to 3.0 nmol L−1. The R2 was 0. 9910, and the LOD was low at 0.2 ppb.To evaluate the capacity of porous Ag fibers to identify complex organotin in a textile sample, the sample was spiked with TMT (1.0 μmol L−1), TBT (0.1 μmol L−1) and TPhT (30.0 nmol L−1) simultaneously. The extraction was performed at 25 °C for 60 min. As shown in Fig. 6, the SERS spectra of OTC mixtures indicate that the characteristic bands at 410 cm−1, 653 cm−1, 999 cm−1, 1022 cm−1, 1071 cm−1, and 1570 cm−1 (the rose red squares) are assigned to the characteristic bands of triphenyltin chloride; the bands at 598 cm−1, 1151 cm−1, 1174 cm−1, 1410 cm−1 and 1440 cm−1 (the purple dots) are assigned to the characteristic bands of tributyltin chloride; the band at 509 cm−1 (the blue diamonds) is identified as the characteristic band of trimethyltin chloride. Compared with the SERS spectra of single organotin (Fig. 3), the νs(Sn–Cl) and ν(Sn–C) bands of TPhT in the mixtures shift negatively from 417 cm−1 and 659 cm−1 to 410 cm−1 and 653 cm−1, respectively. The δ(CH3) bands of TBT shift positively from 1147 cm−1 to 1151 cm−1, and a clear ν(Sn–C) band appears at 598 cm−1. The νs(Sn–C) band of TMT shifts positively from 507 cm−1 to 509 cm−1, and the νas(Sn–C) band at 554 cm−1 disappears. The change in peaks in the low wavenumber region may be attributed to the vibronic coupling of the Sn–C band. The co-attachment of OTC molecules can induce emission band overlap and shows significant intermolecular communication between these moieties.76,77 These results indicate that the mixtures of OTCs had been extracted and detected by porous Ag fibers. The PCA results also reveal that the TMT, TBT and TPhT can be clearly discriminated by the analysis of SERS characteristic bands in Fig. 6B. Finally, the conventional ICP-MS method was also employed to validate the results for those target analytes that are listed in Table S3† for comparison.
Conclusions
In conclusion, the SERS-active porous Ag layer was electrochemically synthesized and fabricated as an SPME fiber for rapid determination of OTCs in a textile matrix. The SERS responses of TMT, TBT and TPhT on porous Ag fibers were investigated, and the extraction conditions were optimized. The isotherm revealed that the adsorption of OTCs on porous Ag fibers agreed well with the Langmuir type in aqueous solution. The variation of ke with temperature suggests a spontaneous exothermic process. The good stability and uniformity insure the accuracy and precision of signals in quantitative detection. The high enhancement factors of 1.36 × 10⁵, 9.0 × 10⁵ and 9.1 × 10⁵, and then the low LODs of 6.9 ppb, 1.1 ppb and 0.2 ppb were obtained for TMT, TBT and TPhT, respectively. The SPME-SERS method combines the advantages of pre-concentration and high sensitivity, which promote the potential for rapid screening of OTCs in consumer product safety of import & export trading.Acknowledgements
We are grateful for financial support from National Basic Research Program of China (973 Program 2013CB934301) and National Natural Science Foundation of China (NSFC21377068, 21575077). Weiwei Bian acknowledges financial support from Shandong Provincial Natural Science Foundation (ZR2015BL020). Le Wang acknowledges support from general administration of Quality Supervision, Inspection and Quarantine of the People's Republic of China (2015IK212), the National Major Research Program of China (2016YFF0203704).Notes and references
- A. C. A. Sousa, M. R. Pastorinho, S. Takahashi and S. Tanabe, Environ. Chem. Lett., 2014, 12, 117–137 CrossRef CAS.
- B. Julius and D. Zdenek, Curr. Drug Metab., 2011, 12, 71–88 CrossRef.
- J. Brtko, Biomed. Pap., 2007, 151, 187–194 CrossRef CAS.
- F. Grun and B. Blumberg, Rev. Endocr. Metab. Disord., 2007, 8, 161–171 CrossRef PubMed.
- J. Brtko and Z. Dvorak, Toxicol. Lett., 2015, 234, 50–58 CrossRef CAS PubMed.
- A. Giusti and C. Joaquim-Justo, Comp. Biochem. Physiol., Part C: Toxicol. Pharmacol., 2013, 158, 187–198 CrossRef CAS PubMed.
- Survey of chemical substances in consumer products, No. 90, 2008, http://www2.mst.dk/udgiv/publications/2008/978-87-7052-717-0/pdf/978-87-7052-718-7.pdf, accessed March 2008.
- Toxic chemicals in a child's world: an investigation into PVC plastic products, http://www.greenpeace.org/international/Global/international/planet-2/report/2001/5/toxic-chemicals-in-a-child-s-w.pdf, accessed June 2001..
- Health risk assessment for organotins in textiles, http://rivm.openrepository.com/rivm/bitstream/10029/9609/1/613350002.pdf, accessed March 2000.
- A. Pagliarani, S. Nesci and V. Ventrella, Toxicol. in Vitro, 2013, 27, 978–990 CrossRef CAS PubMed.
- REACH, Annex XVII in Decision 2009/425/EC of the European Parliament and of the Council, Official Journal of the European Union, 2009 Search PubMed.
- A. Valenzuela, G. Lespes, W. Quiroz, L. F. Aguilar and M. A. Bravo, Talanta, 2014, 125, 196–203 CrossRef CAS PubMed.
- W. Gui, C. Tian, Q. Sun, S. Li, W. Zhang, J. Tang and G. Zhu, Water Res., 2016, 95, 185–194 CrossRef CAS PubMed.
- S. Jing, B. He, Y. G. Yin, L. Lu and G. B. Jiang, Anal. Methods, 2010, 2, 2025–2031 RSC.
- G. D. Yang, J. H. Xu, L. J. Xu, G. N. Chen and F. F. Fu, Talanta, 2010, 80, 1913–1918 CrossRef CAS PubMed.
- Y. Niu, F. Han, Q. Zhang, T. Xie, L. Lu, S. Li and H. Xia, Angew. Chem., Int. Ed., 2013, 52, 5599–5603 CrossRef CAS PubMed.
- S. H. Li, F. R. Chen, Y. F. Zhou, J. N. Wang, H. Zhang and J. G. Xu, Chem. Commun., 2009, 28, 4179–4181 RSC.
- Y. F. Zhou, J. N. Wang, S. H. Li and J. G. Xu, Analyst, 2010, 136, 282–284 RSC.
- L. Průša, J. Dědina and J. Kratzer, Anal. Chim. Acta, 2013, 804, 50–58 CrossRef PubMed.
- R. F. Cole, G. A. Mills, R. Parker, T. Bolam, A. Birchenough, S. Kröger and G. R. Fones, Trends Environ. Anal. Chem., 2015, 8, 1–11 CrossRef CAS.
- J. Richter, I. Fettig, R. Philipp, N. Jakubowski, U. Panne, P. Fisicaro and E. Alasonati, J. Chromatogr. A, 2016, 1459, 112–119 CrossRef CAS PubMed.
- N. Campillo, P. Viñas, R. Peñalver, J. I. Cacho and M. Hernández-Córdoba, J. Food Compos. Anal., 2012, 25, 66–73 CrossRef CAS.
- L. Zhang, X. Luo, Z. Niu, X. Ye, Z. Tang and P. Yao, J. Chromatogr. A, 2015, 1386, 22–30 CrossRef CAS PubMed.
- Methodology for recommending analytical methods to check compliance with REACH Annex XVII restrictions, http://https://www.echa.europa.eu/documents/10162/13577/methodology_analytical_methods_en.pdf, accessed March 2016 Search PubMed.
- J. R. Dean, Pre-concentration and Clean-up Procedures for Organic Sample Extracts, John Wiley & Sons, Ltd, 2013 Search PubMed.
- C. Moscoso-Pérez, V. Fernández-González, J. Moreda-Piñeiro, P. López-Mahía, S. Muniategui-Lorenzo and D. Prada-Rodríguez, J. Chromatogr. A, 2015, 1385, 85–93 CrossRef PubMed.
- S. Noventa, J. Barbaro, M. Formalewicz, C. Gion, F. Rampazzo, R. B. Brusà, M. Gabellini and D. Berto, Anal. Chim. Acta, 2015, 858, 66–73 CrossRef CAS PubMed.
- B. M. Manuel, V. S. Aníbal, F. P. Edwar and Q. V. Waldo, J. Chromatogr. A, 2012, 1223, 9–14 CrossRef PubMed.
- G. Ouyang and J. Pawliszyn, Principle and Application of Solid Phase Microextraction, Chemical Industry Press, Beijing, 2012 Search PubMed.
- P. Liu and G. Chen, Porous Materials: Processing and Applications, Butterworth-Heinemann, Oxford, 2014 Search PubMed.
- J. G. Hou, Q. Ma, X. Z. Du, H. L. Deng and J. Z. Gao, Talanta, 2004, 62, 241–246 CrossRef CAS PubMed.
- F. Zhu, J. Guo, Z. Feng, R. Fu, D. Wu, T. Luan, Y. Tong, T. Lu and G. Ouyang, J. Chromatogr. A, 2010, 1217, 7848–7854 CrossRef CAS PubMed.
- Y. Lin, L. Wu, K. Xu, Y. Tian, X. Hou and C. Zheng, Chem.–Eur. J., 2015, 21, 13618–13624 CrossRef CAS PubMed.
- E. Turiel and A. Martín-Esteban, Anal. Chim. Acta, 2010, 668, 87–99 CrossRef CAS PubMed.
- M. Szultkamlynska, P. Olszowy and B. Buszewski, Crit. Rev. Anal. Chem., 2015, 2012, 3955–3958 Search PubMed.
- X. Y. Cui, Z. Y. Gu, D. Q. Jiang, Y. Li, H. F. Wang and X. P. Yan, Anal. Chem., 2009, 81, 9771–9777 CrossRef CAS PubMed.
- N. Chang, Z. Y. Gu, H. F. Wang and X. P. Yan, Anal. Chem., 2011, 83, 7094–7101 CrossRef CAS PubMed.
- H. L. Xu, Y. Li, D. Q. Jiang and X. P. Yan, Anal. Chem., 2009, 81, 4971–4977 CrossRef CAS PubMed.
- S. Sungkaew, C. Thammakhet, P. Thavarungkul and P. Kanatharana, Anal. Chim. Acta, 2010, 664, 49–55 CrossRef CAS PubMed.
- A. M. Hafez and B. W. Wenclawiak, Anal. Bioanal. Chem., 2013, 405, 1753–1758 CrossRef CAS PubMed.
- Y. X. Yang, M. Guo, Y. D. Zhang, W. L. Song, Y. Li, X. M. Wang and X. Z. Du, RSC Adv., 2015, 5, 71859–71867 RSC.
- C. Liu, X. Zhang, L. Li, J. Cui, Y.-e. Shi, L. Wang and J. Zhan, Analyst, 2015, 140, 4668–4675 RSC.
- S. Zhu, X. Zhang, J. Cui, Y.-e. Shi, X. Jiang, Z. Liu and J. Zhan, Analyst, 2015, 140, 2815–2822 RSC.
- J. Wang, L. Yang, B. Liu, H. Jiang, R. Liu, J. Yang, G. Han, Q. Mei and Z. Zhang, Anal. Chem., 2014, 86, 3338–3345 CrossRef CAS PubMed.
- Y.-e. Shi, W. Wang and J. Zhan, Nano Res., 2016, 9, 2487–2497 CrossRef CAS.
- J. Chen, Y. Huang, P. Kannan, L. Zhang, Z. Lin, J. Zhang, T. Chen and L. Guo, Anal. Chem., 2016, 88, 2149–2155 CrossRef CAS PubMed.
- B. Liu, G. Han, Z. Zhang, R. Liu, C. Jiang, S. Wang and M.-Y. Han, Anal. Chem., 2012, 84, 255–261 CrossRef CAS PubMed.
- M. Leona, P. Decuzzi, T. A. Kubic, G. Gates and J. R. Lombardi, Anal. Chem., 2011, 83, 3990–3993 CrossRef CAS PubMed.
- A. Cesaratto, M. Leona, J. R. Lombardi, D. Comelli, A. Nevin and P. Londero, Angew. Chem., Int. Ed. Engl., 2014, 53, 14373–14377 CrossRef CAS PubMed.
- H. Tang, G. Meng, Q. Huang, Z. Zhang, Z. Huang and C. Zhu, Adv. Funct. Mater., 2012, 22, 218–224 CrossRef CAS.
- L. Guerrini, J. V. Garciaramos, C. Domingo and S. Sanchezcortes, Anal. Chem., 2009, 81, 953–960 CrossRef CAS PubMed.
- X. Jiang, Y. Lai, W. Wang, J. Wei and J. Zhan, Talanta, 2013, 116, 14–17 CrossRef CAS PubMed.
- B. Liu, G. Han, Z. Zhang, R. Liu, C. Jiang, S. Wang and M. Y. Han, Anal. Chem., 2012, 84, 255–261 CrossRef CAS PubMed.
- J. Kubackova, G. Fabriciova, P. Miskovsky, D. Jancura and S. Sanchez-Cortes, Anal. Chem., 2015, 87, 663–669 CrossRef CAS PubMed.
- S. Pang, T. Yang and L. He, TrAC, Trends Anal. Chem., 2016, 85, 73–82 CrossRef CAS.
- K. Kim, K. L. Kim and K. S. Shin, Analyst, 2012, 137, 3836–3840 RSC.
- C. Ruan, W. Wang and B. Gu, Anal. Chim. Acta, 2006, 567, 114–120 CrossRef CAS PubMed.
- R. A. Alvarez-Puebla and L. M. Liz-Marzán, Angew. Chem., Int. Ed., 2012, 51, 11214–11223 CrossRef CAS PubMed.
- S. Schlucker and W. Kiefer, Surface Enhanced Raman Spectroscopy: Analytical, Biophysical and Life Science Applications, Wiley-VCH, Weinheim, 2011 Search PubMed.
- E. C. L. Ru and P. G. Etchegoin, Principles of surface-enhanced Raman spectroscopy and related plasmonic effects, Elsevier, 2009 Search PubMed.
- B. Yan, A. Thubagere, W. R. Premasiri, L. D. Ziegler, N. L. Dal and B. M. Reinhard, ACS Nano, 2009, 3, 1190–1202 CrossRef CAS PubMed.
- J. Taylor, A. Huefner, L. Li, J. Wingfield and S. Mahajan, Analyst, 2016, 141, 5037–5055 RSC.
- K.-H. Yang, Y.-C. Liu and C.-C. Yu, J. Mater. Chem., 2008, 18, 4849–4855 RSC.
- M. E. Abdelsalam, P. N. Bartlett, J. J. Baumberg, S. Cintra, T. A. Kelf and A. E. Russell, Electrochem. Commun., 2005, 7, 740–744 CrossRef CAS.
- A. R. Campos, Z. Gao, M. G. Blaber, R. Huang, G. C. Schatz, R. P. Van Duyne and C. L. Haynes, J. Phys. Chem. C, 2016, 120, 20961–20969 CAS.
- A. Kaminska, E. Witkowska, A. Kowalska, A. Skoczynska, P. Ronkiewicz, T. Szymborski and J. Waluk, Anal. Methods, 2016, 8, 4521–4529 RSC.
- P. Chaudhary, M. Bieringer, P. Hazendonk and M. Gerken, Dalton Trans., 2015, 44, 19651–19658 RSC.
- R. A. Cummins, Aust. J. Chem., 1963, 16, 985–988 CrossRef CAS.
- A. Szorcsik, L. Nagy, K. Gajda-Schrantz, L. Pellerito, E. Nagy and F. T. Edelmann, J. Radioanal. Nucl. Chem., 2002, 252, 523–530 CrossRef CAS.
- J. Wiss and A. Zilian, Org. Process Res. Dev., 2003, 7, 1059–1066 CrossRef CAS.
- S. Ramalingam, S. Periandy and S. Mohan, Spectrochim. Acta, Part A, 2010, 77, 73–81 CrossRef CAS PubMed.
- J. Jiang, J.-M. Gao, J.-S. Guo, Q.-H. Zhou, X.-H. Liu, W.-J. Ouyang, P. Zhang, W.-L. Fu, W. Zhang and S.-X. He, Chemosphere, 2016, 161, 96–103 CrossRef CAS PubMed.
- A. J. Bard and L. R. Faulkner, Electrochemical Methods: Fundamentals and Applications, Wiley-VCH, New York, 2nd edn, 2001 Search PubMed.
- S. Kondo, T. Ishikawa, I. Abe and G. Li, Adsorption Science, Chemical Industry Press, Beijing, 2nd edn, 2006 Search PubMed.
- K. Kneipp, H. Kneipp, I. Itzkan, R. R. Dasari and M. S. Feld, Chem. Rev., 1999, 99, 2957–2976 CrossRef CAS PubMed.
- J. R. Lombardi, R. L. Birke and G. Haran, J. Phys. Chem. C, 2011, 115, 4540–4545 CAS.
- J. Cabalo, J. A. Guicheteau and S. Christesen, J. Phys. Chem. A, 2013, 117, 9028–9038 CrossRef CAS PubMed.
Footnote |
| † Electronic supplementary information (ESI) available. See DOI: 10.1039/c6ra25491h |
| This journal is © The Royal Society of Chemistry 2017 |

