 Open Access Article
Creative Commons Attribution 3.0 Unported Licence
Thermomechanical analysis of picograms of polymers using a suspended microchannel cantilever†
Syed Asad Manzoor Bukhari,
M. Faheem Khan ,
Ankur Goswami
 *,
Ryan McGee
 and
Thomas Thundat*
Department of Chemical and Materials Engineering, University of Alberta, T6G 2R3, Edmonton, Canada. E-mail: agoswami@ualberta.ca; thundat@ualberta.ca
First published on 24th January 2017
Abstract
Microchannel cantilevers are an emerging platform for physical characterization of materials at the picogram level. Here we report on detecting multiple thermal transitions in picogram amounts of two well-known polymers, semicrystalline poly(L-lactide) (PLA) and amorphous poly(methylmethacrylate) (PMMA), using this platform. The polymer samples, when loaded inside the cantilever, affect its resonance frequency due to changes in its total mass and stiffness. When taken through a thermal cycle, the resonance response of the cantilever further changes due to multiple thermal transitions of the samples. Continuous monitoring of the resonance frequency provides information about β-transition (Tβ), glass transition (Tg), crystallization (Tc), and melting (Tm) of the confined polymer samples. The measured Tg, Tc, and Tm for PLA were ∼60, 78, and 154 °C, respectively, while the Tg and Tβ for PMMA were 48 and 100 °C, respectively. These results are in an agreement with the data obtained from differential scanning calorimetry (DSC). Because of its high sensitivity, this technique is capable of detecting the weaker β-transitions that cannot be observed with conventional DSC.
1. Introduction
Polymers are versatile materials with well-established applications in the pharmaceutical,1 manufacturing,2 chemical,3 microelectronics4 and food industries.5 Recently, various researchers have reported the use of nanoscale amounts of polymers for applications such as non-volatile memory,6 energy storage,7 and biomimetics.8 Such applications require highly precise measurements of stability, durability, and purity of a polymer. Most of these characteristics can be investigated using thermal properties of polymers such as glass transition (Tg), crystallization (Tc), enthalpy relaxation, and melting (Tm).6–9 In addition to these well-known transitions, certain polymers may also exhibit a β-relaxation/transition, which is due to localized movements in the main chain or the movement of a very large side chain.10 For large scale applications, most of these transitions can be probed with conventional techniques such as differential scanning calorimetry (DSC),11–13 dynamic mechanical analysis (DMA),14 thermomechanical analysis (dilatometry),15 and dielectric spectroscopy (DES).16 Although well established, these techniques are unsuitable for characterization of sub microgram levels of polymers due to the restrictions on the sample size (∼5–10 mg) and dimensions. Therefore, there is an emerging need to develop techniques capable of characterizing materials at the nanoscale. In order to fulfill this requirement, various sensors have been proposed to measure the thermal and mechanical properties of polymers at sub microgram levels. Microscale resonators is one such platform, which offers advantages such as; no shape dependence, high sensitivity, very small sample mass (nano to microgram), wide dynamic range of measurement, and faster operation.17–20 Micro resonators, such as microstrings and microcantilevers, have been previously employed for thermal analysis (of small masses) of polymers.17,18,21,22 Both of these techniques require special spray coating or ink jet printing to deposit nanograms of sample.23 Another challenge (when using microstrings or microcantilevers) is sublimation of the sample during heating. In order to overcome these difficulties, we have developed a microchannel cantilever consisting of microfluidic channel integrated on top of the cantilever. With the volume of the microchannel ∼50 pL, the resonance frequency of the cantilever is ∼150 kHz while its quality factor lies in the order of six to eight thousand. These values ensure high resolution in detecting any changes in the resonance frequency. Previously, this principle and the device have been successfully employed to detect sub attogram mass, and the density and viscosity of picoliters of confined liquids and thermal sensor for binary liquid mixture.24–27 Without any complicated protocols or equipment, the polymer samples can be loaded into the microchannel using melt infiltration. In order to detect thermal transitions, the polymer-filled cantilever is heated under high vacuum. Although the cantilever is operated at low pressure (∼5 × 10⁻⁶ mbar), the polymer is enclosed within the microchannel which keeps the sample at atmospheric pressure. The incorporation of this microchannel enables the measurement of all thermal transitions up to (and including) the melting point. As a result, multiple heating cycles can be used to probe the transitions of the material in order to study its reversibility/hysteresis. To test the cantilever systematically (as a platform for thermal analysis), two different polymers were chosen as a case study such as biodegradable, semi-crystalline poly (L-lactide) (PLA), and amorphous poly(methylmethacrylate) (PMMA). The aim of this study was to use a miniature, robust, and sensitive platform to obtain accurate information about the thermal events occurring in the polymers. Thermal characteristics such as Tg, Tc, Tm and Tβ are investigated and the results are compared to those obtained from conventional DSC.2. Experimental section
Poly(L-lactide) or PLA (Mn = 50![[thin space (1/6-em)]](https://www.rsc.org/images/entities/char_2009.gif) 000) and poly(methylmethacrylate) or PMMA (Mw = 120
000) and poly(methylmethacrylate) or PMMA (Mw = 120![[thin space (1/6-em)]](https://www.rsc.org/images/entities/char_2009.gif) 000) were used as test materials due to their well-known thermal transitions. The densities of the PLA and the PMMA samples used in all experiments are 1.3 g cm−3 and 1.2 g cm−3 respectively.28,29
000) were used as test materials due to their well-known thermal transitions. The densities of the PLA and the PMMA samples used in all experiments are 1.3 g cm−3 and 1.2 g cm−3 respectively.28,29
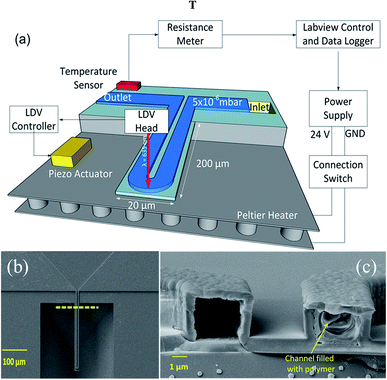
The microchannel cantilevers were fabricated using conventional top-down microfabrication techniques, as described in our previous study.21 The dimensions of the cantilevers were 200 μm (length) × 20 μm (width) × 3 μm (microchannel height) as shown in Fig. 1a. The calculated mass of the cantilevers were 14.6 pg (considering ρSi3N4 = 3.44 g cm−3). Prior to loading the polymer samples, each cantilever was cleaned with piranha (in order to remove organic contaminants) and heated on a hot plate at 200 °C for two hours to drive out any residual moisture. The cantilevers were filled with the polymer samples through a melt infiltration technique, where a small amount of the samples was placed on inlets (located on backside on the chip). The chips were heated on a hot plate to 150–170 °C. At the melting temperature, due to strong capillary forces, the polymer is able to flow inside the microchannel.
Fig. 1a shows a schematic of the microchannel cantilever based thermal analysis platform used in this study. In order to apply a controlled thermal cycle, the cantilever was firmly placed on top of a Peltier element, and the temperature was continuously monitored by a Pt-1000 resistance temperature detector (RTD) mounted on top of the chip. Temperature was logged in real time by monitoring the RTD's resistance using a Keithley 197 multimeter interfaced with LabView software. The cantilever was heated from room temperature to 180 °C at a heating rate of 4 °C min−1. In order to enhance the signal to noise ratio (SNR), the cantilever was mechanically excited by an external piezo actuator. The resonance frequency was measured optically using a laser Doppler vibrometer (LDV, Polytec, USA) and was monitored continuously during the experiments. As the polymer samples are viscous, a cantilever cannot be effectively flushed and be used for another sample. Therefore, to avoid cross contamination, two similar cantilevers were used to characterize the two polymer samples. Prior to loading each sample, the empty cantilevers were characterized to determine their resonance frequency and phase. In an effort to enhance the quality factor (and thus the sensitivity) of the cantilevers, all the experiments were carried out at a vacuum level of ∼10−6 mbar. SEM of the top view of the cantilever is shown in Fig. 1b. A cross sectional SEM view of the channel (showing a filled and an empty channel) is shown in Fig. 1c. For reference measurements, the polymers were characterized using DSC (TAQ100) with 5–7 mg of sample, with a heating rate of 10 °C min−1.
3. Results and discussion
Though the cantilever has a microchannel fabricated on the top, it follows the same dynamics of vibration as a plain cantilever. The fundamental resonance frequency, fc(T0), of the cantilever at temperature, T0, is given by eqn (1), where kc and mc are the cantilever's stiffness and mass respectively.30
 | (1) |
Filling the cantilever with a polymer changes the stiffness and the mass of the cantilever, causing a shift in its resonance frequency. If the polymer stiffness and mass are indicated as kp and mp, respectively then by assuming a parallel spring-mass model, the effective resonance frequency fc+p(T0) of the polymer-filled cantilever would follow eqn (2).
 | (2) |
In our case, since  , it is evident from eqn (1) and (2) that fc(T0) > fc+p(T0) (ESI†).
As compared to the structural material (silicon nitride) of the cantilever, the polymer exhibits a higher change in its stiffness due to heating. Therefore, as the temperature increases, the change in kp dominates over kc, due to significant changes in the elastic modulus of the polymer. Hence, by monitoring fc+p(T), the transitions of the polymer can be determined. From eqn (3) it is evident that kp can be determined by monitoring the resonance frequency of a cantilever before and after loading the polymer (ESI for detailed derivation†).
 | (3) |
 . In this case mc, mPLA, and mPMMA are calculated as 14.6, 6.24, and 2.8 pg respectively. Since the samples are confined inside the microchannel, there is no mass loss due to sublimation.
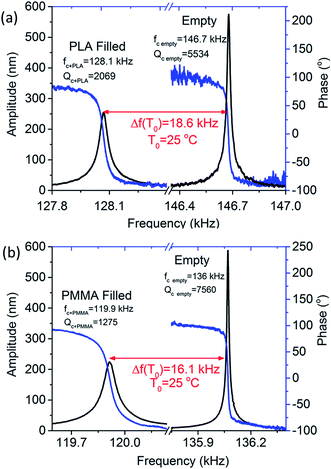
Cantilevers with similar mechanical properties were used in order to perform the thermal analyses of the polymers. Prior to loading the polymers, resonance frequency and phase response of the empty cantilevers were recorded (shown in Fig. 2a and b). The quality factor of the empty cantilevers was found to be ∼6000. However, after loading the polymers into the microchannel, the resonance frequency of the cantilevers decreased by 14–16 kHz and the quality factor reduced to ∼20% of their original values. These changes ensure that the polymer successfully entered the cantilever. Unlike a cantilever (placed inside a liquid), which experiences a large viscous damping, a microchannel cantilever loaded with a viscous polymer maintains a quality factor well above 1000.
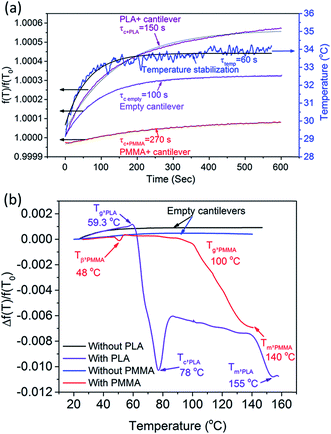
To accurately perform experiments, stability of the device temperature and its effect on the resonance frequency were first quantified by heating the cantilever in a stepwise manner while simultaneously recording the temperature and frequency response. A 4 °C step was applied to each cantilever and their corresponding temperature and frequency responses were recorded as shown in Fig. 3a. Temperature stability was achieved after ∼60 s. However, as shown in Fig. 3a, the resonance frequency of the cantilever is material dependant and show stabilization times of 100, 150, and 270 s for the empty (τc,empty), PLA (τc+PLA), and PMMA (τc+PMMA) filled cantilevers, respectively. Therefore, for subsequent measurements we have used 100, 180 and 300 s as stabilization times for the empty, PLA, and PMMA filled cantilevers respectively. The variation in time constant is directly related to the specific heat capacities of the cantilever material (SiN) and the polymers (PMMA and PLA) stored within. The trend in the observed time constants, τc,empty < τc+PLA < τc+PMMA, follows the samples' specific heat capacity as cp,SiN < cp,SiN+PLA < cp,SiN+PMMA.31,32
 | ||
| Fig. 3 (a) Stabilization in temperature and frequency measured for empty, PLA-filled, and PMMA-filled cantilevers. (b) Thermal characterization of empty, PLA-filled, and PMMA-filled cantilevers. | ||
The stabilization time for the resonance frequency of the cantilever (filled with PLA or PMMA) is much longer than 60 s. If a measurement is performed by achieving full stabilization (3τ) in the resonance frequency, each measurement would take multiple hours. In order to reduce the measurement time and maintain the detection of small transitions (such as Tβ), the cantilever was heated at the rate of 4 °C min−1. This heating rate and stabilization time enabled rapid measurement with sufficient sensitivity and resolution.
Temperature dependant resonance spectra of the empty and polymer-filled cantilevers were measured and plotted as shown in Fig. 3b. In the case of the empty cantilevers, the resonance frequency initially increases with temperature, but no significant changes occur at higher temperatures. This is in stark contrast to the results from the polymer-filled cantilevers, which show a significant reduction in the resonance frequency at specific temperatures, corresponding to various thermal transitions. It is evident that the polymers undergo thermal transitions with increasing temperature, which reduces the effective stiffness of the filled cantilever, resulting in a reduction in the resonance frequency of the cantilever.
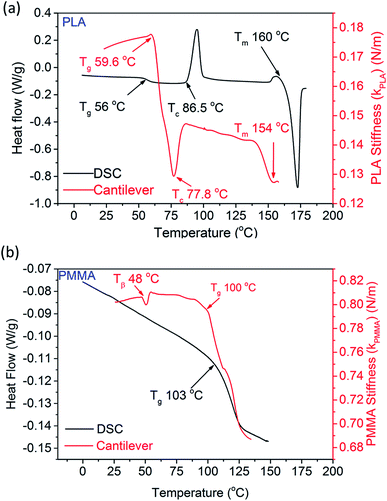
Further, the stiffness of the polymer inside the cantilever was determined using eqn (3) and plotted in Fig. 4a and b. Considering that the total mass (mp + mc) and the stiffness (kc) of the cantilever material (SiN) are constant, the stiffness of the polymer follows the same trend as that of the resonance frequency of the cantilever. For a comparison, Fig. 4a shows the stiffness of the PLA sample (extracted from the results of the cantilever), as well as the measurements carried out with DSC. The overall stiffness of the PLA-filled cantilever initially increases (up to 60 °C), which is most likely due to a release of stress (in the silicon nitride). At ∼60 °C, the stiffness of the cantilever decreases sharply which is the onset of Tg of PLA. Here the resonance frequency of the cantilever decreases by 60 Hz. The results from DSC indicate that the Tg of the sample lies within the same region. As the temperature is increased further, kPLA starts to increase at 78 °C, which indicates the onset of crystallization (Tc) of PLA. This can be explained as due to an increase in the elastic modulus of PLA during crystallization, which in turn increases the stiffness of the polymer. The Tc of the sample is also evident at ∼87 °C according to the data obtained from DSC. Melting point of the sample is determined by increasing the temperature in a continuous fashion. The onset of melting appears at ∼154 °C (compared to 160 °C obtained from DSC) as seen by a sharp decrease in kPLA. Upon melting, the viscosity of the sample decreases which explains the reduction in its stiffness.
 | ||
| Fig. 4 Heat flow (from DSC) and calculated stiffness of (a) PLA and (b) PMMA are plotted as functions of temperature. | ||
Fig. 4b shows the thermal transitions of PMMA, measured by the cantilever as well as DSC. As the cantilever is heated, the sample goes through a small but recoverable change in its stiffness (kPMMA) at 48 °C. Such a change is not visible in the data obtained using the DSC. This can be attributed to the β-transition of PMMA and can be explained as due to hindrance of the molecular motion of the –COOCH3 group (attached to the main chain C–C bond).33 Though this transition cannot be probed using DSC, it can be measured by DMA and DEA, as reported in literature.34,35 As the PMMA filled cantilever is further heated to ∼100 °C, a sharp reduction in kPMMA occurs, which is identified as the Tg of PMMA. Such a change is also observed in the DSC data at 103 °C. Any small discrepancies between the temperatures reported between these two techniques may be due to the method used to determine the temperature within the microchannel.
Overall, the thermal transitions of these two polymers measured by suspended microchannel cantilever are in excellent agreement with established techniques such as dilatometry, DMA, and DES as reported in literature as shown in Table 1.
| Transitions temperature (°C) | PMMA | PLA | ||||||||
|---|---|---|---|---|---|---|---|---|---|---|
| Dilatometer34 | DSC (measured and reported) | DMA34 | DES36,37 | Cantilever (measured) | Dilatometer38 | DSC (measured and reported) | DMA39 | DES40 | Cantilever (measured) | |
| Glass transition | 103 | 103 (ref. 41) | 106 | 100 (1 kHz) | 100 | 40 | 58 | 61 | 66 (1 kHz) | 60 |
| Crystallization | Usually does not exist | 85 | 86.5 | 85 (1 Hz) | 80 (1 kHz) | 78 | ||||
| β-Transition | Cannot be detected | Cannot be detected | 35–40 (1 Hz) | 20–50 (1 kHz) | 45–50 (120 kHz resonance frequency) | Cannot be detected | Cannot be detected | Not reported | −63 (1 kHz) | Not measured |
| Melting | Not reported | 150–170 | Not reported | Not reported | 140 | Not reported | 154 | Not reported | Not reported | 160 |
4. Conclusions
A suspended microchannel cantilever has been developed to use as a thermal analyzer of picogram amount of sample. Thermal transitions (Tβ, Tg, Tc and Tm) of picogram amounts of polymer samples were determined by monitoring the resonance response of the microchannel cantilever. The results show an excellent agreement with the data recorded by DSC and other established techniques reported in literature. With further optimization, the microchannel cantilever has the potential to be a precise and convenient tool for thermomechanical characterization of a plethora of different expensive sample types at nano to picoscale.Acknowledgements
This work was supported by the Canada Excellence Research Chair (CERC) program. Authors acknowledge Mr Priyesh Dhandaria for the useful discussions.References
- H. Park and K. Park, in Polymers of Biological and Biomedical Significance, American Chemical Society, 1993, ch. 1, vol. 540, pp. 2–15 Search PubMed.
- F. Hussain, M. Hojjati, M. Okamoto and R. E. Gorga, J. Compos. Mater., 2006, 40, 1511–1575 CrossRef CAS.
- J. Qiao, M. Guo, L. Wang, D. Liu, X. Zhang, L. Yu, W. Song and Y. Liu, Polym. Chem., 2011, 2, 1611–1623 RSC.
- G. Maier, Mater. Today, 2001, 4, 22–33 CrossRef CAS.
- A. Akelah, in Functionalized Polymeric Materials in Agriculture and the Food Industry, Springer, US, Boston, MA, 2013, pp. 195–248 Search PubMed.
- Z. Hu, M. Tian, B. Nysten and A. M. Jonas, Nat. Mater., 2009, 8, 62–67 CrossRef CAS PubMed.
- A. S. Arico, P. Bruce, B. Scrosati, J.-M. Tarascon and W. van Schalkwijk, Nat. Mater., 2005, 4, 366–377 CrossRef CAS PubMed.
- N. Gadegaard, S. Mosler and N. B. Larsen, Macromol. React. Eng., 2003, 288, 76–83 CrossRef CAS.
- B. Wunderlich, Thermal Analysis of Polymeric Materials, Springer, New York, 2005 Search PubMed.
- J. Heijboer, Int. J. Polym. Mater., 1977, 6, 11–37 CrossRef CAS.
- C. Schick, Anal. Bioanal. Chem., 2009, 395, 1589–1611 CrossRef CAS PubMed.
- B. Wunderlich, J. Therm. Anal., 1996, 46, 643–679 CrossRef CAS.
- D. V. Suriapparao, D. K. Ojha, T. Ray and R. Vinu, J. Therm. Anal. Calorim., 2014, 117, 1441–1451 CrossRef CAS.
- K. P. Menard, Dynamic Mechanical Analysis: A Practical Introduction, CRC Press, Boca Raton, 1999 Search PubMed.
- A. Y. Olkhov and B. Jurkowski, J. Therm. Anal. Calorim., 2005, 81, 489–500 CrossRef.
- A. Schönhals, Dielectric Spectroscopy on the Dynamics of Amorphous Polymeric Systems, Novocontrol, 1998 Search PubMed.
- Y. Changyong, Y. Minhyuk, K. Seonghwan, J. Namchul, L. Sang-Hoon, L. Moonchan, R. Shi-Woo, T. Thomas and J. Sangmin, Jpn. J. Appl. Phys., 2012, 51, 08KB07 CrossRef.
- S. Bose, S. Schmid, T. Larsen, S. S. Keller, P. Sommer-Larsen, A. Boisen and K. Almdal, ACS Macro Lett., 2014, 3, 55–58 CrossRef CAS.
- J. Fritz, Analyst, 2008, 133, 855–863 RSC.
- J.-P. McGovern, W. Y. Shih, R. Rest, M. Purohit, Y. Pandya and W.-H. Shih, Analyst, 2008, 133, 649–654 RSC.
- N. Jung and S. Jeon, Macromolecules, 2008, 41, 9819–9822 CrossRef CAS.
- M. Yun, N. Jung, C. Yim and S. Jeon, Polymer, 2011, 52, 4136–4140 CrossRef CAS.
- S. Bose, S. S. Keller, T. S. Alstrøm, A. Boisen and K. Almdal, Langmuir, 2013, 29, 6911–6919 CrossRef CAS PubMed.
- J. Kim, J. Song, K. Kim, S. Kim, J. Song, N. Kim, M. F. Khan, L. Zhang, J. E. Sader, K. Park, D. Kim, T. Thundat and J. Lee, Nano Lett., 2016, 16, 1537–1545 CrossRef CAS PubMed.
- M. F. Khan, S. Schmid, P. E. Larsen, Z. J. Davis, W. Yan, E. H. Stenby and A. Boisen, Sens. Actuators, B, 2013, 185, 456–461 CrossRef CAS.
- M. F. Khan, S. Kim, D. Lee, S. Schmid, A. Boisen and T. Thundat, Lab Chip, 2014, 14, 1302–1307 RSC.
- N. Miriyala, M. F. Khan and T. Thundat, Sens. Actuators, B, 2016, 235, 273–279 CrossRef CAS.
- Idemat, Matebase, http://www.matbase.com.
- Sigma-Aldrich, PMMA, http://www.sigmaaldrich.com/catalog/product/sial/81489?lang=en%26region=CA.
- W. Weaver Jr, S. P. Timoshenko and D. H. Young, Vibration problems in Engineering: Chapter 1, Wiley, 1990 Search PubMed.
- M. Pyda, R. C. Bopp and B. Wunderlich, J. Chem. Thermodyn., 2004, 36, 731–742 CrossRef CAS.
- D. Liu and C. Zhong, Polym. J., 2002, 34, 954–961 CrossRef CAS.
- T. Hayashi and K. Fukao, Phys. Rev. E: Stat., Nonlinear, Soft Matter Phys., 2014, 89, 022602 CrossRef PubMed.
- A. Goswami, A. M. Umarji and G. Madras, Polym. Adv. Technol., 2012, 23, 1604–1611 CrossRef CAS.
- M. S. Ardi, W. Dick and J. Kubát, Colloid Polym. Sci., 1993, 271, 739–747 CAS.
- A. Goswami, A. M. Umarji and G. Madras, Polym.-Plast. Technol. Eng., 2013, 52, 485–494 CrossRef CAS.
- P. S. Gill, C. L. Marcozzi and I. F. Groves, The characterization of poly(methyl methacrylate), (PMMA), by dielectric analysis and the study of the effects of beta-alkyl substitution on the dielectric properties, Sixth International Conference on Dielectric Materials, Measurements and Applications, 1992 Search PubMed.
- N. Nakayama and T. Hayashi, Polym. Degrad. Stab., 2007, 92, 1255–1264 CrossRef CAS.
- TA-Instruments, Thermal Analysis Investigation of a Poly(Lactic Acid) Biodegradable Plastic, TA 384 Search PubMed.
- J. Leng, P. J. Purohit, N. Kang, D.-Y. Wang, J. Falkenhagen, F. Emmerling, A. F. Thünemann and A. Schönhals, Eur. Polym. J., 2015, 68, 338–354 CrossRef CAS.
- A. Goswami, A. M. Umarji and G. Madras, J. Appl. Polym. Sci., 2010, 117, 2444–2453 CrossRef CAS.
Footnote |
| † Electronic supplementary information (ESI) available. See DOI: 10.1039/c6ra25455a |
| This journal is © The Royal Society of Chemistry 2017 |


