DOI:
10.1039/C6RA25413F
(Paper)
RSC Adv., 2017,
7, 5928-5936
A comparative study of manganese–cerium doped metal–organic frameworks prepared via impregnation and in situ methods in the selective catalytic reduction of NO
Received
18th October 2016
, Accepted 17th December 2016
First published on 17th January 2017
Abstract
Mn and Ce were loaded on metal–organic frameworks (MOFs) via impregnation and in situ doping methods. The catalytic capacities of the obtained composite materials were evaluated in the selective catalytic reduction (SCR) of NO. The existing form of Mn–Ce in the MOF originates from different doping methods and its effect on the catalytic performance was investigated. Mn–Ce introduced by impregnation was deposited on the surface of the MOF and exhibited high catalytic efficiency of more than 98% from 200 °C to 300 °C. According to the results of BET, XRD, XPS, and ICP analyses, it was concluded that Mn–Ce introduced via the in situ doping method was inserted in the crystal lattice structure of the MOF, which resulted in an enlarged surface area, low Mn concentration, and poor redox property as compared to that introduced via the impregnated method. By exploring these factors, it was proven that the limited redox ability was the direct reason that resulted in the low activity of the MnCeMOF. Using thermal decomposition, the in situ doped Mn–Ce was liberated from the MnCeMOF crystal lattice and subsequently, exhibited recovered redox properties and catalytic activity. In this study, we proved that different doping methods lead to different forms of Mn–Ce in the MOF, which exhibit different redox properties and thus directly lead to different catalytic performance.
1. Introduction
Metal–organic frameworks (MOFs) are compounds consisting of metal ions or clusters coordinated to organic ligands.1 The advantages of high porosity, large specific surface areas, and versatility of their structures make MOFs very attractive in many fields such as separation, gas adsorption, and catalysis.2 Recently, the synthesis of metal oxides supported on MOFs for catalytic applications has gained significant attention.3 Impregnation and in situ doping are the two most common strategies used in catalyst preparation. Henschel et al.4 reported that the palladium particles incorporated into MOFs via incipient wetness impregnation exhibited significantly higher catalytic activity than that of the catalyst comprising palladium supported on activated carbon during the hydrogenation reaction. Han et al.5 proved that the impregnation of MOF with cobalt followed by a mild heat treatment exhibited a significant improvement in the catalytic activity when compared with that of cobalt oxide or cobalt oxide supported on silica nanospheres. In situ doping is another method to prepare metal–MOF composites. The incorporation of various metals ions, such as Mn2+, Li+, Na+, and K+ into an MOF structure via an in situ doping method has been reported.6,7 Ebrahim et al.8 reported a feasible way for the in situ doping of Ce in an MOF using Ce as a co-metal precursor in the synthetic process. Due to the redox properties of the in situ doped Ce, the material exhibited a high affinity for nitrogen oxides. The effectiveness of Ce in situ doped chromium-based MOFs in the catalytic H2 production was also reported by Wen et al.9
Nitric oxide (NO) is known to cause environmental pollution, such as photochemical smog, acid rain, ozone depletion, and greenhouse effects.10 Coal-fired power plants are considered as important sources of NO emission and the selective catalytic reduction (SCR) of NO with NH3  has been proven to be one of the most effective approaches for NO removal.11–13 Many transition metal oxides have been developed as NO-reduction catalysts. Among these, manganese oxides exhibit a significant enhancement in NO conversion at low temperatures.14–16 Cerium oxides have also been proven to be very effective during NO conversion due to their excellent redox behavior.16–18 Moreover, a synergistic improvement between Mn and Ce has been found in the mixed Mn–Ce catalysts.19–22 Various supporting materials, including carbon nanotubes,23 pillared-clay,20 glass-fiber,24 and zirconium oxide,25 have been employed for Mn–Ce loading and have exhibited high catalytic performance.
Although Mn–Ce-based catalysts used for the SCR of NO have been previously studied by researchers, the preparation of Mn–Ce and MOF composites via impregnation or in situ doping methods for the SCR of NO has not been reported. In this study, Mn–Ce species were loaded on the MOF via in situ doping or impregnation methods and their catalytic capabilities were evaluated in the SCR of NO reaction. It is very interesting to investigate the effect of the impregnation and in situ doping methods on the formation of the Mn–Ce catalyst and consequently, their influence on the catalytic performance.
In a pioneering work, Cavka et al. published the synthesis of the metal–organic framework UiO-67 (Zr6O4(OH)4(C12H10(CO2)2)6(DMF)x(H2O)y), which was composed of Zr clusters and linear 4,4′-biphenyldicarboxylic acid ligands.26 UiO-67 has proved to be a very promising candidate as a catalyst support due to its highly developed three-dimensional pore systems and high thermal, chemical, and mechanical stabilities.27,28 Therefore, in this study, UiO-67 was selected as the supporting MOF for Mn–Ce doping.
2. Experimental
2.1 Materials
Zirconium tetrachloride (ZrCl4), 4,4′-biphenyl-dicarboxylate (BDPC, 98.9%), cerium nitrate hexahydrate (Ce(NO3)3·6H2O, 99.5%), and manganese nitrate (Mn(NO3)2, 50 wt% solution in H2O) were obtained from Beijing J&K Co., Ltd. (Beijing, China). N,N-Dimethylformamide (DMF, 99%) and dichloromethane (DCM, 99%) were obtained from Tianjin Guangfu Reagent Co. Ltd. All chemicals were used without further purification.
2.2 Preparation of the catalysts
2.2.1 Preparation of the catalysts via an in situ doping method. The Mn–Ce in situ doped MOF was prepared according to the synthesis route reported by Ebrahim et al.8 Equimolar amounts of ZrCl4 (2.33 g, 10 mmol), Ce(NO3)3·6H2O (4.34 g, 10 mmol), and Mn(NO3)2 (1.79 g, 10 mmol) were used as metal donors and dissolved in 390 mL of DMF. Then, 4,4′-biphenyldicarboxylic acid (2.42 g, 10 mmol) was added and mixed by ultrasonication. HCl (37%, 12 M; 1.6 mL, 20 mmol) and acetic acid (6.03 g, 100 mmol) were added to the solution as acid modulators to promote MOF crystallization. Each 5 mL of the mixture was added into a 20 mL Teflon lined glass vial and heated at 120 °C for 30 h. The resulting powder was washed with DMF for 24 h followed by DCM washing for 36 h to remove the impurities. After centrifugation and drying at room temperature, the Mn–Ce in situ doped MOF was obtained and denoted as MnCeMOF. The same procedure was carried out for the synthesis of undoped MOF and ZrCl4 was the only metal donor used in the preparation process.
2.2.2 Preparation of the catalysts via an impregnation method. Ce(NO3)3·6H2O (0.23 g) and Mn(NO3)2 (0.32 mL, 50 wt% solution in H2O) were dissolved in 20 mL ethanol to obtain a Mn–Ce solution. MOF (1.5 g) was dispersed in 30 mL ethanol by ultrasonication for 15 min. Then, the Mn–Ce solution was added dropwise under vigorous stirring at room temperature for 6 h. Ethanol was removed by drying the sample at 80 °C overnight, and then the solid was heated at 300 °C for 5 h to achieve the Mn–Ce impregnated MOF, which was denoted as MnCe@MOF.
2.2.3 Preparation of Mn@CeMOF. Ce in situ doped MOF (CeMOF) was prepared using ZrCl4 and Ce(NO3)3·6H2O as metal donors and the preparation step was followed via the in situ doping procedure. The Mn impregnated CeMOF (denoted as Mn@CeMOF) was prepared by impregnating 1.5 g of CeMOF with 0.32 mL of Mn(NO3)2 ethanol solution following the impregnation procedure.
2.3 Characterization
Powder X-ray diffraction (PXRD) patterns were obtained over the range of 5–80° (2θ) using a Bruker AXS GmbH X-ray diffractometer (Bruker D8 FOCUS, Germany) with a Cu Kα radiation. The textural characteristics of the samples were determined using N2 adsorption at −196 °C using an ASAP 2020/Tristar 3000 system (Micromeritics, America). The specific surface areas were calculated using the BET method and the specific pore volumes were calculated using the BJH method. The concentrations of the active species in the catalysts were determined by inductively coupled plasma optical emission spectrometry (ICP-OES; Varian Inc.). X-ray photoelectron spectroscopy (XPS) was performed using a Kratos Axis Ultra DLD spectrometer (Kratos Analytical, UK) operating at 10–9 Pa with an Al Kα radiation (1486.6 eV). H2-TPR was conducted using a PCA-1200 chemisorption analyzer (Builder, China). In the H2-TPR experiment, 50 mg of the catalyst was preheated at 150 °C for 1.5 h under N2 to remove the moisture in the sample. After cooling down to room temperature, the temperature programming was started with a 5 °C min−1 heating rate under 30 mL min−1 H2 (5 vol%)/N2.
2.4 Catalytic activity test
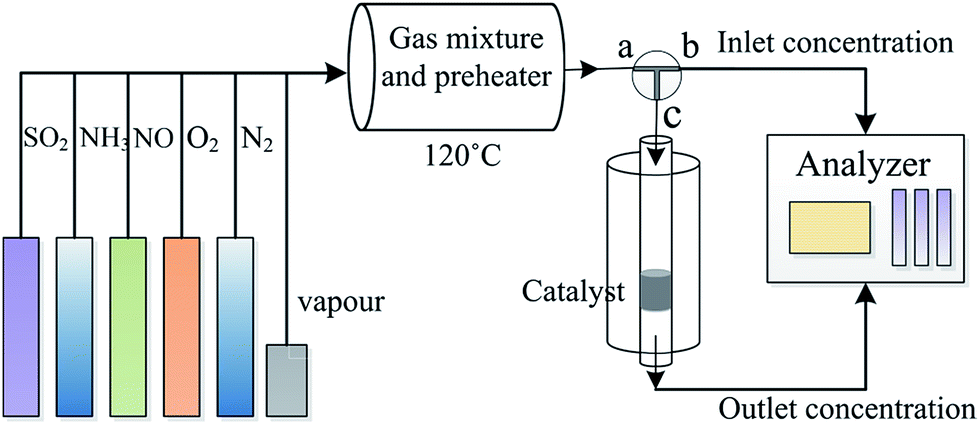
The catalytic activity of the catalysts was studied using a fixed-bed system (Fig. 1). The simulated flue gas included 500 ppm NO, 500 ppm NH3, 5% O2, and pure N2. In all the runs, the total gas flow rate was maintained at 450 mL min−1 over 0.5 g catalyst (with a gas hourly space velocity of 45![[thin space (1/6-em)]](https://www.rsc.org/images/entities/char_2009.gif) 000 h−1). The NO concentration in the inlet and outlet of the reactor was monitored using a Flue Gas Analyzer (KM940, Kane 100 international limited, UK). The NO conversion was calculated using the following equation:
000 h−1). The NO concentration in the inlet and outlet of the reactor was monitored using a Flue Gas Analyzer (KM940, Kane 100 international limited, UK). The NO conversion was calculated using the following equation:
| NO conversion = (NOin − NOout)/NOin × 100% |
where NOin is the concentration of NO in the inlet and NOout is the concentration of NO in the outlet of the reactor.
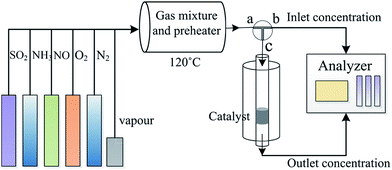 |
| | Fig. 1 Schematic for the fixed-bed system used for the SCR of NO. | |
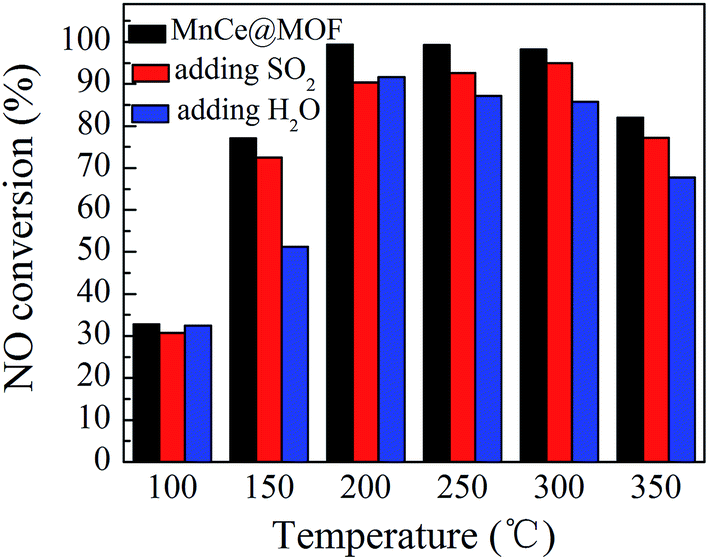
The influence of water vapor and SO2 on the NO conversion was studied by introducing 3% water vapor and 200 ppm SO2 into the flue gas.
3. Results and discussion
3.1 Catalytic performance of the catalysts
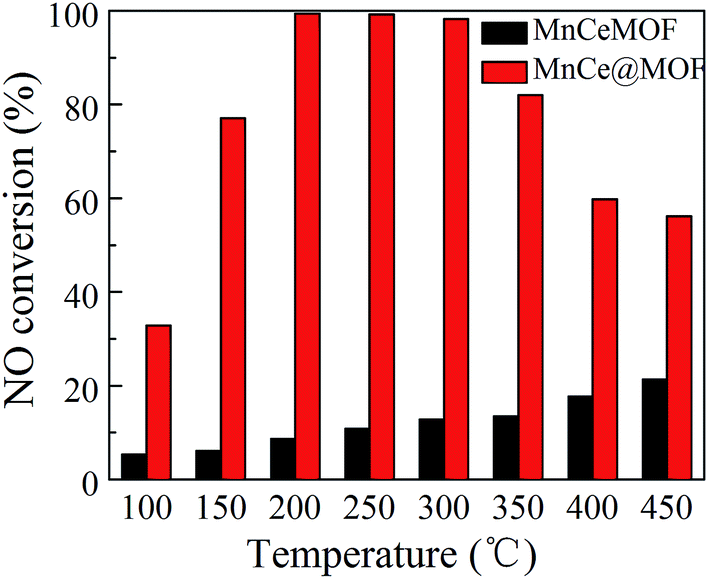
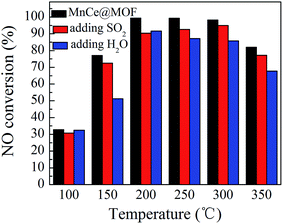
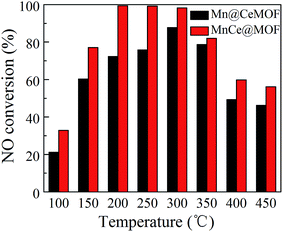
NO conversions in the temperature range of 100–450 °C for the SCR reaction over MnCeMOF and MnCe@MOF are shown in Fig. 2. It shows that the Mn–Ce impregnated catalyst MnCe@MOF exhibited a high activity with NO conversions of over 98% in the temperature range of 200–300 °C. The catalytic activity significantly decreased as the temperature was increased over 350 °C for MnCe@MOF, which could be attributed to the side reaction of ammonia where it reacts with oxygen to yield nitrogen oxides above 350 °C.29 Considering that traces of SO2 and moisture may exist in the flue gas, the effects of SO2 and H2O on the NO conversion over MnCe@MOF were investigated. As shown in Fig. 3, the addition of 200 ppm SO2 or 3% H2O to the flue gas resulted in a decrease in the NO removal performance. The prohibitive effect of H2O on NO conversion could be attributed to the competitive adsorption with the reactant and occupation of the active sites on the catalyst.30–32 The prohibitive effect of SO2 on NO conversion might be due to the reaction of SO2 with the active species on the surface of the catalyst, which inhibit the catalyst activity.33,34 Another reason for the prohibitive effect of SO2 may be the formation of ammonium sulfate or ammonium bisulfate on the surface of the catalyst. The prohibitive effect of SO2 or H2O was not significant, which indicated that the MnCe@MOF catalyst performed with an acceptable tolerance to SO2 and H2O in the SCR of NO. Therefore, via the impregnation method, the MOF was demonstrated to be a potential supporting material for the MnCe-based SCR catalysts.
 |
| | Fig. 2 NO conversion of the catalysts. | |
 |
| | Fig. 3 The effect of SO2 and H2O on NO conversion over MnCe@MOF. | |
In the previous studies, it has been proven that in situ doped metals show catalytic properties.8,9 However, the in situ doped MnCeMOF showed a very low catalytic ability of below 20% in the SCR of NO (Fig. 2). It is very interesting to analyze the reasons for the low efficiency of MnCeMOF in the catalytic reaction. The mechanisms of different doping methods on the catalytic behavior will also be explored on the basis of the following characterization results.
3.2 Characterization of the catalysts
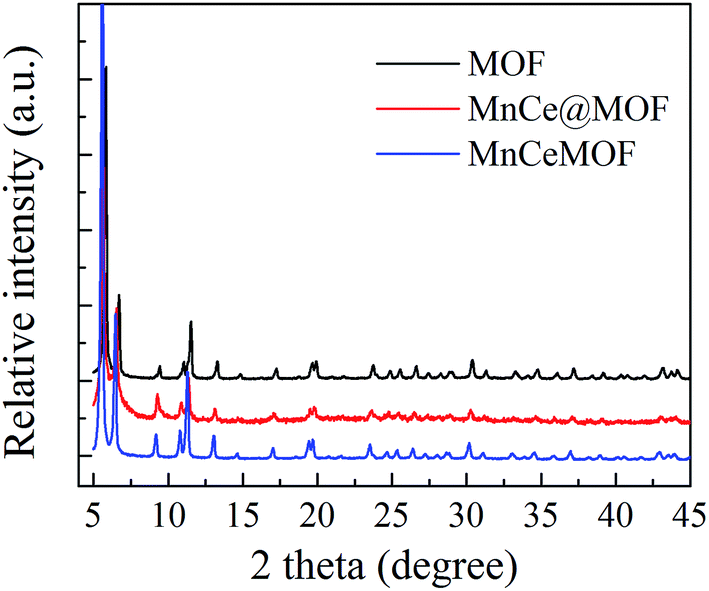
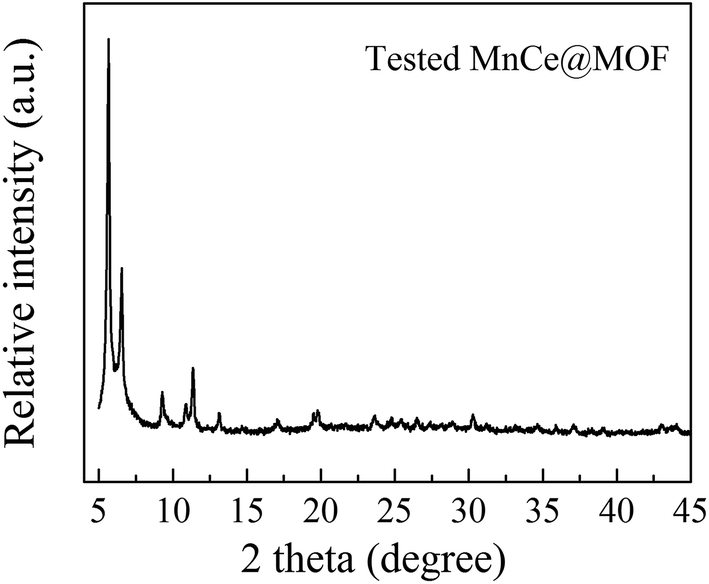
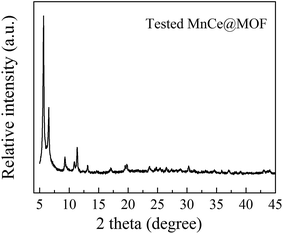
3.2.1 Structure properties of the catalysts. The crystal structures of the catalysts were characterized using XRD analysis, which is shown in Fig. 4. The XRD patterns of the undoped MOF can be well indexed to UiO-67, indicating that the synthesized materials exhibited a characteristic octahedron structure.35 After the doping of Mn–Ce, the main characteristic XRD peaks of the MOF in all the samples were retained, indicating that the crystalline structure of the MOF was well preserved after the impregnation or in situ doping of Mn–Ce. The characteristic peaks of the Mn and Ce species were not observed in the XRD patterns, which may be due to their existence as small crystals whose sizes are below the resolution limit of the technique or highly dispersed on the surface of the supporting material.36 Moreover, the framework of the MOF was intact after its use as a catalyst, suggested on the basis of the XRD pattern of the tested MnCe@MOF (Fig. 5), which indicates the stability of the MOF as a supporting material.
 |
| | Fig. 4 The XRD patterns obtained for the catalysts. | |
 |
| | Fig. 5 The XRD patterns obtained for MnCe@MOF tested at 200 °C. | |
The XRD pattern of MnCeMOF was similar to that of the undoped MOF, indicating that doping the MOF with Mn–Ce did not alter the main octahedron structure of the material. However, XRD not only provides information on the crystalline structure but also some clue on the location and interactions between the doped Mn–Ce and the MOF matrix. Note that the strength of the peaks in the MnCeMOF pattern obviously increased and the maximum characteristic peaks in the MnCeMOF pattern (2θ = 5.6°, 6.5°, and 11.3°) shifted to a lower angle as compared to those of the undoped MOF pattern. This indicates that the in situ doped Mn–Ce affects the crystalline structure of the MOF.
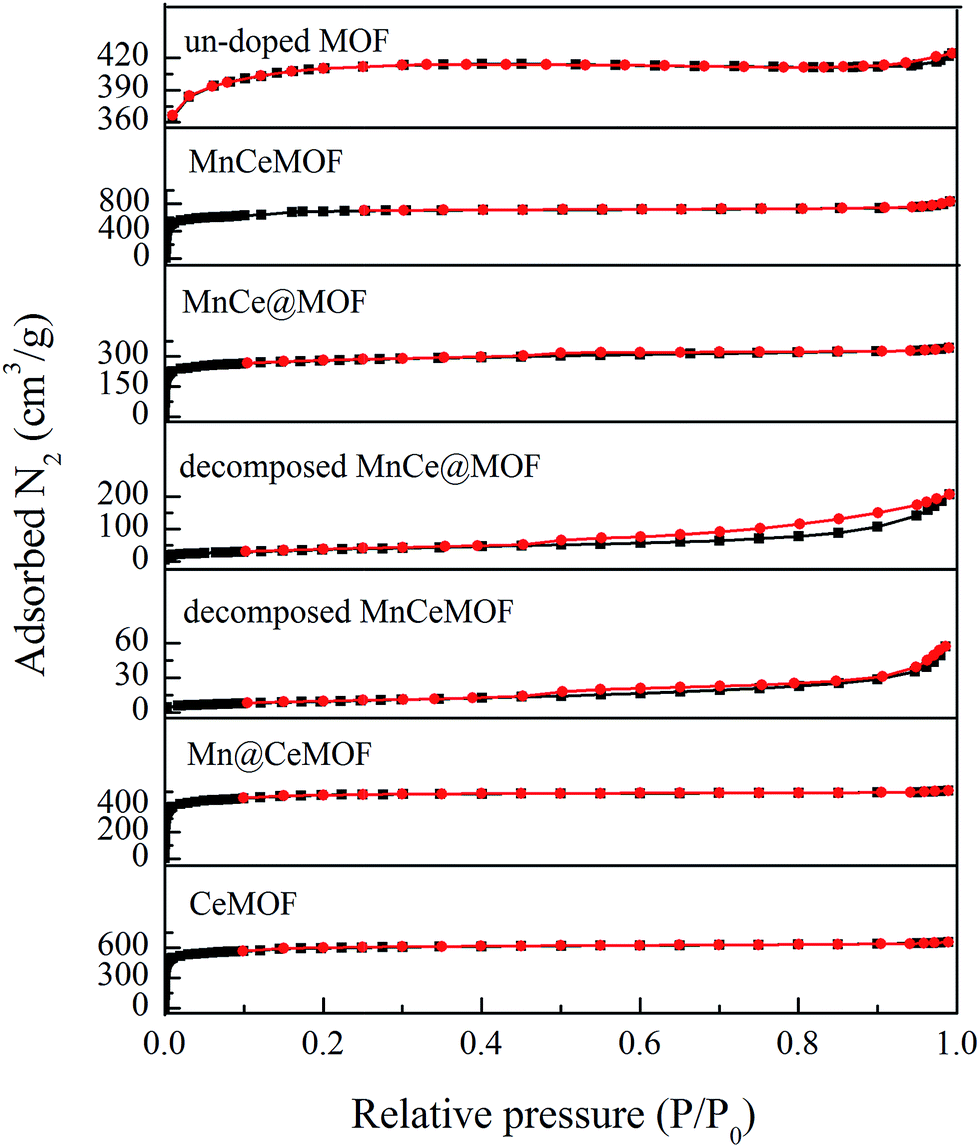
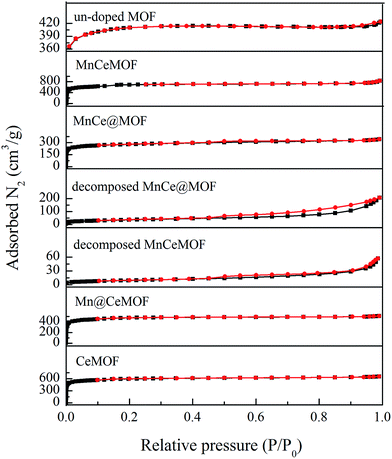
3.2.2 Physical properties of the catalysts. The physical properties of the materials were analyzed by N2 adsorption and the results are listed in Table 1 and Fig. 6. An inspection of the isotherms indicated the mostly microporous nature of the undoped MOF, MnCeMOF, and MnCe@MOF. The MOF exhibited a high BET-specific surface area of 1376.95 m2 g−1. The impregnation of Mn–Ce leads to a decrease in the BET surface area and pore volume, which is due to the deposition of Mn–Ce in the cages of the MOF and partial blockage of the cages in the frameworks. MnCeMOF exhibited a higher BET surface area and larger pore volume than the undoped MOF. Based on the Ebrahim's point,8 Mn–Ce doping may inhibit the complete growth of the MOF and lead to crystal defects, which result in an increase in the pore volume. Moreover, during the synthesis of MnCeMOF, Mn/Ce may become sites of crystal growth. The generated Mn/Ce-centered new phase is very likely to possess a high volume of pores and small size, which results in an increase in the surface area.
Table 1 The BET surface area and pore volume of the materials
| |
Undoped MOF |
MnCeMOF |
MnCe@MOF |
Decomposed MnCe@MOF |
Decomposed MnCeMOF |
Mn@CeMOF |
CeMOF |
| BET surface area (m2 g−1) |
1376.95 |
2491.45 |
1048.41 |
113.63 |
30.95 |
1894.20 |
2252.95 |
| Pore volume (cm3 g−1) |
0.64 |
1.28 |
0.53 |
0.32 |
0.089 |
0.87 |
1.01 |
| Average pore width (nm) |
1.87 |
2.07 |
2.01 |
11.29 |
11.48 |
1.84 |
1.89 |
 |
| | Fig. 6 The N2 sorption isotherms obtained for the materials. | |
The BET surface area of a catalyst support is an important factor that affects the catalytic performance. A high surface area of the support can significantly enhance the catalytic activity of the metal oxides due to the advantages such as promoting the dispersion, avoiding metal oxide aggregation, and promoting charge transfer.5,23 The geometrical features and high BET surface area of the MOF are very likely to contribute to the desirable catalytic performance of MnCe@MOF. However, the MnCeMOF with a higher surface area exhibited low catalytic performance (Fig. 2). This indicates that the BET surface area was not the only factor that influenced the activity of the catalysts. The distinct difference of the impregnated and in situ doped materials in the catalytic behavior may be caused by other more important factors.
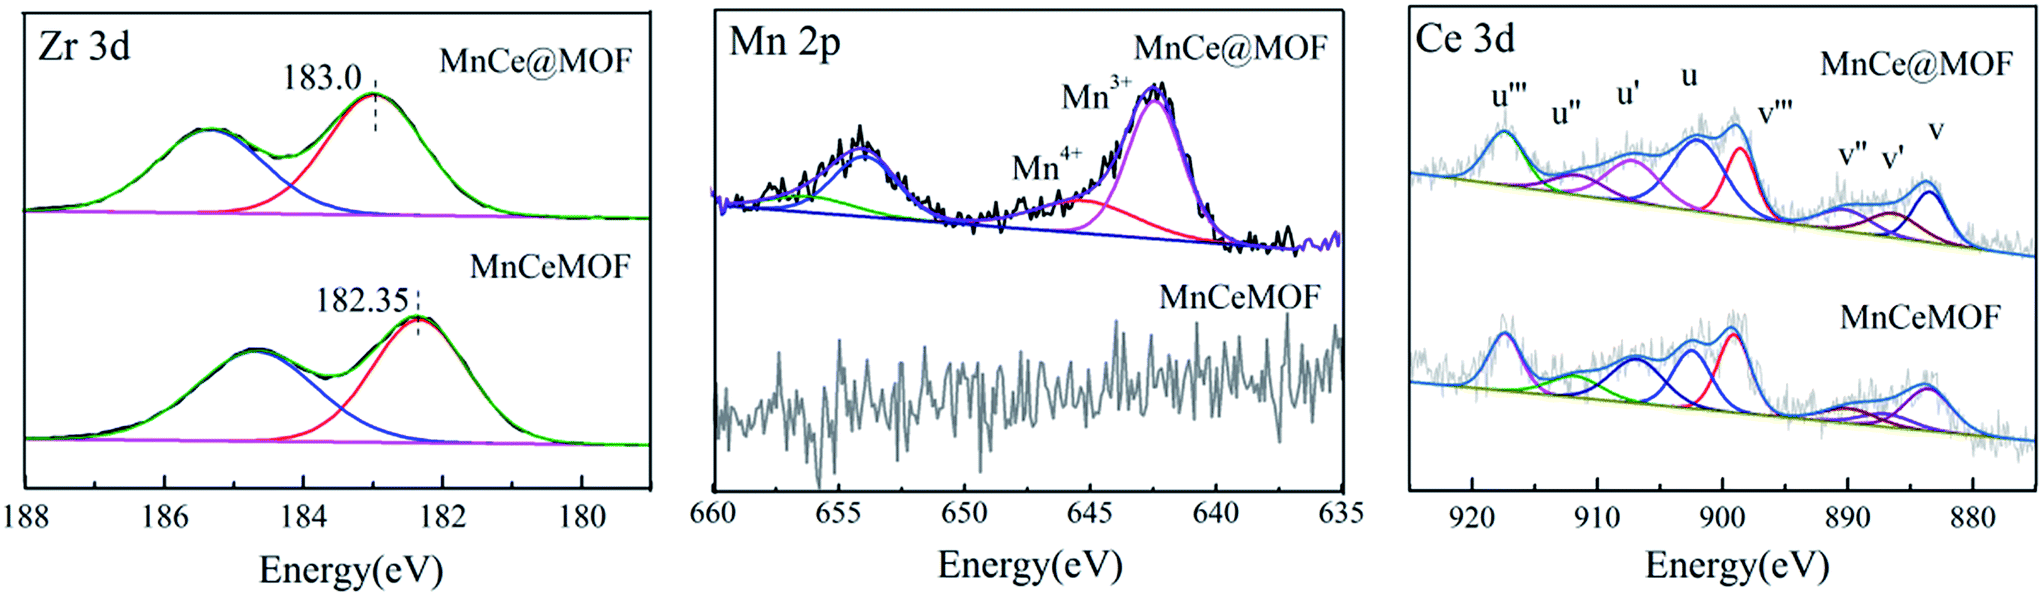
3.2.3 Element speciation analysis of the catalysts. XPS analysis was conducted to understand the chemical states of the active species in MnCe@MOF and MnCeMOF. The XPS results for MnCe@MOF and MnCeMOF are shown in Fig. 7. The XPS spectra of Zr 3d exhibited a peak centered at around 183.0 eV, which was ascribed to Zr4+ clusters. It is found that the maximum BE peak of Zr 3d in MnCeMOF (182.35 eV) shifted to a lower value when compared with that of the MnCe@MOF (183.0 eV). During the synthesis of MnCeMOF, Ce may act with Zr to form a Ce–Zr solid solution or interact with Zr via π-complexation.8 The interaction between Ce and Zr can change the electron atmosphere of Zr4+ (ref. 32) and result in the shift of the BE peak for Zr in the XPS spectra.
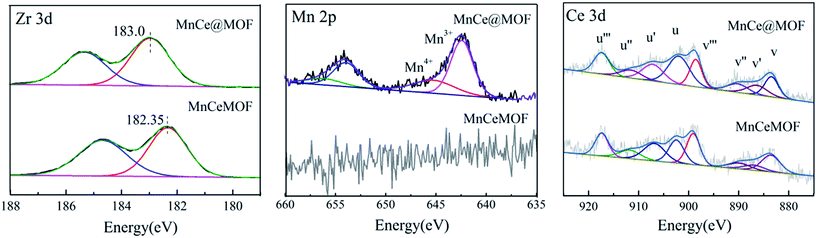 |
| | Fig. 7 XPS spectra of the catalysts over the spectral regions of Mn 2p, Ce 3d, and Zr 3d. | |
In the Mn spectrum for MnCe@MOF, two main peaks appeared representing Mn 2p1/2 and Mn 2p3/2. The spectra were divided into the Mn4+ peak (∼642.7 eV) and Mn3+ peak (∼641.2 eV) by peak-fitting deconvolution, which indicated that Mn2O3 and MnO2 were the major phases of Mn in MnCe@MOF. Moreover, no Mn was detected in the spectrum of the MnCeMOF sample, which may be because Mn was inserted in MnCeMOF or the concentration of Mn in MnCeMOF was below the detection limit of the instrument. The Ce spectra were divided and the sub-bands were denoted as “v” and “u”, which correspond to the Ce 3d5/2 and Ce 3d3/2 spin–orbit components. The v′ and u′ bands ascribed to Ce3+ and other six peaks represented the Ce4+ species on the surface.37 The ratio of Ce3+/Ce4+ was determined to be 22.6/77.4 for MnCe@MOF and 38.9/71.1 for MnCeMOF. The presence of Ce3+ on the surface is considered to create oxygen vacancies and facilitate the adsorption of oxygen species and, therefore, improves the redox activity in the SCR of NO.32 Considering this, the speciation of Ce in the MnCeMOF seemed more favorable for the catalytic reaction; however, MnCe@MOF displayed higher activity, indicating that there were other factors that affect the activity of the catalysts.
3.2.4 Contents of the active components in the catalysts. The chemical composition of the catalyst was characterized by ICP-OES and the data are presented in Table 2. From the ICP results, Mn–Ce was successfully detected from the in situ doped MOF. Mn–Ce could not exist as free ions, considering the long washing steps during the synthesis process. Therefore, we hypothesized that Mn–Ce was successfully incorporated into the framework. The Ce and Mn content in MnCeMOF was 5.1% and 2.4%, respectively. The lower content of Mn in the MnCeMOF indicates that Mn was more difficult to insert into the MOF lattice. The content of Mn and Ce in the MnCe@MOF was determined to be 5.1% and 5.0%, respectively. It is clear that the Mn content in MnCeMOF was lower than that of MnCe@MOF, which may be a reason for the lower catalytic activity of MnCeMOF than that of the MnCe@MOF.
Table 2 Element concentration of the samples
| |
MnCeMOF |
MnCe@MOF |
Mn@CeMOF |
| Ce (%) |
4.98 |
4.92 |
4.79 |
| Mn (%) |
1.62 |
5.50 |
5.43 |
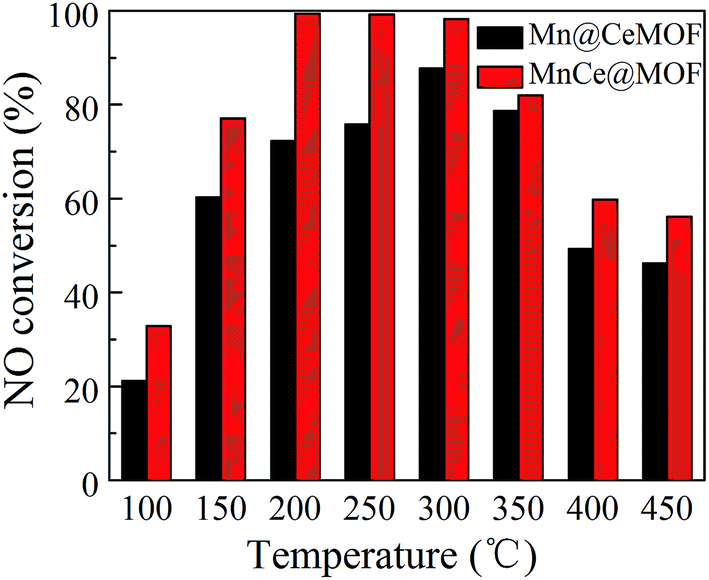
To verify this speculation, a Mn@CeMOF catalyst (impregnated Mn on the Ce in situ doped MOF) was prepared and compared with MnCe@MOF. The XRD pattern of Mn@CeMOF was similar to that of the undoped MOF, indicating that the synthesized Mn@CeMOF exhibited the characteristic octahedron structure. The physical properties of Mn@CeMOF and CeMOF were also analyzed by N2 adsorption (Table 1 and Fig. 6). The N2 adsorption measurement of Mn@CeMOF and CeMOF showed a type I property, suggesting that the microporous nature was dominant in the materials. Based on the discussion in our study, in situ doping led to an increase in the BET surface area and enlarged the pores, which might be due to the expansion of the MOF crystal. However, impregnation results in a decrease in the surface area due to the deposition of the impregnated metal and plugging of the pores in the MOF. Therefore, the surface area of Mn@CeMOF was higher than that of the undoped MOF but lower than that of the CeMOF. From the ICP results, the Mn and Ce contents between Mn@CeMOF and MnCe@MOF were basically the same, which was consistent with our designation. However, the results of the NO conversion tests showed that the catalytic activity of Mn@CeMOF was lower than that of MnCe@MOF (Fig. 8). This indicates that the content of Mn–Ce was not a key factor that leads to the different catalytic efficiencies between the in situ doped MnCeMOF and impregnated MnCe@MOF.
 |
| | Fig. 8 The NO conversion of Mn@CeMOF and MnCe@MOF. | |
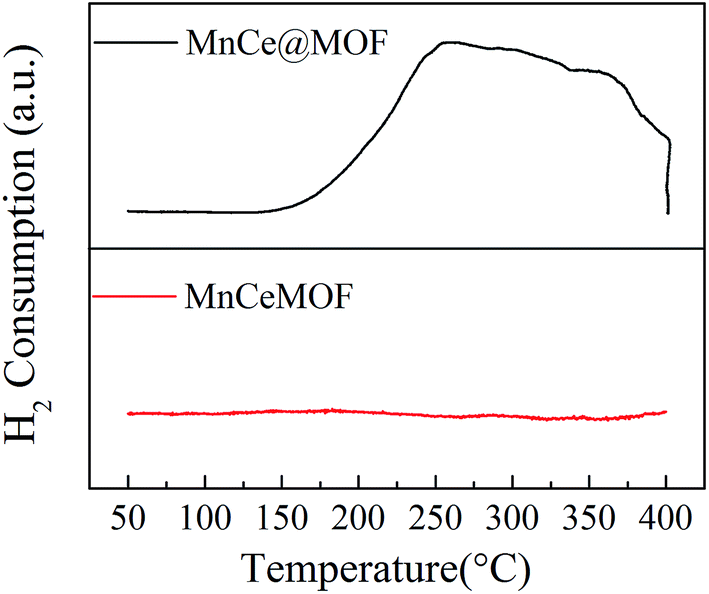
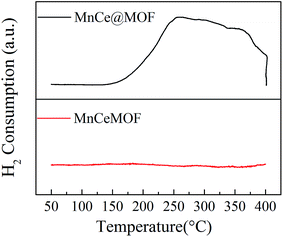
3.2.5 Redox properties of the catalysts. The redox properties of MnCe@MOF and MnCeMOF were investigated by H2-TPR and the results are shown in Fig. 9. The temperature at the end of the TPR was set at 400 °C to prevent the decomposition of the MOF structure. The MnCe@MOF presented a H2 consumption peak throughout the temperature range from 150 to 400 °C, which was ascribed to the reduction of the surface Mn4+ to Mn2+.19 However, the intensity of the H2 peak for the MnCeMOF was very weak, indicating the poor redox properties of the catalyst. It is known that recycling redox is the key step in the completion of a catalytic reaction. Therefore, the poor redox properties of the in situ doped Mn–Ce may be the reason for the lower activity of MnCeMOF than that of MnCe@MOF. Moreover, some of the previous reports have proven that the recycling redox cycle exists in the metal in situ doped MOFs8,9 and metal clusters of the MOFs.38 However, in this study, we proved that the redox properties of Mn–Ce present in the MOF lattice were very limited. Considering this, it was concluded that different doping methods lead to different Mn–Ce redox properties, which may be the main factor that decides the activity of the catalyst.
 |
| | Fig. 9 The H2-TPR profiles obtained for the catalysts. | |
3.3 Comparative experiment results
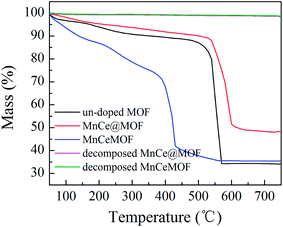
From the abovementioned experimental and characterization results, it was hypothesized that MnCeMOF exhibits low catalytic activity due to the Mn–Ce present in the MOF lattice possessing limited redox properties. To verify this assumption, Mn–Ce was liberated from the crystal lattice by heating the materials and a comparative experiment was performed. By the thermolysis of a MOF, metal oxides species could be obtained by the loss of organic ligands at high temperatures.39–41 TGA studies were conducted under N2 and the heating rate was set at 20 °C min−1. The TGA curves (Fig. 10) for the undoped MOF, MnCe@MOF, and MnCeMOF exhibited a similar trend. The curves revealed three steps that are mainly attributed to water and solvent removal, framework collapse with the decomposition of organic species, and the formation of inorganic oxides. It was observed that the structural collapse temperature for MnCeMOF was lower than that for the undoped MOF. This might be because Mn–Ce doping inhibited the complete growth of the MOF and led to crystal defects, which results in the decreased thermal stability of the framework. The TGA results indicate that the catalysts were stable when used below 400 °C. Moreover, based on the TGA curve obtained for the MOF, the thermal decomposition temperature was set at 600 °C for the preparation of the thermally decomposed samples. The catalytic performance and structural properties of the thermally decomposed MnCeMOF as well as the thermally decomposed MnCe@MOF were investigated.
 |
| | Fig. 10 The TGA curves obtained for the materials. | |
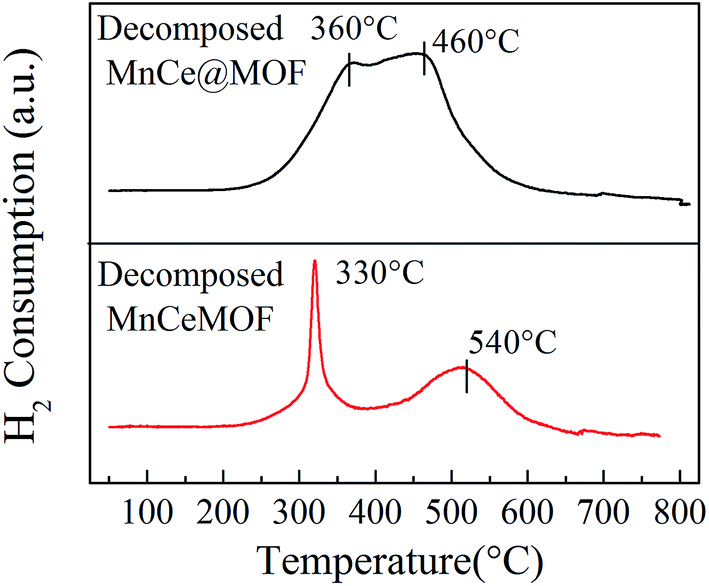
3.3.1 Properties of the decomposed samples. As observed from the TGA results, there was little weight loss during the test for the thermally decomposed MnCe@MOF and decomposed MnCeMOF, which indicates that the organic species were removed and inorganic oxides were generated at high temperature. The XRD patterns of the decomposed samples are shown in Fig. 11. The XRD pattern shows that the special octahedrons crystalline structure disappeared in the decomposed samples, which indicates that the collapse of the MOF structure occurred during the high temperature treatment. With the decomposition of the organic species, the doped Mn–Ce as well as the metal clusters of the MOF (Zr) were liberated from the crystal lattice.39–42 Peaks at 31°, 35.1°, 50.5°, 60°, and 63° (2θ) appeared in the spectra of the decomposed MnCeMOF, which were attributed to the liberated zirconium oxides nodes of the MOF.43 However, the characteristic peaks for Mn and Ce were not observed in the XRD patterns due to their low concentration. From the N2 adsorption results (Table 1 and Fig. 6), the significant decrease in the BET surface area of the decomposed catalyst indicated the collapse of the crystalline structure. Moreover, the thermally decomposed samples exhibited different sorption isotherms when compared with the original samples. The sorption isotherms obtained for the decomposed samples exhibit mesoporous features and possess a much lower adsorption capability due to their low BET surface area. The redox properties of the decomposed catalysts were also investigated and the results are shown in Fig. 12. In the H2-TPR spectrum of the decomposed MnCeMOF sample, a sharp peak at 330 °C and a broad peak at 540 °C appeared, which were assigned to the reduction of the surface Mn4+ to Mn3+ and surface Ce4+ to Ce3+, respectively.30,33 When comparing the H2-TPR results of the decomposed MnCeMOF sample with those of the original MnCeMOF, it was observed that the redox properties of Mn–Ce changed upon changing the form in which they exist. The decomposed sample with liberated Mn–Ce possessed much better redox properties when compared with the original MnCeMOF sample.
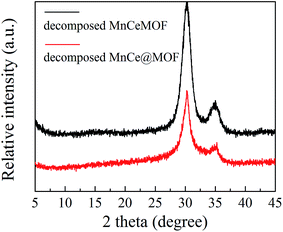 |
| | Fig. 11 The XRD patterns obtained for the decomposed catalysts. | |
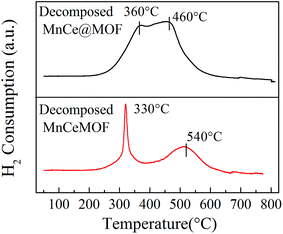 |
| | Fig. 12 The H2-TPR profiles obtained for the decomposed catalysts. | |
Moreover, the decomposed MnCe@MOF exhibited a broad H2 consumption peak in the temperature range from 250 to 550 °C, which could be divided into two peaks at 360 °C and 460 °C that are related to the reduction of surface Mn4+ to Mn3+ and Ce4+ to Ce3+, respectively.19,44 Note that that the Ce spectrum of the decomposed MnCeMOF shifted to a higher temperature when compared to that of the decomposed MnCe@MOF. Fallya et al.45 reported that the H2-peak of Ce oxides moved to a higher temperature when mixed with zirconium oxides. The shift in the CeO2 transition temperature in the decomposed MnCeMOF may indicate that there was interaction between Zr and Ce in the original MnCeMOF.
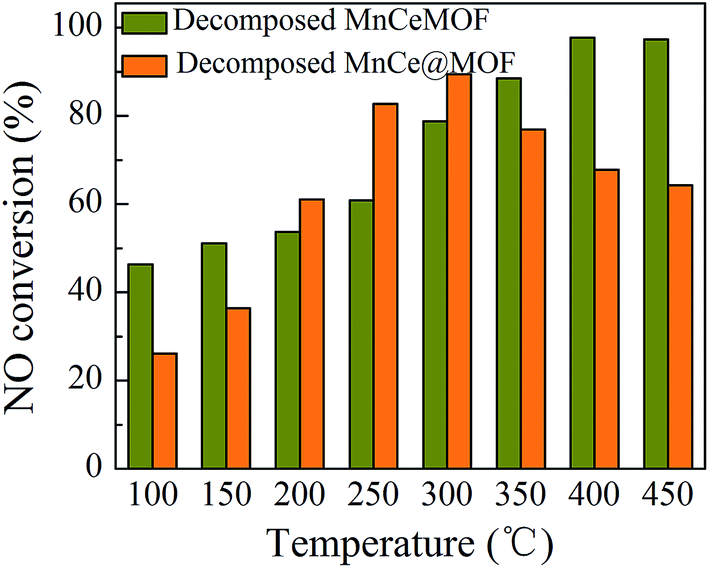
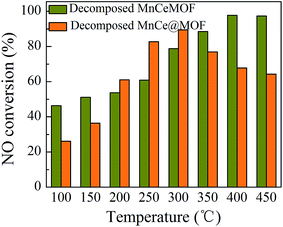
3.3.2 Catalytic performances of the decomposed catalysts. The catalytic capability of the thermally decomposed catalysts was tested and the results are shown in Fig. 13. When compared with the original MnCeMOF, the decomposed MnCeMOF exhibited significantly better catalytic performance. The NO conversion for the decomposed MnCeMOF increased as the temperature increased and the conversion reached 98% above 400 °C. Mn–Ce present in the crystalline lattice was believed to be liberated from the collapse of the MnCeMOF structure upon thermal treatment. Due to transformation of the form of Mn–Ce, the decomposed MnCeMOF exhibited distinct redox properties. Therefore, the decomposed MnCeMOF showed high activity in the catalytic reaction. By comparing the decomposed and original MnCeMOF, it was confirmed that the different doping method led to different forms of Mn–Ce in the MOF, which exhibit different redox properties and directly lead to different catalytic performances.
 |
| | Fig. 13 The NO conversion of the decomposed catalysts. | |
In addition, by comparing the decomposed and original impregnated MnCe@MOF, it was found that the decomposed sample showed a much lower catalytic efficiency. A support with a high BET surface area can effectively generate more surface active sites and promote charge transfer, which is beneficial for the catalytic performance.21,46 Based on the XRD and N2 adsorption results, it is most likely that the decreased catalytic efficiency of the decomposed sample can be attributed to the crushed special structure and the decreased surface area of the catalyst. From the comparative experimental results, the MOF was proven to be a potential supporting material for the impregnated Mn–Ce catalysts.
4. Conclusion
Mn–Ce doped MOF composites were synthesized via impregnation and in situ doping methods, and their catalytic capabilities were investigated in the SCR of NO. The results showed that the MnCe@MOF catalyst prepared via the impregnation method showed desirable NO conversion efficiency, whereas the MnCeMOF prepared via the in situ doping method exhibited low activity in the catalytic reaction. The characterization results indicated that Mn and Ce were spread on the surfaces of MnCe@MOF and displayed redox properties. The MOF was demonstrated to be a potential supporting material for the impregnated MnCe-based SCR catalyst. Using in situ doping, Mn–Ce was inserted into the crystal lattice structure of the MOF, which resulted in an enlarged surface area, low Mn concentration, and poor redox properties when compared with those of the impregnated material. Based on a comparative study, it was proved that the poor redox ability of the in situ doped Mn–Ce was the main factor that decided the activity of the catalyst. Moreover, this assumption was supported by the fact that upon the liberation of Mn and Ce from the crystal lattice, the decomposed MnCeMOF exhibited recovered redox properties and a high catalytic capability. In this study, we have proven that different doping methods can lead to different forms of Mn–Ce in the MOF, which exhibit different redox properties and directly lead to different catalytic performances in the SCR of NO.
Acknowledgements
The project was supported by the National Natural Science Foundation of China (51541602) and Natural Science Foundation of Hebei Province (E2016202361).
References
- J. L. C. Rowsell and O. M. Yaghi, Microporous Mesoporous Mater., 2004, 73, 3–14 CrossRef CAS
 .
. - H. Furukawa, K. E. Cordova, M. O'Keeffe and O. M. Yaghi, Science, 2013, 341, 1230444 CrossRef PubMed .
- Y. Zhang, Y. Zhou, Y. Zhao and C.-J. Liu, Catal. Today, 2016, 263, 61–68 CrossRef CAS .
- A. Henschel, K. Gedrich, R. Kraehnert and S. Kaskel, Chem. Commun., 2008, 4192–4194 RSC .
- J. Han, D. Wang, Y. Du, S. Xi, J. Hong, S. Yin, Z. Chen, T. Zhou and R. Xu, J. Mater. Chem. A, 2015, 3, 20607–20613 CAS .
- M. Šimėnas, A. Ciupa, M. Mączka, A. Pöppl and J. R. Banys, J. Phys. Chem. A, 2015, 119, 24522–24528 Search PubMed .
- C.-L. Chu, J.-R. Chen and T.-Y. Lee, Int. J. Hydrogen Energy, 2012, 37, 6721–6726 CrossRef CAS .
- A. M. Ebrahim and T. J. Bandosz, ACS Appl. Mater. Interfaces, 2013, 5, 10565–10573 CAS .
- M. Wen, Y. Kuwahara, K. Mori, D. Zhang, H. Li and H. Yamashita, J. Mater. Chem. A, 2015, 3, 14134–14141 CAS .
- T. Castro, S. Madronich, S. Rivale, A. Muhlia and B. Mar, Atmos. Environ., 2001, 35, 1765–1772 CrossRef CAS .
- L. S. Wang, B. C. Huang, Y. X. Su, G. Y. Zhou, K. L. Wang, H. C. Luo and D. Q. Ye, Chem. Eng. J., 2012, 192, 232–241 CrossRef CAS .
- G. Liu and P.-X. Gao, Catal. Sci. Technol., 2011, 1, 552–568 CAS .
- S. Roy, M. S. Hegde and G. Madras, Appl. Energy, 2009, 86, 2283–2297 CrossRef CAS .
- D. K. Pappas, T. Boningari, P. Boolchand and P. G. Smirniotis, J. Catal., 2016, 334, 1–13 CrossRef CAS .
- Z. Chen, F. Wang, H. Li, Q. Yang, L. Wang and X. Li, Ind. Eng. Chem. Res., 2012, 51, 202–212 CrossRef CAS .
- W. Y. Yao, Y. Liu, X. Q. Wang, X. L. Weng, H. Q. Wang and Z. B. Wu, J. Phys. Chem. C, 2016, 120, 221–229 CAS .
- Z. Si, D. Weng, X. Wu, J. Yang and B. Wang, Catal. Commun., 2010, 11, 1045–1048 CrossRef CAS .
- F. Liu, H. He, Y. Ding and C. Zhang, Appl. Catal., B, 2009, 93, 194–204 CrossRef CAS .
- D. S. Krivoruchenko, N. S. Telegina, D. A. Bokarev and A. Y. Stakheev, Kinet. Catal., 2015, 56, 741–746 CrossRef CAS .
- Y. Y. Wang, B. X. Shen, C. He, S. J. Yue and F. M. Wang, Environ. Sci. Technol., 2015, 49, 9355–9363 CrossRef CAS PubMed .
- X. Fan, F. Qiu, H. Yang, W. Tian, T. Hou and X. Zhang, Catal. Commun., 2011, 12, 1298–1301 CrossRef CAS .
- Y. Wang, C. Ge, L. Zhan, C. Li, W. Qiao and L. Ling, Ind. Eng. Chem. Res., 2012, 51, 11667–11673 CrossRef CAS .
- X. Wang, Y. Zheng and J. Lin, Catal. Commun., 2013, 37, 96–99 CrossRef CAS .
- L. Li, Y. Diao and X. Liu, J. Rare Earths, 2014, 32, 409–415 CrossRef CAS .
- B. X. Shen, X. P. Zhang, H. Q. Ma, Y. Yao and T. Liu, J. Environ. Sci., 2013, 25, 791–800 CrossRef CAS .
- J. H. Cavka, S. Jakobsen, U. Olsbye, N. Guillou, C. Lamberti, S. Bordiga and K. P. Lillerud, J. Am. Chem. Soc., 2008, 130, 13850–13851 CrossRef PubMed .
- W. Salomon, C. Roch-Marchal, P. Mialane, P. Rouschmeyer, C. Serre, M. Haouas, F. Taulelle, S. Yang, L. Ruhlmann and A. Dolbecq, Chem. Commun., 2015, 51, 2972–2975 RSC .
- I. Luz, C. Rösler, K. Epp, F. X. Llabrés i Xamena and R. A. Fischer, Eur. J. Inorg. Chem., 2015, 3904–3912 CrossRef CAS .
- T. S. Park, S. K. Jeong, S. H. Hong and S. C. Hong, Ind. Eng. Chem. Res., 2001, 40, 4491–4495 CrossRef CAS .
- L. Qiu, J. Meng, D. Pang, C. Zhang and F. Ouyang, Catal. Lett., 2015, 145, 1500–1509 CrossRef CAS .
- Y. Zhang, W. Guo, L. Wang, M. Song, L. Yang, K. Shen, H. Xu and C. Zhou, Chin. J. Catal., 2015, 36, 1701–1710 CrossRef CAS .
- L. Chen, J. Li, M. Ge and R. Zhu, Catal. Today, 2010, 153, 77–83 CrossRef CAS .
- H. Xu, Z. Qu, C. Zong, F. Quan, J. Mei and N. Yan, Appl. Catal., B, 2016, 186, 30–40 CrossRef CAS .
- C. He, B. Shen and F. Li, J. Hazard. Mater., 2016, 304, 10–17 CrossRef CAS PubMed .
- X. Zhu, B. Li, J. Yang, Y. Li, W. Zhao, J. Shi and J. Gu, ACS Appl. Mater. Interfaces, 2015, 7, 223–231 CAS .
- F. Zhang, C. Chen, W.-M. Xiao, L. Xu and N. Zhang, Catal. Commun., 2012, 26, 25–29 CrossRef CAS .
- B. Shen, F. Wang and T. Liu, Powder Technol., 2014, 253, 152–157 CrossRef CAS .
- P. Wang, H. Zhao, H. Sun, H. Yu, S. Chen and X. Quan, RSC Adv., 2014, 4, 48912–48919 RSC .
- S. Zhang, H. Liu, C. Sun, P. Liu, L. Li, Z. Yang, X. Feng, F. Huo and X. Lu, J. Mater. Chem. A, 2015, 3, 5294–5298 CAS .
- H. Jiang, C. Wang, H. Wang and M. Zhang, Mater. Lett., 2016, 168, 17–19 CrossRef CAS .
- R. Das, P. Pachfule, R. Banerjee and P. Poddar, Nanoscale, 2012, 4, 591–599 RSC .
- J. M. Zamaro, N. C. Pérez, E. E. Miró, C. Casado, B. Seoane, C. Téllez and J. Coronas, Chem. Eng. J., 2012, 195–196, 180–187 CrossRef CAS .
- K. K. Yee, N. Reimer, J. Liu, S. Y. Cheng, S. M. Yiu, J. Weber, N. Stock and Z. T. Xu, J. Am. Chem. Soc., 2013, 135, 7795–7798 CrossRef CAS PubMed .
- S. Ding, F. Liu, X. Shi and H. He, Appl. Catal., B, 2016, 180, 766–774 CrossRef CAS .
- V. P. Fallya, H. Vidalb, J. Kasparb, G. Blancoc, J. M. Pintadoc, S. Bernalc, G. Colond, M. Daturie and J. C. Lavalleye, Catal. Today, 2000, 59, 373–386 CrossRef .
- H. Chang, X. Chen, J. Li, L. Ma, C. Wang, C. Liu, J. W. Schwank and J. Hao, Environ. Sci. Technol., 2013, 47, 5294–5301 CrossRef CAS PubMed .
|
| This journal is © The Royal Society of Chemistry 2017 |
Click here to see how this site uses Cookies. View our privacy policy here. 
 Open Access Article
 This Open Access Article is licensed under a
  *a,
Xiaoqi Zhanga,
Fumei Wanga,
Guilong Chib and
Meng Sia
*a,
Xiaoqi Zhanga,
Fumei Wanga,
Guilong Chib and
Meng Sia
 has been proven to be one of the most effective approaches for NO removal.11–13 Many transition metal oxides have been developed as NO-reduction catalysts. Among these, manganese oxides exhibit a significant enhancement in NO conversion at low temperatures.14–16 Cerium oxides have also been proven to be very effective during NO conversion due to their excellent redox behavior.16–18 Moreover, a synergistic improvement between Mn and Ce has been found in the mixed Mn–Ce catalysts.19–22 Various supporting materials, including carbon nanotubes,23 pillared-clay,20 glass-fiber,24 and zirconium oxide,25 have been employed for Mn–Ce loading and have exhibited high catalytic performance.