 Open Access Article
Creative Commons Attribution 3.0 Unported Licence
Sorption performances of TiO(OH)(H2PO4)·H2O in synthetic and mine waters†
Mylène Trublet *a,
Marina V. Maslovab,
Daniela Rusanovaa and
Oleg N. Antzutkin
 a
a
aChemistry of Interfaces, Luleå University of Technology, 97187 Luleå, Sweden. E-mail: Mylene.Trublet@ltu.se; Tel: +46-920-493448
bTananaev Institute of Chemistry and Technology of Rare Elements and Mineral Raw Materials, Kola Science Center, Russian Academy of Sciences, Ferman St., 26a, Apatity, Murmansk region, 184209, Russian Federation
First published on 12th January 2017
Abstract
The sorption properties toward Cu2+, Zn2+, Ni2+, Mn2+ and Co2+ ions, in synthetic and industrial waters with pH of 3.9–7.2, and the chemical stability of a titanium phosphate ion-exchanger synthesized at mild conditions and containing solely –H2PO4 groups, TiO(OH)(H2PO4)·H2O (TiP1) are investigated. TiP1 displays the highest Na+ uptake (6.3 meq. g−1) among TiP ion-exchangers and a maximum sorption capacity of ca. 1.55 mmol g−1 (i.e. 3.1 meq. g−1) for the studied ions, which is higher than the ones reported for exchangers composed predominantly of –HPO4 groups. The sorption isotherms were best described by the Temkin model while the Langmuir and the Freundlich models appear to be insufficient in describing all data. TiP1 shows fast kinetics with an equilibrium reached within 10–20 minutes and diffusion processes play a role in the initial period of sorption that is overpowered by chemisorption reactions in the overall rate controlling step. The selectivity order of the metal ions on TiP1 is determined as: Cu2+ > Zn2+ ≫ Mn2+ > Co2+, Ni2+, following the order of stability of MOH+ complexes and the corresponding activation parameters for a water molecule exchange in [M(H2O)6]2+ ions. The surface sorption data are in good correlation with the EDS data for these systems, supporting the idea of chemical sorption with no metal hydroxide precipitation. Additional sorption studies show that the quality of industrial waters after sorption reaches the EU recommendation for drinking water. The faster kinetics and the higher exchange capacity reveal that the presence of –H2PO4 groups strongly enhances the sorption properties of titanium phosphate sorbents.
1. Introduction
In the areas of extensive production of copper and zinc concentrates, as in Northern Sweden, the quality of surface and underground waters in closed mines and of effluent waters is of vital importance for people's health and for the natural environment. Even though zinc and copper metals are among the essential elements, their metal discharge into free water must be kept at a very low level. The amount of accompanying (to the main metal concentrates) heavy metal ions such as Ni, Mn, Co, etc. should be kept in accordance with the latest EU environmental recommendations. Traditional methods for decreasing the amount of heavy metals in industrial waters include lime precipitation/coagulation when metal ions are present at high concentrations and then ultra-filtration combined with sorption on various ion-exchangers for additional fine purification.1,2 The choice of the technique is determined by the concentration of metal ions in the water and adsorption has been preferred as a method for levels below 1–10 mg L−1. The ion-exchange technique has been one of the most frequently enquired methods for final treatment of waters polluted by heavy metals. It often leads to almost complete removal of metal ions from the industrial waters when the sorbents have a high selectivity and broad pH compatibilities.3 The limitations of this technique are mostly governed by the physicochemical properties of ion-exchangers themselves; namely, their chemical and mechanical stabilities, pH ranges of use and selectivity diapason toward the different metal ions of interest.4The titanium(IV) based ion-exchangers (Ti-IE) and especially amorphous titanium phosphates (aTiP) have caught the researchers' attention due to their high selectivity toward transition metal- and radioactive ions, their excellent thermal and radiation stabilities and resistance to oxidation.5–7 The ion-exchange behavior of these systems is governed by (i) the number of exchangeable ions, (ii) the structural features of the TiP matrix as well as (iii) the porosity characteristics of TiP sorbents and all these play different roles in the diffusion of metal ions into complex structures of Ti-IE.
It has been observed that the synthetic conditions of TiP-IE are often high temperature demanding, performed at hydrothermal conditions and/or are time consuming.8–12 Furthermore, when the TiP sorbents are synthesized at relatively mild conditions (such as amorphous –HPO4 based sorbents) their ion-exchange capacities are somewhat low.13,14 The exchange capacities of TiP sorbents have also been found to depend considerably on the pH of the solution.15,16 Maslova et al. have reported that the cation exchange capacity of 1.00–1.65 meq. g−1 was observed at low pH for amorphous silica-modified TiP with general formula Ti(OH)2x(HPO4)2−x·ySiO2·nH2O,17 that is a relatively low capacity for these systems. Therefore, there is a need to develop a TiP sorbent that brings together relatively mild synthetic conditions and a relatively high ion-exchange capacity.
For the characterization of the actual cationic exchange sites of TiP-IE, which are directly related to the stoichiometric amount of exchangeable ions, direct and indirect potentiometric titration methods have been employed. It has been found that the total exchange capacity determined by different titration techniques depends clearly on the degree of crystallinity of the TiP sorbents, the Ti![[thin space (1/6-em)]](https://www.rsc.org/images/entities/char_2009.gif) :
:![[thin space (1/6-em)]](https://www.rsc.org/images/entities/char_2009.gif) P molar ratios and the sorbents' stability in alkaline conditions. For example, Troup et al. reported that the amount of exchangeable ions increases when the crystallinity of the material decreases.6,18–20 All these factors need to be taken into consideration when the titration data are analyzed.
P molar ratios and the sorbents' stability in alkaline conditions. For example, Troup et al. reported that the amount of exchangeable ions increases when the crystallinity of the material decreases.6,18–20 All these factors need to be taken into consideration when the titration data are analyzed.
Adsorption isotherms can be built with respect to any metal ions when purification of waters using different exchangers is considered. These curves show the amount of metal ions of interest uptaken by the ion-exchanger as a function of the metal ion at equilibrium concentration and at constant temperature. The most commonly found isotherms for the sorption of transition metals on TiP-IE belong to the Langmuir, and Freundlich types. It has been shown that for certain cases the sorption of s- and 3d-metal ions on TiP-IE can be described better with Langmuir isotherms than with Freundlich isotherms.14,21 Jia et al. have reported that lead(II) removal by TiP was better represented by the Langmuir model, while zinc(II) and cadmium(II) adsorption data could be well described by both models.22 Indeed, a mechanism of transition metal sorption on the TiP systems that would describe the processes in detail has not been established. It shall also be noted that our literature survey has found sorption data for various metal ions almost entirely on alpha-TiP (Ti(HPO4)2·H2O) and alpha-type TiP-IE, i.e. on sorbents containing –HPO4 functional units.4,10,13,17,21,23–25 Reports on sorption of transition metals ions on –H2PO4 based TiP-IE have been scarce and mostly related to the Ti2O3(H2PO4)·2H2O sorbent. The Temkin approach has not been explored for modeling the sorption processes on Ti-IE.
The model that describes the sorption reaction kinetics is essential to understand the rate of adsorption/desorption processes occurring during the water purification processes. For the 3d-metal ions, it has been shown that the main factor that determines the kinetics of ion-exchange reactions on Ti-IE relates to the fact of how strongly the metal ions interact with the functional groups of the sorbent.26 In other words, it should be established whether or not the process of chemisorption is the dominant rate-controlling step of the adsorption process that can overpower the diffusion processes. Experimentally, the rates at which metal ions are transferred from the bulk solution to the TiP particles, determine the efficiency of the adsorption. When the kinetics of sorption processes are analyzed, data are fitted with the different kinetic models. Kapnisti et al. have found that kinetics of cesium(I) ions sorption on TiP-IE can be well described using the pseudo-second order rather than the pseudo-first order model.14 Similarly, Ortíz-Oliveros et al. have concluded that sorption of Eu(III) on alpha-TiP is governed by chemisorption and follows the pseudo-second order reaction kinetics. They also have suggested that the intraparticle diffusion process appeared to play an important role in the two-stage sorption process.27 Whether chemisorption or diffusion is the preferred mechanism of ion exchange during water purifications, it should be emphasized that it is strongly related to the sorbent particle size and porosity characteristics which determine the sizes of the solvated ions that may enter the sorbent matrix.28
This work focuses on the applications of a titanium(IV) phosphate sorbent (TiP1), synthesized at relatively mild conditions and containing solely –H2PO4 functional groups. The sorption properties of TiP1 toward removal of Cu2+, Zn2+, Ni2+, Mn2+ and Co2+ ions from synthetic and industrially polluted waters were thoroughly investigated in different waters with pH 3.9–7.2. Batch experiments were used for these purposes and the equilibrium concentrations of these metals in solution before and after the sorption processes were determined. The contact time required for removal of these ions and the corresponding maximum metal uptakes were estimated. The results obtained were modeled using Langmuir, Freundlich and Temkin sorption isotherms. The surface of TiP1 was probed with EDS before and after sorption took place. To gain details of the sorption dynamics, kinetic experiments were also performed and data were evaluated using pseudo-first and pseudo-second order adsorption kinetic models as well as the liquid film and intraparticle diffusion models. Furthermore, the TiP1 sorbent was probed as a cation-exchanger on closed mine waters supplied by Boliden Mineral AB, Sweden.
2. Experimental section
2.1. Synthesis of TiO(OH)(H2PO4)·H2O ion-exchanger
For the synthesis of TiO(OH)(H2PO4)·H2O (abbreviated TiP1 in this article), an acidic solution of TiOSO4 (containing 82.4 g L−1 TiO2 and 542.7 g L−1 H2SO4) obtained by the method of Motov and Maximova29 was used as a source of titanium(IV).The sorbent was synthesized at mild conditions following the synthetic procedure reported by Trublet et al.8 Elemental analysis of TiP1 gave 40.21% and 36.89% of TiO2 and P2O5, respectively, which is in very good agreement with the theoretical values for the chemical formula of TiP1: TiO(OH)(H2PO4)·H2O. Further details regarding the synthesis and characterization of TiP1 can be found in Trublet et al.8
It has been shown that the modification of titanium phosphate ion-exchangers into an alkaline form increased their sorption capacity.15,16,30 Therefore, TiP1 in H+-form (H-TiP1, i.e. as synthesized) was mixed with a solution of 0.5 M Na2CO3 with a mass (g)![[thin space (1/6-em)]](https://www.rsc.org/images/entities/char_2009.gif) :
:![[thin space (1/6-em)]](https://www.rsc.org/images/entities/char_2009.gif) volume (mL) ratio = 1
volume (mL) ratio = 1![[thin space (1/6-em)]](https://www.rsc.org/images/entities/char_2009.gif) :
:![[thin space (1/6-em)]](https://www.rsc.org/images/entities/char_2009.gif) 50. The suspension was covered and kept under stirring at ambient conditions for 24 hours before being rinsed with deionized water until pH ∼ 6. The sodium uptake by H-TiP1 was determined using an Inductive Coupled Plasma Atomic Emission Spectroscopy (ICP-AES) by ALS Scandinavia AB, Luleå. The resulting sorbent loaded with sodium (Na-TiP1) was used for all the sorption experiments described in this study.
50. The suspension was covered and kept under stirring at ambient conditions for 24 hours before being rinsed with deionized water until pH ∼ 6. The sodium uptake by H-TiP1 was determined using an Inductive Coupled Plasma Atomic Emission Spectroscopy (ICP-AES) by ALS Scandinavia AB, Luleå. The resulting sorbent loaded with sodium (Na-TiP1) was used for all the sorption experiments described in this study.
2.2. Chemical stability of TiO(OH)(H2PO4)·H2O ion-exchanger
The chemical stability of H-TiP1 was studied using batch experiments at ambient conditions. The solid was inserted into solutions with different pH respecting a solid (g) to liquid (mL) ratio of 1![[thin space (1/6-em)]](https://www.rsc.org/images/entities/char_2009.gif) :
:![[thin space (1/6-em)]](https://www.rsc.org/images/entities/char_2009.gif) 50. The pH of the solutions, varying between 2 and 10, were adjusted with HCl or NaOH solutions. The mixtures were kept in closed vessels under constant stirring for 24 hours. The Ti and P amount in the filtrates were determined by ICP-AES and the degree of H-TiP1 hydrolysis for each element was calculated using eqn (1):
50. The pH of the solutions, varying between 2 and 10, were adjusted with HCl or NaOH solutions. The mixtures were kept in closed vessels under constant stirring for 24 hours. The Ti and P amount in the filtrates were determined by ICP-AES and the degree of H-TiP1 hydrolysis for each element was calculated using eqn (1):
 | (1) |
2.3. Potentiometric titrations of TiO(OH)(H2PO4)·H2O ion-exchanger
The direct titration of H-TiP1 with a strong base was carried out to determine the number of functional groups and the corresponding pKa values for this sorbent. H-TiP1 (0.1 g) was placed in 10 mL of deionized water. The mixture was equilibrated under constant stirring until the pH became stable. After equilibration, a standard solution of 0.100 M NaOH (titrant) was added using a burette. After each addition, the pH of the suspension was recorded when the pH changes were less than 0.01 units per min, using an Ag/AgCl-pH glass electrode. The addition of NaOH was continued until the pH of the solution reached 12.5.A similar titration of H-TiP1 in the presence of dissolved salt (0.1 M NaCl) was performed. In this case, the ion-exchange between H+ and Na+ was initiated before the titrant was added. Upon addition of NaOH, the solution was progressively neutralized, while the ion-exchange process was carried to completion. The resulting pH titration curve (Fig. S1 in the ESI†) was less defined than the direct titration curve in the absence of NaCl. Similar observation has also been described by Helfferich.31
For the indirect titration (Fig. S2 in the ESI†), 0.3 g of H-TiP1 was mixed with 50 mL of 0.100 M NaOH. After equilibration of the mixture, 20 mL of the liquid phase (filtrated using a syringe filter with 0.1 μm membrane) and 30 mL of the remaining H-TiP1 suspension were titrated separately with 0.100 M HCl. The addition of HCl was continued until the pH of the solution reached ca. 1.6.
The Hendersson–Hasselbach equation was used to determine pKa1 and pKa2 of H-TiP1:26
 | (2) |
All pKa values discussed in this study are based on the data from these titrations.
2.4. Adsorption isotherms and kinetics modeling
For all sorption experiments, commercial sulfate salts (ZnSO4·7H2O, CuSO4·5H2O, MnSO4·H2O, CoSO4·7H2O and NiSO4·7H2O) were used as sources of metal ions as received. The pHs of the solutions were between 4.2 and 5.9 (for sorption isotherms) and 3.9–7.2 (for kinetics and industrial water sorption experiments). To determine the sorption capacity of the TiP1 sorbent toward Zn2+, Cu2+, Ni2+, Co2+ and Mn2+, sorption studies were performed using 40 mL of metal solutions with 0.2 g of Na-TiP1. The experiments were performed in duplicate for eight different starting concentrations (1, 2.5, 5, 7, 9, 10, 15, 20) × 10−3 mol L−1. For each metal ion, the suspensions were stirred continuously for 24 hours to ensure that equilibrium was reached and were then filtered. The pH of the filtrates were measured (pH ∼ 4.1–6.0) and found to be in similar range as the starting pH values. The final metal concentrations remaining in the filtrates were determined using ICP-AES by ALS Scandinavia AB, Luleå. The amount of each metal ion adsorbed by Na-TiP1, qe (mg g−1), was calculated by the following equation:
 | (3) |
Adsorption data for Zn2+, Cu2+, Ni2+, Co2+ and Mn2+ ions were analyzed and were modeled using Langmuir, Freundlich and Temkin adsorption curves.
The Langmuir model is expressed using the following linearized equation:32
 | (4) |
The linearized equation of the Freundlich model is expressed as follows:33
 | (5) |
![[thin space (1/6-em)]](https://www.rsc.org/images/entities/char_2009.gif) qe versus ln
qe versus ln![[thin space (1/6-em)]](https://www.rsc.org/images/entities/char_2009.gif) Ce.
Ce.
The Temkin model is described by the following linearized equation:34
qe = B![[thin space (1/6-em)]](https://www.rsc.org/images/entities/char_2009.gif) ln(AT) + B ln(AT) + B![[thin space (1/6-em)]](https://www.rsc.org/images/entities/char_2009.gif) ln(Ce) ln(Ce)
| (6) |
 , bT corresponds to the difference in enthalpy between the zero and the full coverage (J mol−1), R is the universal gas constant (8.314 J mol−1 K−1), T is the temperature in Kelvin and AT is the affinity at zero loading. A plot of qe vs. ln(Ce) enables the determination of the constants bT and AT from the slope and the intercept, respectively.
From the sorption isotherm experiments, the highest concentration at which the metal ions were completely adsorbed was estimated. It was found that the lowest concentration where complete removal of the ions was observed was 2.5 mM (for the cobalt ions). Therefore, the kinetic studies for each metal ion of interest were performed, in duplicate, using batch experiments, with an initial concentration in metal ions of 2.5 mM. The solutions of metal salts were added to the sorbent (Na-TiP1) at a mass (g) to volume (mL) ratio of m![[thin space (1/6-em)]](https://www.rsc.org/images/entities/char_2009.gif) :
:![[thin space (1/6-em)]](https://www.rsc.org/images/entities/char_2009.gif) V = 1
V = 1![[thin space (1/6-em)]](https://www.rsc.org/images/entities/char_2009.gif) :
:![[thin space (1/6-em)]](https://www.rsc.org/images/entities/char_2009.gif) 200. The mixtures were kept under stirring for 2.5, 5, 7.5, 10, 15, 20, 30, 45 and 60 minutes before being filtrated and analyzed for metal content.
200. The mixtures were kept under stirring for 2.5, 5, 7.5, 10, 15, 20, 30, 45 and 60 minutes before being filtrated and analyzed for metal content.
The experimental data obtained were fitted to the pseudo first-order and pseudo second-order reaction models, and to the liquid film and intraparticle diffusion models in order to validate the most probable sorption dynamics.
The pseudo-second order kinetics is expressed by the following linearized equation:35
 | (7) |
The mathematical models describing the pseudo first-order and the two diffusion kinetic models tested in this study are provided in the ESI.†
2.5. SEM and EDS characterization
The morphology and the chemical composition of TiP1, before and after sorption, were studied by scanning electron microscopy (SEM, Magellan 400, FEI Company) and by energy dispersive spectrometry (EDS, 80 mm2 X-max detector, Oxford Instruments), respectively, at an accelerating voltage of 15 kV. The samples were coated with carbon before the SEM and EDS analyses and the calibration was done using copper sheet.3. Results and discussion
3.1. Chemical stability and potentiometric titrations of TiP1
The chemical stability is an important operational characteristic of a sorbent. The chemical stability of H-TiP1 was investigated in a wide pH range using batch experiments. The effect of pH (ranging from 2 to 10) on the hydrolysis of the sorbent is shown in Fig. 1. It can be seen that the amount of Ti(IV) units released into the aqueous solutions is insignificant and remains close to 0% for pH from 2 to 10. The hydrolysis of P-units shows that maximum 2.5% of the corresponding groups are liberated in the entire pH range. This fact is likely related to the gradual displacement of phosphate groups by hydroxyl groups when pH increases. At low pH (2–4) the degree of hydrolysis is only 1.3–1.8%. H-TiP1 was synthesized at very acidic conditions, pH < 1, which could explain its greater stability at lower pH values. A similar behavior has been reported for amorphous titanium hydroxophosphate (aTiP) although the maximum hydrolysis of P-units (ca. 3.0%) was observed for pH higher than 3.24 Another study on TiP-IE showed that the sorbent was hydrolyzed up to 4% at pH between 2 to 6 (for 24 h) before a dramatic increase of hydrolysis up to 14% at pH = 7.36 Such drastic dissolution of the amorphous TiP1 was not observed in the present study and the sorbent is considered relatively stable in acidic and neutral conditions whilst it moderately deranges P-units in basic media.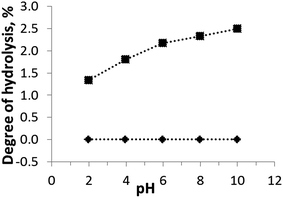 | ||
| Fig. 1 Effect of pH on TiP1's stability in aqueous solutions. Amounts of (♦) Ti and (■) P calculated using eqn (1). The lines are a guide for the eye. | ||
The direct titration curve of H-TiP1 is shown in Fig. 2a. Upon the addition of NaOH, the two protons from the –H2PO4 groups exchange with Na+ ions according to the reactions (R.1) and (R.2).
| TiO(OH)(H2PO4) + Na+ ↔ TiO(OH)(HNaPO4) | (R.1) |
| TiO(OH)(HNaPO4) + Na+ ↔ TiO(OH)(Na2PO4) | (R.2) |
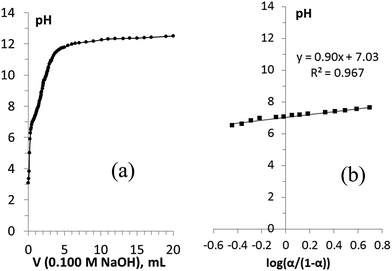 | ||
| Fig. 2 (a) The pH titration curve (direct titration) of TiP1 with NaOH and (b) determination of pKa2 following the Henderson–Hasselbalch equation. | ||
Two inflection points in the titration curve, corresponding to the two-stage reaction, can be therefore expected. A clearer inflection point is observed during the first step of the titration around pH = 5 suggesting that the first H+ from the –H2PO4 units is exchanged with Na+ (R.1). The second less prominent inflection point around pH = 8 indicates the ion-exchange between the second H+ and Na+ (R.2).
The ion-exchange capacity (IEC) of H-TiP1 relates to the degree of completion of the second reaction (R.2) when the Na+ exchange by the sorbent has reached its maximum. In the titration curve (Fig. 2a), it corresponds to the amount of Na+ ions added before reaching the plateau (observed at pH ∼ 12). From the titration data, the IEC for H-TiP1 is therefore estimated to be 6.0 meq. g−1 which corresponds to about 60% of the theoretical exchange capacity (TEC) calculated based on the chemical formula of TiP1 (10.2 meq.g−1). The first ion-exchange process between H+ and Na+ (R.1) occurs very early in the titration and thus it is not possible to determine an accurate value of pKa1 from the direct titration. As for the second ion-exchange process (R.2), pKa2 was determined using eqn (2) and the resulting plot is shown in Fig. 2b. The pKa2 value, related to the y-intercept, was estimated to be 7.0 which is in good agreement with pKa2 = 7.1–7.2 determined from the indirect titration of TiP1 (shown in Fig. S2, ESI†).
In general, the potentiometric titration curves in both cases are similar to the titration curves of phosphoric acid, i.e. PO43− → HPO42− → H2PO4− → H3PO4 protonation/deprotonation.
These results are in accordance with the presence of two functional groups in the chemical formula of TiP1: TiO(OH)(H2PO4)·H2O and clearly demonstrate the availability of the second proton to exchange during sorption processes with metal cations.
3.2. TiP1 and Na+ uptake
Measuring the sorption capacity toward Na+ is a traditional way to probe the sorption properties of an ion-exchanger. It has been reported that loading ion-exchangers with alkaline ions improved considerably their sorption characteristics and that the amount of exchangeable Na+ represented the actual IEC of the sorbents.15,16,30 In this work, the sodium form of TiP1 was obtained by treating H-TiP1 with 0.5 M Na2CO3 for 24 h, under stirring, at ambient conditions. Fig. 3 shows the comparison of the TEC and the Na+ uptake of various TiP-IE. It can be seen that TiP1 displays one of the highest TEC among the TiP sorbents and the Na+ uptake (for TiP1) was determined to be 6.3 meq. g−1 which is in very good agreement with the IEC calculated from the direct titration data (6.0 meq. g−1). This Na+ uptake represents ca. 62% of the TEC (10.2 meq. g−1) and is among the highest values (see Fig. 3) reported for TiP-IE in various studies.4,15,16,30,37,38 It has been shown that the conversion of aTiP into its alkaline form could result in a Na+ uptake from 2.5 to 3.8 meq. g−1, which is 44–67% of the TEC (estimated about 5.6 meq. g−1).17,38 This difference can be explained by the coexistence of different phases formed during the loading of Na+ into TiP1 matrix that may prevent the complete exchange between H+ and Na+. It has been reported for alpha-TiP that in similar conditions three phases were formed: α-Ti(HPO4)2, α-Ti(HPO4)(NaPO4), α-Ti(NaPO4)2 and that only at substantially high pH, up to 75% H+ to Na+ ion-exchange can be attained.4 Likewise, the formation of three phases in the case of TiP1 is most likely to happen: TiO(OH)(H2PO4), TiO(OH)(HNaPO4) and TiO(OH)(Na2PO4) and the latter one would start forming after pH > 6. It is also worth mentioning that partial hydrolysis of H-TiP1 could also occur (during Na2CO3 treatment), leading to phosphate groups partition and hence an experimentally obtained ion-exchange capacity lower than the calculated TEC.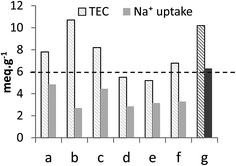 | ||
| Fig. 3 Comparison of the TEC and the average Na+ uptake of (a) α-TiP: Ti(HPO4)2·H2O,4 (b) Ti2O3(H2PO4)2·2H2O,30,37 (c) TiO1.25(OH)0.47(H2PO4)0.77(HPO4)0.13·2.3H2O,16,36 (d) aTiP: Ti(OH)1.36(HPO4)1.32·2.3H2O,24 (e) aTiP: Ti(OH)2(HPO4)·0.86H2O/Ti(HPO4)2,38 (f) aTiP: Ti(OH)1.2(HPO4)1.28(H2PO4)0.24·2.5H2O13 and (g) TiO(OH)(H2PO4)·H2O [this work]. | ||
This high Na+ uptake can also be related to the textural properties of the adsorbent that have been recently reported.8 It has an amorphous nature as confirmed by powder XRD and its structure remains almost unaltered until 200 °C despite the release of water molecules. The TiP1 sorbent possesses a surface area of 114 m2 g−1, which is substantially higher than the areas reported for various titanium phosphate sorbents.10,12,21,27,39 90% of this surface area is an external surface area which, combined with the mesoporous net of interconnected spaces, ensures the possibility of multiple ways of sorption.8
Thermodynamically, the H+/Na+ exchange has been studied only on alpha-TiP. It has been determined that with the increase of the temperature (from 25 to 55 °C), hydrolyses of the sorbent was increasing, leading to the formation of TiO2·nH2O species that could also become potential cationic exchanger (at pH > 6). It has also been found that the Gibbs free energy of the exchange processes  and
and  are both positive (14.0 kJ mol−1 and 20.8 kJ mol−1, respectively) although the beneficial negative enthalpy and entropy for the first process.40 Similar characteristic behavior can be expected for TiP1 where incomplete Na+ exchange is observed, although the formation of TiO2·nH2O is not anticipated at these conditions.
3.3. TiP1 sorption capacity and sorption isotherms modeling
Often the concept of metal uptake is considered only in terms of total amount of metal ions removed from waters without considering the possibility of precipitation of metal hydroxides at the conditions of experiment and data reported for exchanger capacity appear to be somewhat higher.30,41 To investigate adsorption processes in detail, pH controlled experiments and low concentrations of metal ions shall be applied. In this work, to determine the sorption capacity of Na-TiP1 toward divalent cations, salts of Zn2+, Cu2+, Ni2+, Co2+ and Mn2+ ions were used in a concentration range of 1–20 mmol L−1. The experimental data show a complete removal of these metal ions, at initial concentrations between 5 and 7 mmol L−1 for Zn2+, Cu2+, Ni2+ and Mn2+ and up to 2.5 mmol L−1 for Co2+. The experimental sorption data for these ions on Na-TiP1 compared with the Temkin, Langmuir and Freundlich model profiles are shown in Fig. 4. It can be seen that the experimental sorption isotherm curves show similar tendencies for all metal ions. The initial part of the curves is nearly vertical and bends in attempt to reach a plateau (between 1.4 and 1.6 mmol g−1) indicating somewhat saturation of the solid surfaces. These types of isotherms are called H (“High affinity”) curves: the metal ions have a great affinity toward the surface of the sorbent and are completely adsorbed at low initial concentrations.42 High affinity isotherms are not typically observed for TiP-IE. The amorphous TiP sorbents are often characterized with steady increasing sorption of L-type.14,17 To the best of our knowledge, these are the first reported sorption data for amorphous TiO(OH)(H2PO4)·H2O sorbent with only H2PO4-active exchange units, displaying H-type of sorption.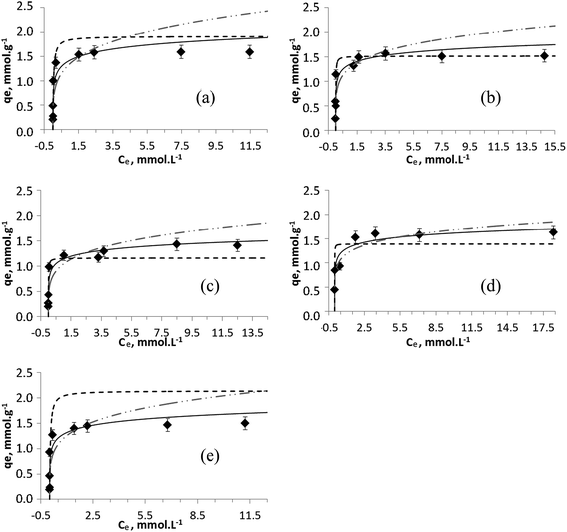 | ||
Fig. 4 Temkin (—), Langmuir (![[dash dash, graph caption]](https://www.rsc.org/images/entities/char_e091.gif) ) and Freundlich ( ) and Freundlich ( ) modeling of the experimental sorption data (♦) for (a) Zn2+, (b) Cu2+, (c) Ni2+, (d) Co2+ and (e) Mn2+ ions on TiP1. ) modeling of the experimental sorption data (♦) for (a) Zn2+, (b) Cu2+, (c) Ni2+, (d) Co2+ and (e) Mn2+ ions on TiP1. | ||
Table 1 displays the sorption parameters (including the correlation coefficient R2) related to the ion-exchange process of the metal ions on Na-TiP1 in accordance with all three models (Langmuir, Freundlich and Temkin). The Langmuir model describes the formation of a continuous monolayer of adsorbate molecules on the homogeneous surface of the adsorbents. In this model, the solid surface is assumed to contain a finite number of equivalent sites and each site can hold at most one metal ion. Once adsorbed, the metal ions are immobilized onto the surface and no interactions between them occur.32 The Freundlich model is one of the earliest empirical models describing the adsorption onto heterogeneous surfaces. It is based on the assumption of a multilayer sorption process with an exponential distribution of active centers.33 The Temkin model is an extension of the Langmuir adsorption model which considers interactions between the adsorbed molecules. It is based on a linear variation of the heat of adsorption with the degree of covering of the sorbent surface. According to this model, the weakest adsorbing sites are practically free of metal ions while the strongest adsorbing centers are nearly completely occupied.34 Among the three models, the Freundlich simulation gave the least satisfactory results when the model was compared to the experimental data with the exception of Co2+ ions where both models, Temkin and Freundlich gave acceptable fits (see R2 values in Table 1 and Fig. 4d). For the Langmuir and Temkin models, the correlation coefficient R2 is high and comparable (R2 ∼ 0.8–0.9 in Table 1). A good fit of sorption data implies that both qe data as a function of Ce and the corresponding linear plot should be in good agreement when one set of fitting parameters is used. Hence, it is important to take into consideration both the linear regression data (Fig. S3†) and the simulated isotherm curves for different model fittings when a final conclusion is drawn. A detailed look at the full sorption curves (Fig. 4) clearly reveals that all experimental data can be better modeled using the Temkin approach. The maximum capacities determined by Langmuir fits (qmax,calc in Table 1) for Zn2+, Co2+ and Ni2+ were found to be 1.8, 1.4 and 1.2 mmol g−1, respectively, while qmax,exp gave a sorption capacity of 1.6 for Zn2+ and Co2+ and 1.4 mmol g−1 for Ni2+. For Mn2+ ions, the difference in qmax,exp and qmax,calc is more than 30% while for Cu2+ ions there is a complete agreement where qmax was found to 1.5 mmol g−1 for both cases. The latter fact still needs to be considered in terms of overall fitting of the sorption data (in Fig. 4b) where the curvature of the Temkin model supports in larger extent all experimental data. The selectivity order of metal ions on TiP1 obtained from the Temkin model based on the difference in enthalpy between the zero and total coverage (bT, Jmol−1) is: Zn2+ > Cu2+ ≫ Co2+ > Mn2+ > Ni2+.
| Metal ions | Experimental qmax,exp (mmol g−1) | Temkin model | Langmuir model | Freundlich model | |||||||
|---|---|---|---|---|---|---|---|---|---|---|---|
| AT (L mg−1) | bT (J mol−1) | R2 | qmax,calc (mmol g−1) | qmax,calc (mg g−1) | b (L mg−1) | R2 | n | AF (mg g−1) (L mg−1)1/n | R2 | ||
| Zn2+ | 1.6 | 52.9 | 225.7 | 0.866 | 1.8 | 117.6 | 0.43 | 0.871 | 5.1 | 34.4 | 0.715 |
| Cu2+ | 1.5 | 243.0 | 287.5 | 0.883 | 1.5 | 96.6 | 1.55 | 0.998 | 5.8 | 37.6 | 0.768 |
| Ni2+ | 1.4 | 84.0 | 318.2 | 0.936 | 1.2 | 69.9 | 1.96 | 0.972 | 4.9 | 25.4 | 0.872 |
| Co2+ | 1.6 | 207.9 | 304.7 | 0.902 | 1.4 | 82.0 | 5.30 | 0.926 | 6.6 | 37.9 | 0.947 |
| Mn2+ | 1.5 | 126.6 | 311.3 | 0.827 | 2.0 | 108.7 | 0.50 | 0.843 | 5.2 | 30.1 | 0.662 |
It is also worth mentioning that all sorption experiments were performed using metal salts solutions with their intrinsic pH values varying from 4.2 to 5.9. These pH values ensure inability of the corresponding M(OH)2 precipitates to be formed. The influence of pH on the precipitation of metal hydroxides at the concentration range of M2+ (1–20 mmol L−1) used in this work is shown in Fig. S4 in the ESI.† These findings imply that the sorption data can be undoubtedly modeled using Langmuir, Freundlich and Temkin approaches.
3.4. TiP1 and synthetic water
In order to investigate further the properties of TiP sorbent with –H2PO4 functional units, an additional sorption experiment was performed with Na-TiP1. Five different metal salts (with 5 mmol of each metal) were mixed in one liter of deionized water. The solid TiP1 (g) to liquid (mL) ratio was chosen to 1![[thin space (1/6-em)]](https://www.rsc.org/images/entities/char_2009.gif) :
:![[thin space (1/6-em)]](https://www.rsc.org/images/entities/char_2009.gif) 250 and the concentration of each metal was determined before and after adsorption experiments. The experiment was done in duplicate and the uptake of the metal ions by TIP1, qe (mmol g−1), was calculated according to eqn (3).
250 and the concentration of each metal was determined before and after adsorption experiments. The experiment was done in duplicate and the uptake of the metal ions by TIP1, qe (mmol g−1), was calculated according to eqn (3).
Fig. 5 shows the maximum metal uptake of the five studied divalent ions by Na-TiP1 when all the metal ions are present in water in equal amounts. In this experiment, TiP1 removed in total ca. 1.57 mmol g−1 divalent metal ions which correlate well with the maximum sorption capacities determined from the sorption isotherms (see Fig. 4). This implies that the maximum exchange capacity of TiP1 is 3.1 meq. g−1 which is about 30% of the TEC and about 50% of the maximum IEC determined experimentally from the amount of exchangeable Na+. A similar observation have been reported for analogous titanium phosphates of formula: TiO1.25(OH)0.47(H2PO4)0.77(HPO4)0.13·2.3H2O where the experimental exchange capacity was found to be 2.6–2.8 meq. g−1 against 8.15 meq. g−1 for the TEC and 4.2–4.7 meq. g−1 for the IEC calculated from the Na+ uptake.15,16 The selectivity series for the metal ions on TiP1 was found to be: Cu2+ > Zn2+ ≫ Mn2+ > Co2+, Ni2+.
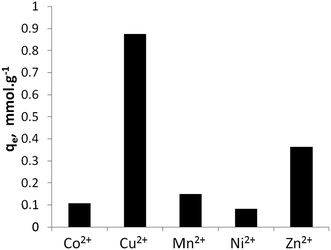 | ||
| Fig. 5 Equilibrium sorption capacities of TiP1 toward Co2+, Cu2+, Mn2+, Ni2+ and Zn2+ ions in a synthetic water. | ||
This selectivity order appears to follow the thermodynamic parameters of a water molecule exchange in [M(H2O)6]2+ complexes and somewhat to be related to the formation of MOH+ species in solution (as given in Table 2). These data indicate that the sorption of transition metal ions on TiP1 can be going through a step of outer-sphere-complex formation on the sorbent surface via labile metal complexes, involving interchange of coordinated water molecules. The rate of complex formation could be the factor determining the affinity of metals ions to the surface of TiP1 sorbent. It is interesting to note that somewhat similar order of metal ion selectivity (Cu2+ ≈ Zn2+ ≈ Mn2+ > Ni2+ > Co2+) was determined on alpha-TiP in a crystallographic study by Szirtes et al.39 and it had been related to the increasing of interlayer distance after the metal uptake due to “pristine alpha-phase in a mixture with transition metal containing forms” which did not change substantially the crystal parameters of alpha-TiP.
| Ions activation parameters | [Cu(H2O)6]2+ | [Zn(H2O)6]2+ | [Mn(H2O)6]2+ | [Co(H2O)6]2+ | [Ni(H2O)6]2+ |
|---|---|---|---|---|---|
| ΔH, kJ mol−1 | 11.5 | 15.9 (ref. 44) | 32.9 | 46.9 | 56.9 |
| ΔS, J K−1 mol−1 | −21.8 | — | 5.7 | 37.2 | 32.0 |
| k, 298 K, s−1 | 4.4 × 10⁹ | 2 × 10⁷ (ref. 45) | 2.1 × 10⁷ | 3.2 × 10⁶ | 3.2 × 10⁴ |
| ΔG, kJ mol−1 calc. for 298 K | 17.9 | 17.6–19.2 (ref. 46) | 31.2 | 35.8 | 47.4 |
![[thin space (1/6-em)]](https://www.rsc.org/images/entities/char_2009.gif) |
|||||
lg![[thin space (1/6-em)]](https://www.rsc.org/images/entities/b_char_2009.gif) K, MOH+ K, MOH+ |
|||||
| Ref. 47 | 6.3 | 5.0 | 3.4 | 4.3 | 4.1 |
| Ref. 48 | 7.0 | 5.0 | 3.9 | — | 4.9 |
Furthermore, it is worth noting that the ΔG values for [Cu(H2O)6]2+ and [Zn(H2O)6]2+ complex are similar (17.9 and 17.6 kJ mol−1) as well as are the values for [Mn(H2O)6]2+ and [Co(H2O)6]2+ (31.2 and 35.8 kJ mol−1). Hypothetically speaking it means that there would be a competition during the sorption of these metals on the sorbent surfaces if all ions are present at a time and other factors may play an important role. Conversely, if sorption experiments are performed using one type of metal ions at a time then the order of selectivity may be different. In this study, it has been shown (Table 1) that according to bT coefficients in Temkin model (related to the enthalpy sorption of the metals ions to the sorbent surface) the following selectivity order is obtained  . That order appears different in a first instance to the order obtained from the synthetic water sorption on TiP1 (Cu2+ > Zn2+ ≫ Mn2+ > Co2+, Ni2+) but indeed it only reflects the small difference in the energy of a water molecule exchange in [M(H2O)6]2+ that make the metal ions to ‘swap places’. Such observation could not be made for Langmuir model data and the corresponding sorption data.
In Fig. 6, the maximum sorption capacities of an aTiP and TiP1 are compared. The sorption data reported for Na-aTiP are taken from Maslova et al.13 For the studied divalent ions, the highest sorption capacities for TiP1 obtained from the sorption isotherms is estimated to be between 1.4 and 1.6 mmol g−1 which corresponds to an averaged IEC of ca. 3.0 meq. g−1. Maslova et al. reported that the sorption capacities observed for various aTiP are about 0.5–0.7 mmol g−1 (corresponding to an IEC of 1.0–1.4 meq. g−1) for these divalent ions.13 The sorption capacity of TiP1 is thus nearly two to three times larger than for aTiP (where –HPO4 groups are the dominating exchange units). The ion-exchanger studied by Clearfield et al. of chemical formula TiO1.25(OH)0.47(H2PO4)0.77(HPO4)0.13·2.3H2O, containing mostly –H2PO4 functional units, has shown an IEC of 2.6–2.8 meq. g−1 which is somewhat smaller than the IEC of TiP1 in this study.16 For most of the aforementioned sorbents, the sorption isotherms were well described by the Langmuir model10,13,14,49,50 or Langmuir–Freundlich model51 but the Temkin model was not applied. It has also been reported that Dowex HCR S/S cation exchange resin could experimentally exchange about 2.6 meq. g−1 of Zn2+ and about 2.9 meq. g−1 of Ni2+ which is slightly less than for TiP1 studied here but in this case, the Freundlich and the Temkin models seemed to be both reasonably suitable for describing the sorption isotherm data.52 Thus, even if TiP1 does not reach its full ion-exchange capacity regarding the amount of exchangeable Na+, its IEC is considerably higher than the ones reported for other TiP-IE.
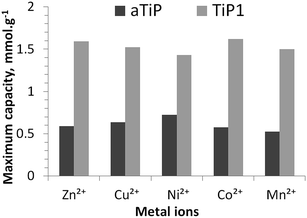 | ||
| Fig. 6 Maximum sorption capacities of aTiP: Ti(OH)1.2(HPO4)1.28(H2PO4)0.24·2.5H2O13 and TiP1 toward Zn2+, Cu2+, Ni2+, Co2+ and Mn2+ ions (both sorbents in their sodium forms). | ||
3.5. TiP1 and kinetics modeling
Several mathematical models have been proposed to describe the kinetics of ion-exchange reactions. The models have been generally classified either as adsorption reaction models or as adsorption diffusion models. The diffusion processes have been categorized as: (i) diffusion across the liquid film surrounding the adsorbent particles (namely liquid film diffusion) and (ii) diffusion in the pores and/or along the pore walls (a.k.a intraparticle diffusion). The adsorption reaction models (iii) pseudo-first and (iv) pseudo-second order originated from the kinetics of chemical reaction. The pseudo-second order model is based on the assumption that chemisorption is the rate limiting step and that the sorption capacity is proportional to the number of active sites occupied on the sorbent.51,53,54The kinetic sorption curves for each of the divalent ions, Zn2+, Cu2+, Ni2+, Co2+ and Mn2+ (with an initial concentration of 2.5 mM and intrinsic pH range from 3.9 to 7.2 at the end of the experiments) are shown in Fig. 7. For all cases, it can be seen that the kinetic process is relatively fast and that the equilibrium is reached within 10–20 minutes. Various TiP ion-exchangers (including Na-aTiP) have shown somewhat slower sorption kinetics with an equilibrium reached within 30–100 min for mono- and divalent ions.14,17,55 Therefore, it can be affirmed that TiP1 has improved sorption properties and has the fastest sorption kinetics compared to previously developed and tested TiP-IE, including aTiP.
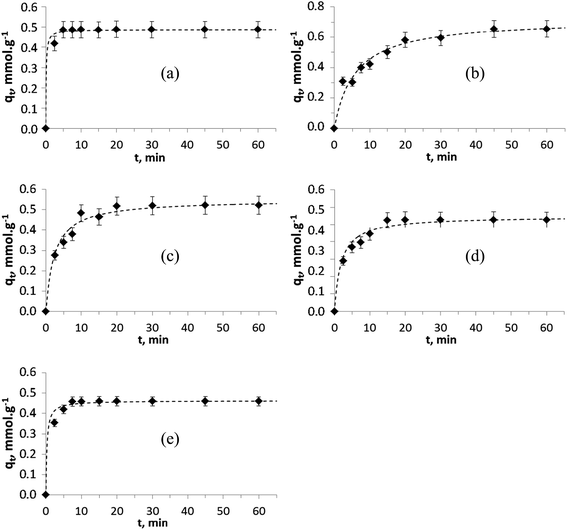 | ||
Fig. 7 Pseudo-second order modeling (![[dash dash, graph caption]](https://www.rsc.org/images/entities/char_e091.gif) ) of the experimental kinetic data (♦) for (a) Zn2+, (b) Cu2+, (c) Ni2+, (d) Co2+ and (e) Mn2+ ions on TiP1. ) of the experimental kinetic data (♦) for (a) Zn2+, (b) Cu2+, (c) Ni2+, (d) Co2+ and (e) Mn2+ ions on TiP1. | ||
In order to reveal the dynamics of the sorption mechanisms of metal ions onto ion-exchangers, the four aforementioned kinetic models were applied. The linear plots of the pseudo-second order model fitted to the experimental data for the different metal ions are shown in Fig. S5.†
The R2 coefficients and the parameters related to this model are gathered in Table 3. The pseudo-second order model gives a very good description of the sorption kinetic processes for each metal ion studied in this work and the correlation coefficients (R2) are all close to 1. The sorption capacities calculated with this model, qe,calc, are in very good agreement with the ones obtained from the experimental points, qe,exp. Thus, it can be concluded that chemisorption is most likely the rate limiting step of the ion-exchange reactions in the case of divalent ions on TiP1. Only a few other kinetic results of TiP-IE can be found in the literature proposing either pseudo-second order14 or diffusion processes24 as the rate determining steps in adsorption kinetics of TiP-IE.
| Metal ions | qe observed from the experimental data | Pseudo second-order parameters | ||
|---|---|---|---|---|
| qe,exp (mg g−1) | qe,calc (mg g−1) | k2 (g mg−1 min−1) | R2 | |
| Zn2+ | 31.9 | 31.9 | 0.2648 | 0.999 |
| Cu2+ | 41.6 | 45.9 | 0.0038 | 0.996 |
| Ni2+ | 30.7 | 32.3 | 0.0132 | 0.998 |
| Co2+ | 31.1 | 32.4 | 0.0167 | 0.998 |
| Mn2+ | 25.3 | 25.4 | 0.2367 | 0.999 |
Additionally, the pseudo-first order model and the two diffusion models have been tested in this study and the data are summarized for each metal ion in the ESI (Table S1, Fig. S6 and S7†). The data corresponding to the first stages of the sorption (10–20 min, i.e. before the plateau) were analyzed using the corresponding mathematical models and reasonable fits with R2 ∼ 0.7–0.9 were obtained. It can be seen that the sorption capacities calculated with the pseudo-first order model, qe,calc (in Table S1†), largely diverge from the experimental sorption capacities, qe,exp, (with the exception of Ni2+ ions) which indicates that the sorption reaction is not likely to follow the first order kinetics.56 As for the diffusion models, they have shown good fits for the early sorption steps. It is likely that the diffusion mechanism take part in the initial period of the sorption while chemical reactions have a substantial role in the overall process. A similar observation was made by Ortíz-Oliveros et al. where the sorption of Eu(III) on alpha-TiP was characterized by the pseudo-second order and the diffusion models.27 From a thermodynamic point of view it has been reported for amorphous TiP that increasing the temperature (from 20 to 50–60 °C) favors the adsorption of metal ions, as expected. The negative ΔG values (all between 18.9 and 20.5 kJ mol−1 for Zn2+, Ni2+ and Co2+, and 30.9 kJ mol−1 for Cu2+) indicated that the adsorption processes were facilitated by spontaneity in nature. All these data have been reported in relation to a pseudo-second-order kinetics of adsorption on aTiP.14,57
For all metal ions studied here, the data clearly show that over a longer period the pseudo-second order model gives the best correlation coefficient of all experimental data.
3.6. TiP1 and closed mine waters
Sorption experiments with three different waters from closed mines were performed, Water 1 (pH 3.9), Water 2 (pH 7.0) and Water 3 (pH 7.2); the waters with higher pH values had undergone a lime treatment before receiving. In these experiments, 0.2 g of Na-TiP1 was mixed with 50 mL of the waters and the concentrations of different metal ions before and after sorption were determined by ICP-AES. For comparison, sorption experiments using Na-aTiP sorbent with Water 1 was also performed. Table 4 displays the starting (C0) and the equilibrium concentrations of different metal ions after the sorption experiments. The EU recommendation levels for various elements, listed in Table 4, were taken from the EU regulations of drinking water which also apply to effluent waters. It is important to note that Na-TiP1 (and Na-aTiP for Water 1) gives water quality results that reach most of the European emission recommendations at ppm levels. Only manganese and calcium ions could, in some cases, remain above the EU guidance lines. Indeed, the starting concentration of manganese ions in Water 1 is about 4.64 mg L−1 while the EU recommendations require a minimum amount of 0.05 mg L−1. After sorption experiments with Na-aTiP and Na-TiP1, the final concentrations were measured from 0.35 (Na-aTiP) down to 0.02 mg L−1 (Na-TiP1) which corresponds to ca. 99% of Mn2+ ions removed. A similar observation was made for Water 2 where the starting concentrations of Mn2+ ions was 17.20 mg L−1 and was lowered to 0.42 after sorption on Na-TiP1. In the case of calcium ions, the starting concentrations were relatively high in the three waters (182 mg L−1, 384 mg L−1 and 1180 mg L−1 for Water 1, Water 2 and Water 3, respectively, related to the lime pretreatment performed at the mine site). The equilibrium concentrations after sorption with Na-TiP1, were reduced to 2.9, 87.3 and 923.0 mg.L−1, respectively, while the EU recommendations for calcium ions is 100 mg.L−1. In the case of zinc ions (C0 ∼ 10.7 mg L−1 for Water 1 and Water 2), the studied Na-TiP1 sorbent has shown to have very good sorption properties by lowering the concentrations down to 0.05–0.02 mg L−1 which is below the EU guidance lines of 1.5 mg L−1. Similar observations were made for aluminum, cadmium, copper and iron ions where the starting concentrations were in some cases above the EU recommendations and were lowered to reach the European directives.| Elements | Recommended concentrations | Water 1 | Water 2 | Water 3 | ||||
|---|---|---|---|---|---|---|---|---|
| C0 | Na-aTiP | Na-TiP1 | C0 | Na-TiP1 | C0 | Na-TiP1 | ||
| a n.a: not applicable.b Data collected from European directive 98/83/EC.c Data collected from European directive 80/778/EEC.d Data collected from US Environmental Protection Agency. | ||||||||
| Cac | 100 | 182.0 | 95.40 | 2.90 | 384.00 | 87.30 | 1180.0 | 923.0 |
| Feb | 0.2 | 1.940 | 0.026 | 0.008 | 0.090 | 0.004 | 0.254 | 0.024 |
| Kc | 12 | 9.530 | 0.500 | 1.350 | 3.480 | 0.885 | 9.640 | <0.003 |
| Mgc | 50 | 50.90 | 50.80 | 33.00 | 18.30 | 17.00 | 7.710 | 7.680 |
| Alb | 0.2 | 7.960 | 0.044 | 0.035 | 0.011 | 0.010 | 0.765 | 0.069 |
| Cdb | 0.005 | 0.039 | 0.000 | 0.000 | 0.002 | 0.000 | 0.001 | 0.000 |
| Cub | 2.0 | 4.250 | 0.023 | 0.018 | 0.022 | 0.005 | 0.029 | 0.006 |
| Mnb | 0.05 | 4.640 | 0.352 | 0.021 | 17.20 | 0.42 | 0.066 | 0.006 |
| Nib | 0.02 | 0.165 | 0.053 | 0.006 | 0.102 | 0.013 | <0.0005 | <0.0005 |
| Pbb | 0.01 | 0.02 | 0.00 | 0.00 | 0.00 | 0.00 | 0.00 | 0.00 |
| Srd | 4 | 0.23 | 0.028 | 0.004 | 0.36 | 0.00 | 0.83 | 0.399 |
| Znc | 1.5 | 11.7 | 0.09 | 0.05 | 9.69 | 0.02 | 0.16 | 0.064 |
| IEC (meq.g−1) | n.a | 1.6 | 3.1 | n.a | 4.0 | n.a | 3.3 | |
The experimental IEC for Na-TiP1 toward all metal ions present in mining waters was estimated to be about 3.1–3.3 meq. g−1 for Water 1 and 3. It represents about 50–63% of the Na+ uptake by the sorbent and it is in the same range as the IEC obtained from the sorption isotherms (∼3.0 meq. g−1) and the synthetic water (3.1 meq. g−1) data shown in this study. The IEC obtained for Water 2 was found to be 4.0 meq. g−1. Such difference in the IEC can be related to both the water composition and the individual metal ion concentrations in the waters (called “effect of the metal mixture”) and indicates that the total metal content in the waters shall be taken into consideration when sorption performances of TiP sorbents are analyzed. The sorption data for Na-aTiP shows an IEC of about 1.6 meq. g−1 (see Table 4) which is in accordance with previously reported ion-exchange capacities for analogous Na-aTiP (see Fig. 6).13 Regardless the fact that TiP1 only reaches about 30% of its TEC for such waters, it should be emphasized here that the uptake of heavy metal ions by Na-TiP1 is about 2–3 times higher than for Na-aTiP and is among the highest value reported for TiP-IE in various studies.13,15,16,21,23,30,37
3.7. EDS data and sorption processes
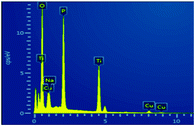
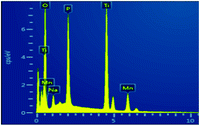
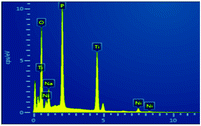
To investigate the sorption profile of Na-TiP1, samples before and after adsorption are compared using SEM/EDS techniques. The data for Na-TiP1 sample (i.e. the sample before adsorption) are shown in the ESI (Table S2 and Fig. S8†). Albeit the semi-quantitative nature of EDS the observed wt% for Na, P and Ti are in good agreement with the calculated wt% based on the formula of Na-TiP1 with 62% Na-exchange (as determined analytically) and the EDS mapping data confirms the existence of these elements. The data for M-TiP1 samples with adsorbed M = Cu2+, Mn2+ and Ni2+ are summarized in Table 5 (while the mapping data are enclosed in Fig. S9 in the ESI†). It shall be noticed that the EDS determined wt% of adsorbed metal ions are in the range of expectation of adsorbed metal ions (that are obtained from the sorption isotherms of the corresponding ions in the range of 7–9 mmol L−1). Discrepancy in the wt% can be ascribed to difference in the experimental point conditions and partial signal overlaps but in all cases it can be concluded that no precipitation of metal hydroxides had occurred (that if present would have resulted in much higher metal wt% in the samples).Similar experiment was performed on the sample that underwent adsorption of synthetic water containing Cu2+, Zn2+, Mn2+, Co2+ and Ni2+ ions. The data are displayed in Fig. 8. The wt% for Cu, Zn, Mn and Co metal ions as determined with EDS are in accordance with the wt% of metal ions as determined from the sorption data in Fig. 5 (Section 3.4.). Due to the overlapping of signals and the lowest amount of Ni2+ adsorbed (0.48%) on NaTiP1 it was not possible to distinguish its presence on the sorbent surface (although analytically the nickel amount was confirmed). The Ti/PO4 molar ratio is kept almost 1 in all cases confirming the stability of the structure and the different Na wt% reflect the decreasing amount of the Na-ions due to its replacement with metal ions.
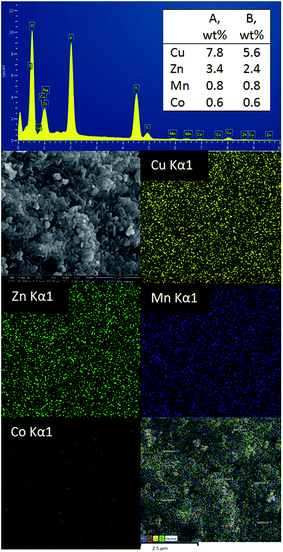 | ||
| Fig. 8 A SEM image and EDS analysis data of NaTiP1 sorbent after sorption with the synthetic water. (A) wt% determined with EDS and (B) wt% of the filtrates determined analytically. | ||
The TiP1 (H2PO4-exchanger) sorption performances when compared to the corresponding amorphous aTiP (HPO4-sorbent) can be summarized as follows: (i) it has almost 3 times higher IEC when transition metal ions sorption is considered and it shows more than 50% higher IEC when industrial waters are probed. Practically, it has also shown to be a very efficient sorbent for alkali-earth ions (Ca2+, Mg2+ and Sr2+) where aTiP had a mild effect on water content (as seen in Table 4); (ii) it can act in a pH range of 4–7 where the aTiP activity at ca. pH 6 is already less than 50% of the expected exchange capacity of 0.5–0.7 mmol g−1 (as also seen in the titration curves in Sahu et al.21); (iii) it has a higher chemical stability, does not considerably change its structure at elevated temperatures and can be easily obtained in amorphous form.
All findings point toward the fact that the sorption processes are naturally facilitated on this sorbent. The reasons for this can be related to the spatial arrangement of the H2PO4 groups in the structure that are expected to be exterior to the TiO6-matrix (similarly to the known structure of gamma-TiP), hence predisposing for bigger interlayer spacing. Thus, a sorption to take place via intercalation mechanism is also possible (which is hindered in the case of only HPO4 groups present). This can be related to the fact that only high affinity adsorption isotherms have been observed for TiP1 (and have not been reported for other TiP exchangers). The fact that it is able to perform at different conditions and on different type metal ions shows that the adsorption processes are most likely governed by similar mechanism involving formation of labile metal-aqueous species on the surface of TiP1.
4. Conclusions
The sorption behavior of divalent ions (Zn2+, Cu2+, Ni2+, Co2+ and Mn2+ ions) on amorphous TiP1, of chemical formula TiO(OH)(H2PO4)2·H2O, was studied in detail. The –H2PO4 functional groups of this ion-exchanger were characterized using potentiometric titrations. Indirect and direct titrations data allowed pKa-values of the exchangeable protons to be determined (as pKa1 = 7.0 and pKa2 = 2.2) and were found to be comparatively close to the pKa-values of the phosphoric acid thus disclosing the sorption active units of this sorbent. The chemical stability tests revealed that TiP1 was partially hydrolyzed (less than 2.5% in terms of P-units) in a wide pH range of 2–10. The adsorption isotherms for Zn2+, Cu2+, Ni2+, Co2+ and Mn2+ ions on Na-TiP1 sorbent were modeled using Langmuir, Freundlich and Temkin models. The results obtained when comparing Freundlich model with the experimental data were less conclusive than for the other two models. It was found that the Langmuir model could only fit the sorption data at low initial concentrations and that Temkin model could better depict the whole adsorption process on Na-TiP1 sorbent. Four different kinetic models were used to analyze the kinetics of the ion-exchange processes. Although the diffusion processes in the initial stages of the sorption appeared to play a role in the rate of the sorption of metal ions on Na-TiP1, the diffusion (liquid and intraparticle) and the pseudo-first order kinetic models could not well describe all experimental sorption data. The only model that could delineate the overall kinetics of sorption on Na-TiP1 was the pseudo-second order model suggesting that the chemisorption of metal ions on TiP1 was the rate limiting step. The sorption kinetics of the five metal ions studied here was somewhat faster than for other known ion-exchangers: sorption equilibrium was reached within 10–20 minutes. The sorption capacity of Na-TiP1 toward metal ions was determined experimentally to be ca. 3.1 meq. g−1, which is two to three times larger than the reported data for titanium phosphates composed mainly of –HPO4 groups. The selectivity series of the studied metal ions toward TiP1 was determined from the sorption experiments with the synthetic water and was established to be: Cu2+ > Zn2+ ≫ Mn2+ > Co2+, Ni2+. The order follows closely the order of decreasing rate constants and correspondingly changing thermodynamic parameters of a water molecule exchange in [M(H2O)6]2+. The TiP1 sorbent has also shown to be a very good cation-exchanger when batch experiments were performed using closed mine polluted waters. The resulting concentrations of various elements (including the studied metal ions) after adsorption on Na-TiP1 were below the European directive levels and the sorption capacities were in good agreement with the values found during the sorption. EDS data unveiled the adsorption processes on TiP1 and confirmed that no metal hydroxides precipitations were formed on the ion-exchanger's surface during the adsorption of metal ions.Acknowledgements
The authors thank the Swedish Research Council Formas and Boliden AB for the financial support of this work. The authors acknowledge the LTU based Centre of Advanced Mining and Metallurgy (CAMM2) for the partial financial support. We would also like to thank Assoc. Prof. Anna-Carin Larsson and Lic. Eng. Amirfarrokh Farzaneh for discussions. The foundation in memory of J. C. Kempe and S. M. Kempe is acknowledged for grants used for upgrading Chemagnetics CMX-360 NMR spectrometer. Assoc. Prof. J. Mouzon and Dr W. Aguilar are acknowledged for their initial guidance with SEM technique.References
- M. Gutiérrez, K. Mickus and L. M. Camacho, Sci. Total Environ., 2016, 565, 392–400 CrossRef PubMed.
- H. N. Muhammad Ekramul Mahmud, A. K. O. Huq and R. Binti Yahya, RSC Adv., 2016, 6, 14778–14791 RSC.
- T. A. Kurniawan, G. Y. S. Chan, W. Lo and S. Babel, Sci. Total Environ., 2006, 366, 409–426 CrossRef CAS PubMed.
- M. Qureshi and K. G. Varshney, Inorganic Ion Exchangers in Chemical Analysis, Taylor & Francis, 1991 Search PubMed.
- A. Clearfield and D. S. Thakur, Appl. Catal., 1986, 26, 1–26 CrossRef CAS.
- S. J. Naqvi, D. Huys and L. H. Baetslé, J. Inorg. Nucl. Chem., 1971, 33, 4317–4326 CrossRef CAS.
- X. S. Li, A. R. Courtney, W. Yantasee, S. V. Mattigod and G. E. Fryxell, Inorg. Chem. Commun., 2006, 9, 293–295 CrossRef CAS.
- M. Trublet, M. V. Maslova, D. Rusanova and O. N. Antzutkin, Mater. Chem. Phys., 2016, 183, 467–475 CrossRef CAS.
- J. Liu and X. Wei, RSC Adv., 2015, 5, 7798–7802 RSC.
- I. H. Chowdhury and M. K. Naskar, RSC Adv., 2016, 6, 67136–67142 RSC.
- Y. Li and M. Whittingham, Solid State Ionics, 1993, 63–65, 391–395 CrossRef CAS.
- Y. Bereznitski, M. Jaroniec, A. Bortun, D. Poojary and A. Clearfield, J. Colloid Interface Sci., 1997, 191, 442–448 CrossRef CAS PubMed.
- M. V. Maslova, A. S. Chugunov, L. G. Gerasimova and N. V. Konovalova, Radiochemistry, 2013, 55, 392–398 CrossRef CAS.
- M. Kapnisti, A. G. Hatzidimitriou, F. Noli and E. Pavlidou, J. Radioanal. Nucl. Chem., 2014, 302, 679–688 CrossRef CAS.
- A. I. Bortun, L. N. Bortun, A. Clearfield, S. A. Khainakov, V. V. Strelko, V. N. Khryashevskii, A. P. Kvashenko and I. I. Voitko, Solvent Extr. Ion Exch., 1997, 15, 515–532 CrossRef CAS.
- A. Clearfield, A. I. Bortun, S. A. Khainakov, L. N. Bortun, V. V. Strelko and V. N. Khryaschevskii, Waste Manag., 1998, 18, 203–210 CrossRef CAS.
- M. V. Maslova, D. Rusanova, V. Naydenov, O. N. Antzutkin and L. G. Gerasimova, Inorg. Chem., 2008, 47, 11351–11360 CrossRef CAS PubMed.
- A. Clearfield, W. L. Duax, A. S. Medina, G. D. Smith and J. R. Thomas, J. Phys. Chem., 1969, 431, 3424–3430 CrossRef.
- V. I. Ivanenko, E. P. Lokshin, R. I. Korneikov, S. V. Aksenova and V. T. Kalinnikov, Russ. J. Appl. Chem., 2008, 81, 760–764 CrossRef CAS.
- J. M. Troup and A. Clearfield, Inorg. Chem., 1977, 16, 3311–3314 CrossRef CAS.
- B. B. Sahu and K. Parida, J. Colloid Interface Sci., 2002, 248, 221–230 CrossRef CAS PubMed.
- K. Jia, B. Pan, Q. Zhang, W. Zhang, P. Jiang, C. Hong, B. Pan and Q. Zhang, J. Colloid Interface Sci., 2008, 318, 160–166 CrossRef CAS PubMed.
- X. Wang, X. Yang, J. Cai, T. Miao, L. Li, G. Li, D. Deng, L. Jiang and C. Wang, J. Mater. Chem. A, 2014, 2, 6718–6722 CAS.
- A. S. Chugunov, M. V. Maslova and L. G. Gerasimova, Radiochemistry, 2012, 54, 549–557 CrossRef CAS.
- S.-S. Li, D.-D. Han, T.-J. Jiang, Z. Guo, X.-J. Huang and J.-H. Liu, RSC Adv., 2016, 6, 72975–72984 RSC.
- K. Dorfner, Ion Exchangers, Walter de Gruyter, Berlin, 1991 Search PubMed.
- H. B. Ortíz-Oliveros, R. M. Flores-Espinosa, E. Ordoñez-Regil and S. M. Fernández-Valverde, Chem. Eng. J., 2014, 236, 398–405 CrossRef.
- A. A. Zagorodni, Ion Exchange Materials: Properties and Applications, Elsevier, 2006 Search PubMed.
- D. L. Motov, G. K. Maximova, Titanite and Its Chemical Processing for Production of Titanium Pigments, Nauka, Leningrad, 1983, p. 124 Search PubMed.
- A. I. Bortun, L. Bortun, A. Clearfield, M. A. Villa-García, J. R. García and J. Rodríguez, J. Mater. Res., 1996, 11, 2490–2498 CrossRef CAS.
- F. G. Helfferich, Ion Exchange, Dover Publications, 1962 Search PubMed.
- I. Langmuir, J. Am. Chem. Soc., 1916, 252, 2221–2295 CrossRef.
- H. M. F. Freundlich, Z. Phys. Chem., 1906, 57, 385–470 CAS.
- M. I. Temkin and V. Pyzhev, Acta Physicochim. URSS, 1940, 12, 327–356 CAS.
- Y. S. Ho and G. Mckay, Process Saf. Environ. Prot., 1998, 76, 332–340 CrossRef CAS.
- A. I. Bortun, J. García, T. A. Budovitskaya, V. V. Strelko and J. Rodríguez, Mater. Res. Bull., 1996, 31, 487–496 CrossRef CAS.
- H. Takahashi, T. Oi and M. Hosoe, J. Mater. Chem., 2002, 12, 2513–2518 RSC.
- M. V. Maslova, D. Rusanova, V. Naydenov, O. N. Antzutkin and L. G. Gerasimova, J. Non-Cryst. Solids, 2012, 358, 2943–2950 CrossRef CAS.
- L. Szirtes, L. Riess, J. Megyeri and E. Kuzmann, Cent. Eur. J. Chem., 2007, 5, 516–535 CAS.
- M. Suarez, J. R. Garcia and J. Rodriguez, J. Phys. Chem., 1984, 88, 159–162 CrossRef CAS.
- J. Oliva, J. De Pablo, J.-L. Cortina, J. Cama and C. Ayora, J. Hazard. Mater., 2011, 194, 312–323 CrossRef CAS PubMed.
- C. H. Giles, T. H. MacEwan, S. N. Nakhwa and D. Smith, J. Chem. Soc., 1960, 846, 3973–3993 RSC.
- L. Helm and A. E. Merbach, Chem. Rev., 2005, 105, 1923–1960 CrossRef CAS PubMed.
- T. J. Swift, Inorg. Chem., 1964, 3, 526–529 CrossRef CAS.
- R. Åkesson, L. G. M. Pettersson, M. Sandström and U. Wahlgred, J. Am. Chem. Soc., 1996, 116, 8705–8713 CrossRef.
- M. Hartmann, T. Clark and R. van Eldik, J. Am. Chem. Soc., 1997, 119, 7843–7850 CrossRef CAS.
- R. M. Smith and A. E. Martell, in Critical Stability Constants: Inorganic Complexes, Springer US, Boston, MA, 1976, pp. 1–129 Search PubMed.
- J. A. Dean, Lange's Handbook of Chemistry, 15th edn, 1998 Search PubMed.
- S. Mustafa, A. Naeem, S. Murtaza, N. Rehana and H. Samad, J. Colloid Interface Sci., 1999, 220, 63–74 CrossRef CAS PubMed.
- A. Naeem, S. Mustafa, N. Rehana, B. Dilara and S. Murtaza, J. Colloid Interface Sci., 2002, 252, 6–14 CrossRef CAS PubMed.
- M. Arshadi, M. J. Amiri and S. Mousavi, Water Resour., 2014, 6, 1–17 CrossRef.
- B. Alyüz and S. Veli, J. Hazard. Mater., 2009, 167, 482–488 CrossRef PubMed.
- C. Sutherland and C. Venkobachar, Int. Res. J. Plant Sci., 2010, 1, 107–117 Search PubMed.
- Y. S. Ho and G. McKay, Process Biochem., 1999, 34, 451–465 CrossRef CAS.
- K. Maheria and U. Chudasama, J. Indian Inst. Sci., 2006, 86, 515–525 CAS.
- Y. S. Ho and G. McKay, Chem. Eng. J., 1998, 70, 115–124 CrossRef CAS.
- S. Roca and C. Airoldi, Thermochim. Acta, 1996, 284, 289–297 CrossRef CAS.
Footnote |
| † Electronic supplementary information (ESI) available. See DOI: 10.1039/c6ra25410a |
| This journal is © The Royal Society of Chemistry 2017 |

