 Open Access Article
Creative Commons Attribution 3.0 Unported Licence
Recyclable Cu(I)/ZrSBA-15 prepared via a mild vapor-reduction method for efficient thiophene removal from modeled oil
Ce Gao,
Qingda An*,
Zuoyi Xiao and
Shangru Zhai *
*
Faculty of Light Industry and Chemical Engineering, Dalian Polytechnic University, Dalian 116034, China. E-mail: anqingda@dlpu.edu.cn; zhaisr@dlpu.edu.cn
First published on 20th January 2017
Abstract
Nowadays, processing of ultra-low sulfur fuel oil has been a hot topic of research all over the world; hence, an efficient adsorption process to tackle this issue is eliciting increasing attention. However, the preparation of high-performance adsorbents is still a challenge. Herein, zirconium-substituted mesoporous SBA-15 with highly dispersed active Cu(I) species has been successfully synthesized by our group at 493 K via a mild vapor-reduction method. The as-prepared material was characterized by powder X-ray diffraction (XRD), nitrogen adsorption and desorption, scanning electron microscopy (SEM), transmission electron microscopy (TEM), and UV-vis diffuse reflectance (DRUV) spectroscopy. All characterization methods demonstrated that the Cu(I) species were highly dispersed in an ordered mesoporous framework with short channels rather than piled on the surface. The as-prepared materials also exhibited an excellent adsorption capacity for thiophene (up to 29.86 mg g−1 at 323 K). Pseudo-second-order kinetics model and Freundlich isotherm can well describe the adsorption kinetics and isotherm data, respectively. More remarkably, an ultrasound-assisted treatment can be effectively employed to regenerate adsorbent, with only a slight reduction in the adsorption capacity after five cycles.
1. Introduction
With the standards of sulfur content in fuel oil becoming more stringent, designing effective methods to remove sulfur compounds in fuel oil has received significant attention from all over the world.1,2 China has promulgated the V fuel standards to control the sulfur content in fuel oil to below 10 ppm. In refineries, traditional catalytic hydrogenation desulfurization (HDS) is widely used. Unfortunately, some intrinsic shortcomings, such as high operating cost, large investment, and a non-environmentally friendly process, still cannot be overcome.3–5Over the past few decades, attempts have been made to develop many non-HDS techniques, including adsorptive desulfurization, extractive desulfurization, chemical oxidative desulfurization, biological oxidative desulfurization, and membrane separation technology.6–8 However, some of these new techniques still seem inadequate in removing thiophenic sulfur compounds, such as thiophene (TP), benzothiophene (BT), dibenzothiophene (DBT), and their alkyl-substituted derivatives, from the fuel oil.9,10 In one of our previous studies, we focused on removing oil using low-cost and efficient adsorbing materials with a superhydrophobic surface. This kind of superhydrophobic materials exhibit an excellent adsorption capacity to adsorb oil from water.11 Besides, in another previous research reported by our group, we used modified mesoporous materials to achieve ultra-low sulfur fuel oil, and the results demonstrated that adsorptive desulfurization (ADS) is an efficient technique for obtaining ultra-low sulfur fuel oil.12,13 Adsorptive desulfurization (ADS) process can efficiently remove thiophene, which is difficult to achieve with the current traditional HDS technology. Therefore, ADS can be considered as one of the most promising approaches with distinct advantages, including mild operating conditions and selective removal of refractory thiophenic sulfur compounds, over the abovementioned alternative technologies.14,15 However, although ADS possesses significant superiority, the fabrication/selection of efficient sorbents, which is key to this process, remains a difficult task.
Yang and coworkers developed a class of adsorbents that relied on π-complexation to selectively adsorb organic sulfur compounds from commercial fuels.16 However, according to the adsorption mechanism via direct sulfur–metal (S–M) interactions, Velu and coworkers found that the adsorbents exhibited a high selective adsorption for thiophene.17 However, steric hindrance effects made it difficult to adsorb 4,6-dimethyl-dibenzothiophene (DMDBT) and other thiophenic compounds. In view of this phenomenon, researchers believe that these two theories can be used for the choice of adsorbent. Furthermore, on the basis of the Lewis acid–base theory, Lewis bases include most thiophenic sulfur compounds, which can be easily attracted to the Lewis acid sites. Inspired by π-complexation and a Lewis acid–base theory, Yang and coworkers prepared a series of adsorbents that were able to yield ultra-low sulfur fuel oil by ion exchange (Ag+, Cu+). The adsorption process reflected the formation of π-complexation bond and direct sulfur–metal (S–M) interactions between S-compounds and metal species.16
Above all, one crucial factor, namely, the choice of adsorbent, can greatly influence the adsorption capacity and efficiency. To achieve the ideal state, a variety of adsorbents, such as ion-exchanged zeolites, metal oxides, metal–organic frameworks (MOFs), carbon-based materials, and mesoporous materials, were used in the desulfurization test.17–20 Amongst these, ordered mesoporous materials, especially SBA-15, have gained significant attention due to their large specific surface area, uniform internal pore structure, controllable pore size, and expected framework stability. By right of these characteristics, we prepared a series of ZrSBA-15 materials with short pore channels by isomorphic substitution, with the aim to design efficient Cu(I)-based sorbents for removing thiophene (TP) from modeled oil.21
As for the conversion of supported Cu(II) to Cu(I), the traditional method is high-temperature autoreduction (HTA), but it produces an unsatisfactory yield (below 50%) of Cu(I) and requires quite harsh conditions (973 K, 12 h) that are unsuitable for SBA-15-based sorbents.22 Qin reported an efficient and controllable strategy for the conversion of Cu(II) to Cu(I) by mild vapor-reduction (MVR).23 This strategy introduces a weak reductant (methanol), which diffuses into the pores and reduces the Cu(II) species and fabricates a higher yield of Cu(I) sites, with no conversion of pure copper, at quite low temperatures (493 K, 6 h).24 However, employing this mild yet efficient method to prepare Cu(I) supported SBA-15-based composites for thiophene removal during fuel clean-up processes has never been reported.
Over the past few decades, the organosulfur-adsorbing sorbents were generally regenerated using thermal methods, such as a recent report about the preparation of nickel-based adsorbents for producing ultra-low sulfur fuel oil.25 As it is known, the adsorptive process is generally conducted at room temperature; if the process of regeneration was conducted at quite high temperatures, it would have involved a lot of heat, which possibly would have led to a significant deterioration of the structures and sintering/aggregation of the active metal species.26,27 As a result, it is difficult for the process to operate. Besides, there is limited focus on studying the desulfurization performance over multiple adsorption–regeneration cycles. Thus, it is crucial to develop a process for the adsorption of organic sulfur compounds with a long term ability of adsorption and regeneration.
Herein, by employing ordered ZrSBA-15 with short pore channels and a tailored acidic framework as the supporting matrix, a series of Cu(I)/ZrSBA-15 composites were facilely prepared by methanol-vapor reduction. The whole preparation process for Cu(I)/ZrSBA-15 is illustrated in Scheme 1. The kinetics, three kinds of adsorption isotherms, and the conditions for regeneration related to the properties of our materials were also investigated in detail.
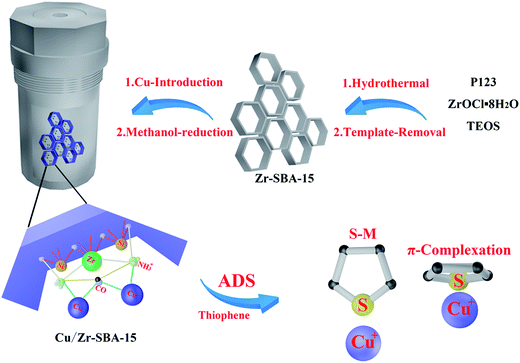 | ||
| Scheme 1 Illustration of the possible preparation procedures for the composites and schematic of the adsorption mechanism of TP molecules on 20% Cu/ZrSBA-15. | ||
2. Experimental section
2.1. Materials
All reagents and solvents were of analytical grade and used without further purification. Block copolymer P123 (EO20-PO70-EO20) was available from Aladdin Chemistry Co., Ltd., China. Tetraethyl orthosilicate (TEOS, 98%), Cu(NO3)2·3H2O, zirconium oxychloride (ZrOCl2·8H2O), urea (CON2H4), and HCl (37%) were purchased from Sinopharm Chemical Reagent Co., Ltd., China. Thiophene (99.5%) and n-octane were purchased from Kermel Reagent Co., Ltd., China.2.2. Preparation of ZrSBA-15 (Zr/Si = 0.05)
ZrSBA-15 with a platelet morphology and short mesoporous channels was prepared via a controllable synthetic method derived from a procedure reported by Chen et al.28 Block copolymer P123 (5.0 g) was designed as the structure-template agent and dissolved in water. The silicon source, TEOS (11 mL), was added dropwise to a well-mixed solution of P123 (5.0 g) and zirconium oxychloride (ZrOCl2·8H2O, 0.8 g) in HCl (37%, 30 mL) at 313 K. Then, the solution was stirred for about 24 hours, and afterwards, transferred and heated at 373 K for 24 h inside a Teflon-lined autoclave that was used as the aging vessel. Subsequently, the obtained white crystal-like precipitate was separated, thoroughly washed with distilled water, and then desiccated at 373 K for 10 hours. After calcining for six hours in air at 550 °C, the white supports (ZrSBA-15) were obtained.2.3. Preparation of Cu(II)/ZrSBA-15
Cu(NO3)2·3H2O (3.1 mmol) and urea (12 g) were dissolved in deionized water (200 mL) at ambient temperature to obtain an aqueous solution, and then ZrSBA-15 (1 g) was added to form a suspension.29–31 The suspension was continuously stirred for 7 hours at 363 K. Then, the precipitate was filtered out, washed with deionized water, and desiccated at 383 K overnight to afford the mesoporous material with a 20% copper loading capacity.Then, the copper loading amounts were changed to 2.34 mmol, 3.91 mmol, 4.69 mmol, and 5.47 mmol, and the abovementioned steps were repeated to obtain 15%, 25%, 30%, and 35% of the mesoporous materials, respectively.
2.4. Preparation of Cu(I)/ZrSBA-15
Cu(II)/ZrSBA-15 (0.1 g) was kept in an autoclave containing methanol (2.5 mL); there was no simple mixing between the solid and the liquid. The autoclave was then heated to 493 K and kept at this temperature for 6 h. After the autoclave naturally cooled down to ambient temperature, the obtained powder was immediately transferred outside and residual CH3OH was removed. The final material was kept in an inert atmosphere.2.5. Characterization
A Rigaku D/Max-2500 V/PC powder diffractometer equipped with Cu-Kα radiation (40 kV, 100 mA) was used to obtain the XRD patterns. A Quantachrome Autosorb NOVA 2000e analyzer was used to obtain the N2 adsorption–desorption isotherms at 77 K; the samples were all degassed at 523 K for 2 h before analyses. The BET method was used to calculate the specific surface area, and the volume of liquid nitrogen adsorbed was used to test the total pore volume at a relative pressure of 0.99 Pa. The Barrett–Joyner–Halenda (BJH) method was used to calculate the pore size distribution (PSD) and the pore diameter from the desorption branch. The molecular morphologies were determined by scanning electron microscopy (SEM, JSM-6460LV, JEOL, Japan) and transmission electron microscopy (TEM, JEM-2000EX, JEOL, Japan). X-ray photoelectron spectroscopy (XPS) was used to analyze the elemental distribution using the ESCALAB250 Scientific K-Alpha spectrometer (Thermo VG, USA) equipped with AlKα X-ray source (1486.6 eV).2.6. Adsorption test
At an appropriate temperature, we carried out a batch experiment. The modeled fuel with the concentration of TP ranged in between 35.2 and 352 mg L−1 (50–500 ppmw TP). The sorbents were degassed in a vacuum oven for about 10 hours at 383 K before adsorption. Then, 0.1 g of adsorbent was scattered with a 20 mL modeled fuel in a scintillation vial, and then the mixture was unceasingly stirred for 24 hours until the adsorption equilibrium was achieved. The adsorbent can be separated from the solution by filtration, and the remaining liquid was subsequently analyzed for the vestigial capacity of TP by a UV-vis spectrophotometer at a wavelength of 231 nanometer (UV-1600 PC, Shanghai Mapada Instruments, China). The data was obtained by calculating the mean value of the two experiments.To investigate the adsorption capacity of the adsorbent at different temperatures, we employed three adsorption isotherms, including Langmuir, Freundlich, and Temkin. The adsorption capacity at equilibrium was calculated according to the following formula:
For the kinetics study, modeled fuel (352 mg L−1, 20 mL) was used as the initial concentration of thiophene and 20% Cu/ZrSBA-15 (0.1 g) was scattered on it at a constant temperature. The residual TP concentrations were determined at equal time intervals (3 hours) until reaching the adsorption equilibrium. The removal efficiency can be calculated by the following formula:
2.7. The regeneration of adsorbents
We used an ultrasound-assisted method to regenerate the adsorbents and performed as expected according to the previous experiments. The adsorbents were separated by filtration at room temperature and mixed with 20 mL of n-octane by ultrasound twice.32,33 Then, the regenerated adsorbents were separated from n-octane and dried to obtain a powder. After finishing the abovementioned steps, the regeneration of adsorbents was performed.3. Results and discussion
3.1. Sample characterization
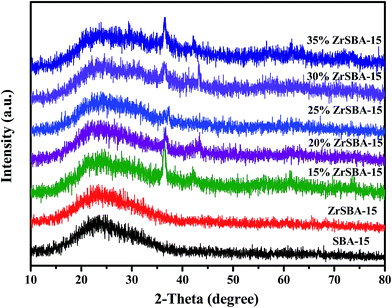
The wide-angle XRD patterns of the samples, as shown in Fig. 1, exhibited that the framework of the mesoporous materials is preserved after incorporating the zirconium and copper species, as observed after comparing the XRD patterns of SBA-15, ZrSBA-15, and Cu/ZrSBA-15 samples. Besides, each sample shows a broad peak at 2θ = 24°, which can be attributed to the characteristic peak of silicon dioxide. The peaks with 2θ values of 29°, 36° and 42°, 61°, and 73° conform to the crystal planes of 110, 111 and 200, 220, and 311 of crystal Cu2O and CuO, respectively.34,35,37 This means that Cu(I) has been successfully generated via the efficient, controllable mild vapor-reduction (MVR) process. On the other hand, the presence of Cu(II) can be attributed to the partial reoxidation of the reduced Cu(I) in air.The N2 adsorption–desorption isotherms and pore-size distribution of the as-prepared materials are depicted in Fig. 2. Noticeably, on the basis of the IUPAC classification, Fig. 2A shows that the adsorption isotherms were attributed to type IV with the existence of H1 hysteresis loops, which indicates that all samples have the typical features of an ordered SBA-15. A sharp inflection appears in the adsorption branch of each isotherm at the relative pressure values of 0.60–0.90, which indicates that capillary condensation occurs in the mesopores with a uniform pore size. Note that for the series of samples prepared using ZrSBA-15 as the matrix, upon increasing the capacity of Cu(I) loading, the shapes of the H1 hysteresis loops slightly changed. This demonstrates that the mesoporous structure became slightly rough with the introduction or coating of Cu(I) clusters or layers inside the pore walls of ZrSBA-15.
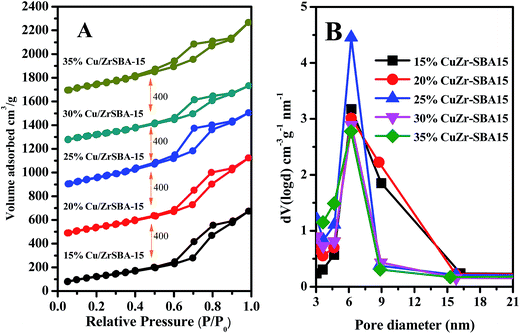 | ||
| Fig. 2 (A) N2 adsorption–desorption isotherms and (B) BJH pore size distributions of the studied samples. | ||
On the other hand, the pore size distribution curves with different pore diameters ranging from 5 to 9 nm are depicted in Fig. 2B, which indicates the uniform mesopores generated among the materials prepared by this method.
To have an intuitive understanding of the surface areas (SBET), pore volumes (VP), and pore diameters (DP) for all materials, the obtained data are shown in Table 1. An obvious increase in the surface area could be easily observed with the introduction of zirconium, which means that zirconium had been successfully introduced by the isomorphic substitution. With the increasing Cu capacity, we observed a gradual decrease in the surface area, pore volume, and pore diameter, which might be due to the partial pore roughness upon copper introduction or coating by the MVR process. Comparatively, it is shown that the Cu/ZrSBA-15 samples exhibited conflicting textural characteristics with different copper loading capacity. For copper loading capacity of 30%, the pore volume and specific surface area of the material clearly decreased. This can possibly be attributed to the formation of large aggregates of copper particles, which require a larger space, leading to a decrease in porosity, specific surface area, and pore size. On the other hand, the material with a copper loading of 20% exhibited a narrower pore diameter than both the materials with copper loading capacities of 15% and 25%, suggesting that a copper loading capacity of 20% is appropriate under the current preparation conditions.
| Sample | SBET (m2 g−1) | VP (cm3 g−1) | DP (nm) |
|---|---|---|---|
| SBA-15 | 617 | 1.01 | 6.4 |
| Zr-SBA-15 | 1051 | 1.00 | 7.3 |
| 15% Cu/Zr-SBA-15 | 455 | 1.06 | 6.2 |
| 20% Cu/Zr-SBA-15 | 522 | 1.14 | 6.2 |
| 30% Cu/Zr-SBA-15 | 465 | 0.82 | 6.2 |
Further information on the morphology and structure of the materials was obtained by scanning electron microscopy and transmission electron microscopy. From Fig. 3A and C, it can be observed that there are some differences between the morphological features of SBA-15 and ZrSBA-15. Namely, long parallel channels were still preserved in the rod-like morphology of SBA-15, whereas short parallel channels appeared in the hexagonal morphology of ZrSBA-15. Based on the isomorphic substitution method, Zr(IV) ions replaced the isomorphic silica molecules during the self-assembly process of P123 micelles and TEOS to generate the expected short channel mesoporous structure.36 The TEM images exhibited further evidence for the mesoporous structure of SBA-15 and short channels in the ZrSBA-15 structure, as shown in Fig. 3B and D, respectively. After introducing the active copper species, the mesoporous material still retained a stable structure, which can be distinguished from Fig. 3E and F. At the same time, no aggregation of active components was observed in the TEM images. Noticeably, this phenomenon clearly shows that the active component is highly dispersed in the mesoporous structure. The SEM and TEM images show that the prepared mesoporous materials exhibited excellent structural unity and a high dispersion of the active components. These results are consistent with the results obtained from the XRD patterns and the N2 adsorption–desorption isotherms.
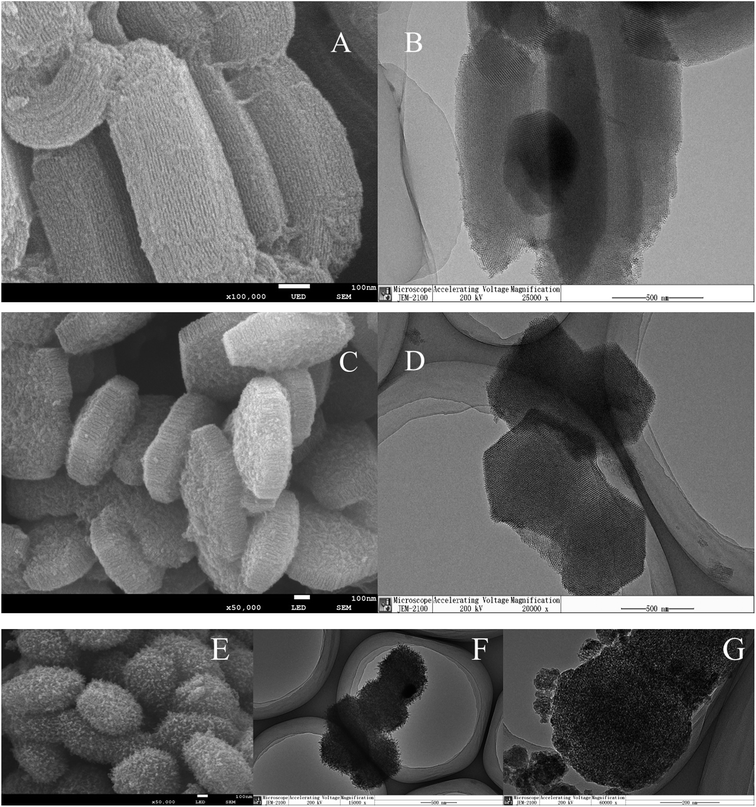 | ||
| Fig. 3 SEM and TEM images of the as-synthesized SBA-15 (A and B), ZrSBA-15 (C and D), and 20% Cu/ZrSBA-15 (E–G). | ||
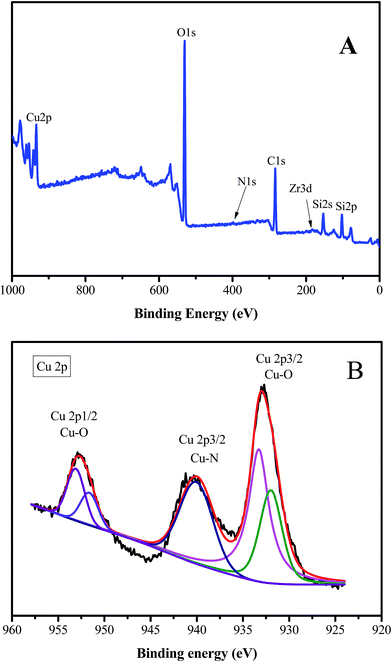
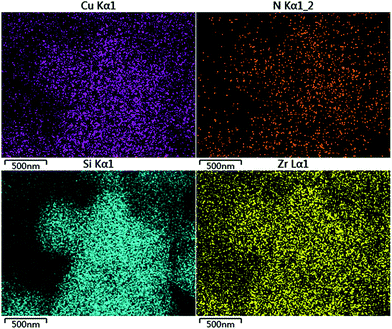
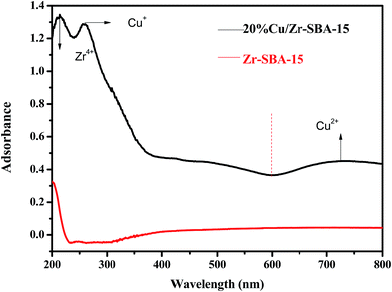
We further studied the correlation information of the chemical phase and elemental composition by X-ray photoelectron spectroscopy and SEM-mapping, respectively. The information obtained from X-ray photoelectron spectroscopy data demonstrated that the sample (Cu/ZrSBA-15) was composed of Si, O, C, N, Zr, and Cu (Fig. 4A), indicating that the expected elements had been incorporated. As shown in Fig. 4B, four peaks at 931.9, 933.2, 951.7, and 953.2 eV, obtained from curve-fitting, can be attributed to Cu 2p3/2+, Cu 2p3/22+, Cu 2p1/2+, and Cu 2p1/22+, respectively. In addition, the peak at 940 eV can be attributed to the shaking-up satellite peak attributed to the interaction of Cu2+ with N.37–39 SEM EDS-mapping results are shown in Fig. 5. We can clearly observe that the elements are well distributed, especially for copper, which demonstrates that the active species had been successfully introduced in the mesoporous structure via MVR. Furthermore, the UV-vis diffuse reflectance spectroscopy exhibited two valence states for copper in Cu/ZrSBA-15, which conformed to the XPS spectrum. The appearance of Cu(II) could be attributed to the partial reoxidation of Cu(I) in air.36,37,39,40
Considering the abovementioned characterization results, it can surely be inferred that the material prepared via the rational MVR method can exhibit the expected adsorption capacity by π-complexation and direct coordination (S–M) interaction, owing to the synergy of the retained ordered mesostructure and the high dispersion of copper species within it (Fig. 6).
3.2. Adsorptive desulfurization performance of the as-synthesized samples
The equilibrium adsorption data of Cu/ZrSBA-15 (Cu loading of 20, 25, and 30 wt%) for TP was collected and is displayed in Fig. 7. As shown in Scheme 1, the adsorption process occurs by π-complexation and S–M coordination interaction. On the basis of the two concepts, excellent results were obtained for the adsorption of TP. Compared to the copper loading capacities of 25% and 30% of the material in the tested adsorbents, the material with a copper loading capacity of 20% showed the highest adsorption capacity for TP, reaching 29.89 mg g−1. Although the other materials have a higher copper loading capacity, material with a copper loading of 20% showed a higher adsorption capacity for TP. The lower TP adsorption capacity in the samples with a higher Cu loading could be attributed to the higher copper loadings, leading to more steric hindrance such that not all Cu(I) could interact with the thiophenic compounds. Owing to the ordered mesoporous structure and the high dispersion of the active components, this material has excellent properties, as illustrated by the abovementioned results of the XRD patterns, N2 adsorption–desorption isotherms, scanning electron microscopy, and transmission electron microscopy.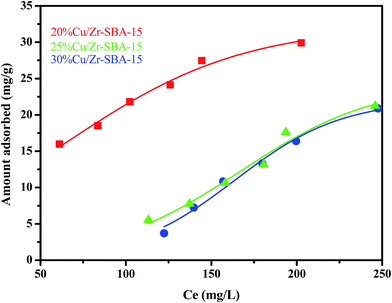 | ||
| Fig. 7 Adsorption isotherms for the TP adsorbed over different adsorbents (mass, 0.1 g; modeled fuel volume, 20 mL; adsorption time, 24 h; adsorption temperature, 50 °C). | ||
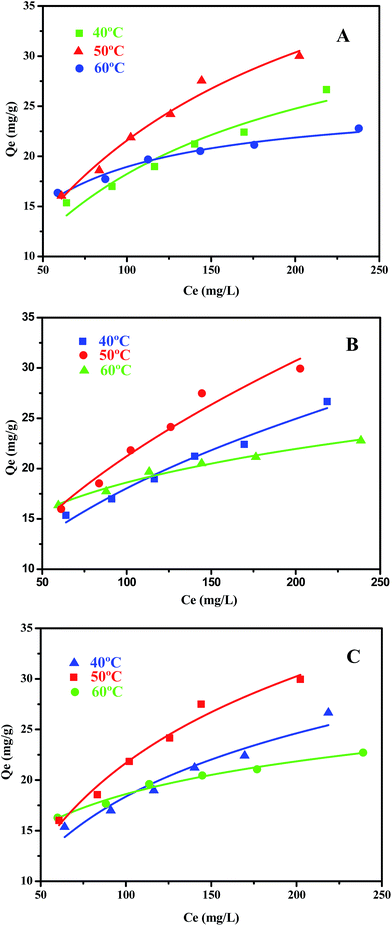
According to formulas (1) to (3), the adsorption data was fitted by Langmuir, Freundlich, and Temkin adsorption isotherms (Fig. 8). Because there is no direct connection between the adsorbate and adsorbent, the Langmuir adsorption isotherm shows that a monolayer with a homogeneous surface is formed on the surface of the adsorbent. The Freundlich adsorption isotherm is an empirical model, which shows that adsorption occurs on an uneven surface via a multilayer adsorption mechanism. In addition, there are direct interactions between the adsorbate molecules and the adsorbent sites. KF is the coefficient of Freundlich adsorption isotherm, and the adsorption intensity coefficient 1/n is used to determine the intensity and the feasibility of the adsorption. When 1/n is between 0.1 and 0.5, it can be shown that the adsorption process is feasible. When 1/n is greater than 2, the adsorption process is not feasible. For the existence of a strong positive and negative charge attraction phenomenon, Temkin adsorption isotherm is the best model. In addition, we also studied the shape of the adsorption isotherms to determine the feasibility of adsorption. RL is an important adsorption coefficient that is used to determine whether the adsorbent is suitable for the current adsorption process. When the value of RL is equal to 0, it indicates that the adsorption is irreversible, whereas the value of RL below 1 indicates that the adsorption process exhibits a linear trend. When the RL value is greater than 1, the adsorption is not feasible. The RL value can be calculated by the following formula (4):
 | (1) |
 | (2) |
| Qe = BT × ln(KF × Ce) | (3) |
 | (4) |
The coefficients obtained from the Langmuir, Freundlich, and Temkin isotherms at different temperatures are summarized in Table 2; three models are adopted with a linear fitting and are shown in Fig. 8A–C. As shown in Table 2, we could obtain the correlation coefficient (R2) for the three isotherms. The related coefficients (R2) for the Freundlich adsorption isotherm are slightly higher than those for the Langmuir adsorption isotherm, which means that the adsorption process occurs on the surface of the Cu/ZrSBA-15 material. Besides, due to π-complexation, TP molecules interact with each other, which conforms to the Freundlich isotherm. As for the Temkin isotherm, the corresponding R2 coefficients are close to 1, which means that the adsorption process occurs via π-complexation and S–M interactions between the adsorbate and the adsorbent. Upon increasing temperature, the Langmuir constant KL gradually increased, which means that higher temperature can promote the adsorption process on the surface of the material. However, high temperature is not necessarily suitable for the adsorption process. As shown in Table 2, the adsorption capacity at 50 °C (51.2 mg g−1) is higher than at 60 °C (25.818 mg g−1), which means that the adsorbent experienced thermal decay upon increasing the temperature. For comparison purposes, the adsorption capacity results obtained by previous researchers are summarized: Larry E. Erickson and coworkers used sol–gel-prepared Cu–Al2O3 (Cu content of 3.1 mmol g−1) to adsorb TP and the best adsorption capacity was 4.74 mg g−1; Li et al. investigated the adsorption of TP on Cu(I)-HY-Al2O3 (Cu content of 1.2 mmol g−1), which achieved an adsorption capacity of 10 mg g−1; and Sun et al. used CuSBA-15 (Cu content of 5 mmol g−1) as adsorbents to adsorb TP, with an adsorption capacity of 16.83 mg g−1. This clearly indicated that the Cu/Zr-SBA-15 material used in the present study possessed a relatively high adsorption capacity for TP.41–43
| Temperature (°C) | Qm (mg g−1) | Langmuir constants | Freundlich constants | Temkin constants | ||||||
|---|---|---|---|---|---|---|---|---|---|---|
| KL | RL | R2 | KF | 1/n | R2 | BT | KF | R2 | ||
| 40 | 38.5 | 0.009 | 0.2399–0.4411 | 0.93476 | 2.0947 | 0.4676 | 0.97545 | 9.0264 | 0.0765 | 0.94044 |
| 50 | 51.2 | 0.00772 | 0.2690–0.4792 | 0.9755 | 1.8222 | 0.533 | 0.95919 | 12.396 | 0.05712 | 0.97316 |
| 60 | 25.8 | 0.02692 | 0.0955–0.2088 | 0.97097 | 6.17326 | 0.2387 | 0.97916 | 4.6558 | 0.5459 | 0.98352 |
3.3. Investigation of the adsorption kinetics
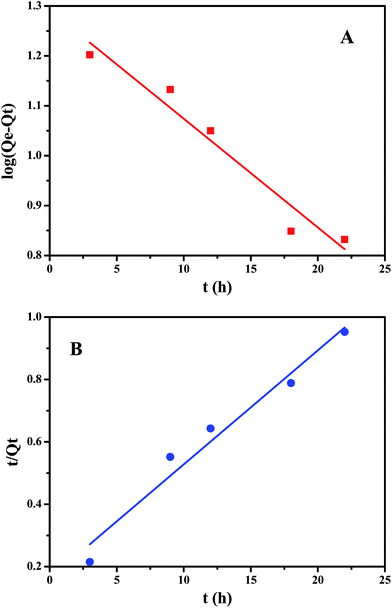
To further study the adsorption mechanism, we studied the kinetics of the adsorption process. For this study we used the pseudo-first-order kinetic and pseudo-second-order kinetic models (Fig. 9). The pseudo-first-order kinetic model indicates that the adsorption process and the adsorbate concentration are related, and the pseudo-second-order kinetic model indicates that there are limited adsorption sites. The correlation coefficient R indicates the correlation between the experimental data and the two kinetic models. The linear formulas for the pseudo-first-order and pseudo-second-order kinetic models are given as follows:
 | (5) |
 | (6) |
Table 3 summarizes the experimental data from the pseudo-first-order kinetic model and the pseudo-second-order kinetic model. The Adj. R-square (R2) obtained for the pseudo-second-order kinetic model is slightly larger than that obtained for the pseudo-first-order kinetic model. Therefore, according to the kinetic study, the adsorption mechanism agrees better with the pseudo-second-order kinetic model.
| Co (mg L−1) | Qe (mg g−1) | Pseudo-first-order | Pseudo-second-order | ||
|---|---|---|---|---|---|
| k1 (h−1) | R2 | k2 (g mg−1 h−1) | R2 | ||
| 352 | 27.3 | 0.05021 | 0.9363 | 0.00826 | 0.9574 |
3.4. Recyclability and regeneration test
Fig. 10 exhibits the results of the regeneration test for 5 cycles. After 5 cycles of adsorption, the adsorbent still had an adsorption capacity of about 20.25 mg g−1. Therefore, the ultrasound-assisted theory that we used to regenerate the adsorbent performed as expected. Besides, the material maintained the hexagonal mesoporous structure after recycling it 5 times and no distinct metal aggregation could be detected (see Fig. 3G). Above all, the adsorbent shows the ability of being easily regenerated, which indicates that the as-prepared adsorbent is feasible and suitable for the actual situation.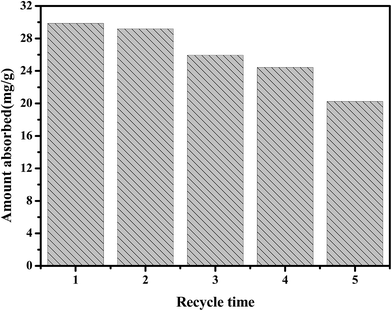 | ||
| Fig. 10 Regeneration ability of 20% Cu/ZrSBA-15 after TP desulfurization (mass, 0.1 g; modeled fuel volume, 20 mL; adsorption time, 24 h; adsorption temperature, 50 °C). | ||
4. Conclusion
In general, Cu/ZrSBA-15 shows a good performance of TP adsorption under the appropriate temperature and atmospheric conditions. This adsorbent possesses a superior adsorption capacity for thiophene in the modeled oil of 29.86 mg g−1 at 323 K. The pseudo-first-order kinetic model and Freundlich adsorption isotherm fit the experimental data very well. Besides, the experiments show that the adsorbent still has a good adsorption capacity after 5 cycles. Consequently, for the efficient removal of TP, Cu/ZrSBA-15 is probably the most promising material for obtaining ultra-low sulfur fuel oil.Acknowledgements
Financial support from the National Natural Science Foundation of China (21446001, 21676039), the Program for Liaoning Innovative Research Team in University (LT2013012), and the Program for Liaoning Excellent Talents in University (LJQ2014056) is highly appreciated.References
- M. Huang, G. Chang and Y. Su, et al., Chem. Commun., 2015, 51(61), 12205–12207 RSC.
- P. Tan, X. Y. Xie and X. Q. Liu, et al., J. Hazard. Mater., 2016, 321, 344–352 CrossRef PubMed.
- W. Ma, Y. Xu and K. Ma, et al., Appl. Catal., A, 2016, 526, 147–154 CrossRef CAS.
- S. A. Ganiyu, K. Alhooshani and K. O. Sulaiman, et al., Chem. Eng. J., 2016, 303, 489–500 CrossRef CAS.
- K. S. Triantafyllidis and E. A. Deliyanni, Chem. Eng. J., 2014, 236, 406–414 CrossRef CAS.
- N. M. Meman, M. Pourkhalil and A. Rashidi, et al., J. Inst. Eng., 2014, 20(6), 4054–4058 Search PubMed.
- J. L. García-Gutiérrez, G. C. Laredo and P. García-Gutiérrez, et al., Fuel, 2014, 138, 118–125 CrossRef.
- A. E. S. Choi, S. Roces and N. Dugos, et al., J. Taiwan Inst. Chem. Eng., 2014, 45(6), 2935–2942 CrossRef CAS.
- X. Xu, S. Zhang and P. Li, et al., Fuel, 2013, 111, 172–179 CrossRef CAS.
- G. Dedual, M. J. MacDonald and A. Alshareef, et al., J. Environ. Chem. Eng., 2014, 2(4), 1947–1955 CrossRef CAS.
- P. Guo, S. Zhai and Z. Xiao, et al., J. Colloid Interface Sci., 2015, 446, 155–162 CrossRef CAS PubMed.
- H. X. Qi, S. R. Zhai and Z. Z. Wang, et al., Microporous Mesoporous Mater., 2015, 217, 21–29 CrossRef CAS.
- F. L. Yu, Y. Y. Wang and C. Y. Liu, et al., Chem. Eng. J., 2014, 255, 372–376 CrossRef CAS.
- C. Shu, T. Sun and H. Zhang, et al., Fuel, 2014, 121, 72–78 CrossRef CAS.
- E. Lorençon, D. C. B. Alves and K. Krambrock, et al., Fuel, 2014, 132, 53–61 CrossRef.
- A. J. Hernández-Maldonado, G. Qi and R. T. Yang, Appl. Catal., B, 2005, 61(3), 212–218 CrossRef.
- S. Velu, X. Ma and C. Song, Ind. Eng. Chem. Res., 2003, 42(21), 5293–5304 CrossRef CAS.
- L. Wang, B. Sun and F. H. Yang, et al., Chem. Eng. Sci., 2012, 73, 208–217 CrossRef CAS.
- H. Song, X. Wan and M. Dai, et al., Fuel Process. Technol., 2013, 116, 52–62 CrossRef CAS.
- J. Xu, H. Li and S. Wang, et al., Chemosphere, 2014, 111, 631–637 CrossRef CAS PubMed.
- F. Tian, Q. Shen and Z. Fu, et al., Fuel Process. Technol., 2014, 128, 176–182 CrossRef CAS.
- Y. Yin, J. Zhu and X. Q. Liu, et al., RSC Adv., 2016, 6(74), 70446–70451 RSC.
- J. X. Qin, Z. M. Wang and X. Q. Liu, et al., J. Mater. Chem., 2015, 3(23), 12247–12251 RSC.
- J. X. Qin, P. Tan and Y. Jiang, et al., Green Chem., 2016, 18(11), 3210–3215 RSC.
- X. Meng, G. Qiu and G. Wang, et al., Fuel Process. Technol., 2013, 111, 78–85 CrossRef CAS.
- S. A. Dharaskar, K. L. Wasewar and M. N. Varma, et al., Fuel Process. Technol., 2014, 123, 1–10 CrossRef CAS.
- S. Aslam, F. Subhan and Z. Yan, et al., Chem. Eng. J., 2016, 302, 239–248 CrossRef CAS.
- S. Y. Chen, C. Y. Tang and W. T. Chuang, et al., Chem. Mater., 2008, 20(12), 3906–3916 CrossRef CAS.
- T. Tsoncheva, R. Ivanova and J. Henych, et al., Appl. Catal., A, 2015, 502, 418–432 CrossRef CAS.
- W. Liu, Y. Wang and M. Zhang, et al., Mater. Lett., 2013, 96, 42–44 CrossRef CAS.
- S. Allahyari, M. Haghighi and A. Ebadi, et al., Ultrason. Sonochem., 2014, 21(2), 663–673 CrossRef CAS PubMed.
- S. A. Ganiyu, K. Alhooshani and K. O. Sulaiman, et al., Chem. Eng. J., 2016, 303, 489–500 CrossRef CAS.
- B. Ambedkar, R. Nagarajan and S. Jayanti, Ultrason. Sonochem., 2011, 18(3), 718–726 CrossRef CAS PubMed.
- K. Chen and D. Xue, CrystEngComm, 2013, 15(9), 1739–1746 RSC.
- L. Gou and C. J. Murphy, Nano Lett., 2003, 3(2), 231–234 CrossRef CAS.
- B. L. Newalkar, J. Olanrewaju and S. Komarneni, J. Phys. Chem. B, 2001, 105(35), 8356–8360 CrossRef CAS.
- P. Gaudin, P. Fioux and S. Dorge, et al., Fuel Process. Technol., 2016, 153, 129–136 CrossRef CAS.
- D. Vargas-Hernandez, J. M. Rubio-Caballero and J. Santamaria-Gonzalez, et al., J. Mol. Catal. A: Chem., 2014, 383, 106–113 CrossRef.
- H. Zhang, C. Tang and Y. Lv, et al., J. Colloid Interface Sci., 2012, 380(1), 16–24 CrossRef CAS PubMed.
- M. Tsuji, S. Hikino and R. Tanabe, et al., CrystEngComm, 2010, 12(11), 3900–3908 RSC.
- X. Yang, L. E. Erickson and K. L. Hohn, et al., Ind. Eng. Chem. Res., 2006, 45(18), 6169–6174 CrossRef CAS.
- X. L. Tang and L. Shi, Langmuir, 2011, 27(19), 11999–12007 CrossRef CAS PubMed.
- Y. Yin, W. J. Jiang and X. Q. Liu, et al., J. Mater. Chem., 2012, 22(35), 18514–18521 RSC.
| This journal is © The Royal Society of Chemistry 2017 |


