
 Open Access Article
 This Open Access Article is licensed under a
 Creative Commons Attribution 3.0 Unported Licence
Wound dressing application of pH-sensitive carbon dots/chitosan hydrogel
Meisam Omidi a,
Amir Yadegarib and
Lobat Tayebi*b
a,
Amir Yadegarib and
Lobat Tayebi*b
aMedical Nanotechnology & Tissue Engineering Research Center, Shahid Beheshti University of Medical Sciences, Tehran, Iran
bDepartment of Developmental Sciences, Marquette University School of Dentistry, Milwaukee, WI 53233, USA. E-mail: lobat.tayebi@marquette.edu
First published on 7th February 2017
Abstract
Monitoring the pH of wounds has been recognized as an essential diagnosis factor during the healing process. This study presents a novel chitosan–carbon dots nanocomposite with dual applications as an antibacterial and pH-sensitive nano-agent for enhancing wound healing and monitoring the pH at the same time. The carbon dots (CDs) were synthesized using ammonium hydrogen citrate under hydrothermal conditions. The chitosan-based nanocomposites with different concentrations of CDs were fabricated through a solvent casting method. After detailed material characterization of the CDs and chitosan/CDs nanocomposites, the antibacterial activities and cell viability were thoroughly investigated against the Staphylococcus aureus bacterial species and L929 fibroblastic cell lines, respectively. The results indicated that the chitosan/CDs nanocomposites were biocompatible and nontoxic with effective antibacterial properties. The mechanical properties of the chitosan/CDs nanocomposite were improved via the addition of the CDs. The results show that the preparation of the chitosan/CDs nanocomposite at a concentration of 1.0 wt% carbon dots possessed the best optical, biological and mechanical characteristics. Furthermore, the results reveal that the proposed chitosan/CDs nanocomposites had outstanding pH-sensitive properties. According to the strong antibacterial properties and nontoxicity, as well as outstanding pH-sensitive nature, the proposed chitosan/CDs nanocomposites, as a smart materiel, have great potential applications in tissue engineering. Furthermore, the optimized ratio of CDs/chitosan nanocomposite was used as an antibacterial wound healing bandage and in vivo experiments were carried out on three groups of rats. The results showed that the CDs/chitosan nanocomposite not only possessed high pH sensitivity, but could also improve the wound healing process due to its antibacterial properties.
1. Introduction
Wound healing is known as one of the critical issues in medical processes.1 Among the critical factors in the wound healing process, such as pH, level of oxygen, enzymes and temperature, monitoring the pH fluctuation at various stages is considered as one of the most important factors.2 The alteration of pH during the healing process firmly depends on the type of wound, which is chiefly categorized as either an acute or chronic wound.3 The pH of wounds typically changes between the range of 4–6 in acidic media and 7–9 in basic milieu for both chronic and acute wounds.4 However, the range of pH alteration and its complexity depends on the type of wound. In the case of acute wounds, pH changes through the 4-fold steps of wound healing, including haemostasis, inflammation, proliferation and remodelling, which is considered a simpler route compared to the healing of chronic wounds.5 Thus far, different methods have been reported for measuring the pH, including colorimetric methods,6 electromechanical7 and electrochemical-based techniques.8 All of these methods are useful but they have some disadvantages, such as sophisticated technologies, high cost production and difficult usage. Hence, an economic, simple and applicable method for monitoring pH during the wound healing process should be developed.9 Up until this point, various kinds of biomaterials and nanomaterials have been used for improving the wound healing process and for pH monitoring.10,11 In the last decade, carbon nanostructures, such as graphene,12 graphene quantum dots13 and carbon nanotubes,14 have been utilized for antibacterial properties, wound healing and disinfection applications due to their suitable biocompatibility. As a new class of zero-dimensional (0D) nanomaterial, carbon dots (CDs) have shown promising potential application in all aspects of biomedical applications.15 It has been widely accepted that CDs possess unique optical, electrochemical, biocompatibility and photoluminescence properties.16,17 In addition, CDs have high stability, low toxicity, good water solubility and are environmentally friendly.18 Due to these attractive properties, CDs have drawn scientists' attentions for use as a novel carbon nanostructure for bioimaging, biosensors, drug delivery and gene delivery.19,20 It has been shown that the optical properties of fluorescent CDs can be affected by changing the pH.21 The high pH sensitivity of CDs can be associated with various surface states, different functional groups and energy gap.22On the other hand, chitosan is known as a hydrophilic, biocompatible, cationic and biodegradable biopolymer.23 The antibacterial properties of chitosan have been confirmed in numerous reports.24 Also, it has been shown that chitosan can accelerate the wound healing rate.25 Unfortunately, the potential application of pure chitosan as a wound dressing material can be hindered due to some undesirable properties such as platelet adhesion, protein adsorption, and development of thrombus which can increase bacteria adhesion.26 In order to overcome these issues, various types of nanostructures, such as metallic nanoparticles, such as Au, Ag, Zn and TiO2,27,28 carbon nanotubes29 and graphene,30 have been combined with chitosan. The combination of these nanostructures can effectively improve chitosan's properties. However, these nanostructures have their own problems, such as non-environmentally friendly synthesis methods and high cost.31 In this study, we prepared a novel chitosan/CDs nanocomposite that can be simultaneously applied as an antibacterial and pH sensitive nanoagent for enhancing the wound healing process. Ammonium hydrogen citrate (AHC) was used to synthesize N-doped CDs and the chitosan/CDs nanocomposites films were then fabricated through a solvent casting method. The biocompatibility, antibacterial properties and pH sensitivity of the N-doped CDs and chitosan/CDs nanocomposites were examined using the WST assay and an antibacterial test, UV-Vis spectra and optical images, respectively. Finally, in vivo stduies were carried out on three groups of rats.
2. Material and methods
2.1. Instruments and materials
All the materials were purchased from Sigma Aldrich and used without any further manipulation. The morphology of the CDs was investigated by transmission electron microscopy (TEM, Philips, EM 208). The crystallinity of the as-prepared CDs was examined by X-ray diffraction using a PW 1840 Philips device. Ultraviolet-Visible (UV-Vis) spectroscopy was carried out using a Rey Leigh UV-2601 spectrometer. The zeta potential and dynamic light scattering was conducted by using a ZEN 3600 (Malvern) device. XPS analysis was carried out using a hemispherical analyser supplied by an Al Kα X-ray source (operating at an energy of 1486.6 eV in a vacuum higher than 10−7 Pa) and the signals were deconvoluted by Gaussian components. The photoluminescence (PL) spectra were recorded using an Avaspec 2048 TEC (Avantes) spectrophotometer, while the excitation wavelength varied from 246 to 396 nm.2.2. Synthesis of CDs
The CDs were synthesized using AHC as both a nitrogen and carbon precursor. The CDs were synthesized by a hydrothermal reaction; briefly, 2 g of AHC was dissolved into 75 ml of deionized water to reach a colourless solution. Subsequently, the solution was transferred into a 100 ml Teflon-lined stainless autoclave. The autoclave was gradually heated to 180 °C at the rate of 2 °C min−1 and held at this temperature for 12 h. After naturally cooling the autoclave, the colourless solution changed to a bright yellow solution. The obtained solution was centrifuged at 10![[thin space (1/6-em)]](https://www.rsc.org/images/entities/char_2009.gif) 000 rpm for 15 min to separate out the larger particles. Finally, the supernatant solution was separated from the large particles and kept for further characterizations and evaluations.
000 rpm for 15 min to separate out the larger particles. Finally, the supernatant solution was separated from the large particles and kept for further characterizations and evaluations.
2.3. Preparation of chitosan/CDs nanocomposite
For fabrication of the chitosan/CDs nanocomposite, 3 wt% homogenous solution was prepared by dissolving chitosan in 0.3 M acid acetic. The sterile square chitosan patterns were produced using a standard square mould with the size of 30 × 40 mm. Various proportions of CDs, including wt% = 0%, 0.25%, 0.5%, 1% and 2%, were gently added to the chitosan solution to prepare the desirable antibacterial mixture. Subsequently, the mixture was injected into the square mould for the formation of composite films. Then, the moulds were lyophilized in a freeze dryer to complete the moulding process.2.4. Characterization of mechanical properties
The mechanical properties of the chitosan/CD nanocomposite were measured using Instron 5900 instrument under a cross-head speed of 1 mm min−1. The cylinder dimensions were 15 mm in diameter and 5 mm in thickness. All the tensile tests were performed at room temperature. In order to achieve more reliable results, five samples were fabricated for each case.2.5. Antibacterial measurements
The antibacterial activities of CDs and chitosan/CDs nanocomposites were investigated against Staphylococcus aureus using disc diffusion method (DDM).32 In the DDM, 50.0 μl of the bacteria suspension (100–120 CFU ml−1) was cultured in sterilized Petri dishes in which Luria–Bertani (LB) agar gel was coated. Then, 5 mm filter paper discs were immersed into the different concentration of CDs (1–15% v/v in PBS). Shortly after the impregnation, the paper discs were carefully located in centre of the prepared culture Petri dishes and incubated at 37 °C for 24 h. Also, optical density (OD) method was applied for investigation of the CDs' antibacterial activity. To achieve this, different concentrations of CDs were added to 1 ml of Staphylococcus aureus growth medium and incubated in a shaking incubator for 24 h. At selected time intervals, the corresponding OD was recorded in 610 nm. In the optical density method, disc shapes samples of the chitosan and chitosan/CDs nanocomposites with a diameter of 5 mm were added to separate test tubes containing 10 ml of bacterial growth medium. Then, 1 ml of fresh culture of Staphylococcus aureus was added to each test tube, which were then incubated in a shaking incubator for 24 h. At selected time intervals, the turbidity of media was recorded with a UV-Vis spectrophotometer at 610 nm.2.6. Cell toxicity
L929 fibroblastic cell lines were cultured in 24-well plates in RPMI medium supplemented with 10% fetal bovine serum (FBS) and 1% penicillin/streptomycin. The toxicity of the CDs samples were evaluated using the WST assay kit, as described previously.33 In brief, the CDs with various concentrations (0 to 50 μg ml−1) (10 well per group) were added to the cultured cells (106 cells per well). Then, the viability of cells was assessed after 24 h using WST assay kit (CCK-8). The chitosan/CDs nanocomposites were successively sterilized by immersing the samples in 75% ethanol for 12 h and culture media overnight. The samples were seeded with 1 × 10⁵ L929 fibroblastic cells in RPMI medium supplemented with 10% fetal bovine serum (FBS) and 1% penicillin/streptomycin. The cell viability was assessed after 48 h using WST assay, Calcein AM and Ethidium homodimer-1 (EthD-1) recognize kit. Calcein AM was converted to fluorescent calcein (excitation ∼495 nm, emission ∼515 nm) by intracellular esterases present in live cells. While EthD-1 penetrates damaged cell membranes and binds to the nucleic acids, fluorescent emission is increased 40-fold (excitation ∼496 nm, emission ∼635 nm). The fluorescent images were recorded using an inverted fluorescence microscope (Evos, Life Technologies).2.7. Characterization of the pH sensitivity
The effect of pH alteration on the emission intensity of CDs was investigated through measuring the PL intensity by varying pH values at the excitation of 365 nm. In a typical experiment, 2 ml of CDs with concentration of 1 mg ml−1 in buffer phosphate solution was prepared at various pH (2–12). Furthermore, the visual images of CDs were taken at the corresponding pH values under day light and UV (365 nm). Each measurement was repeated three times. Subsequently, the calibration curve of pH values and the related intensity were plotted. The pH sensitivity and fluorescence properties of the CDs–chitosan nanocomposite at various pH values were further examined. For this purpose, 2 ml of buffer solution at different pH values (4–9) was added to the as-prepared nanocomposites and the visual images were taken under day light and UV (365 nm). The emission intensity of each sample was characterized by using Image-J software.342.8. In vivo wound healing study
The as-prepared chitosan/CDs nanocomposite was used to characterize the wound healing process by using a rat model. The in vivo experiments and wound healing characteristics were investigated following the approval of the Animal Ethics Committee, Shahid Beheshti University of Medical Sciences (IR, SBMU.RETECH.REC.1395.291). The pure weight of each rat was measured to be about 260 g. The rat was anaesthetised through the injection of urethane (2 mg kg−1) and a selected part of its body was completely shaved. At the first step, the selected area of the wound (1 cm2) was excised and prepared for assessing the wound healing characteristics. Then, the wound was fully covered with the chitosan and chitosan/CDs nanocomposite at the optimized ratio. It should be noted that the area of chitosan/CDs nanocomposite was measured to be about 2.25 cm2 in order to cover the whole surface of the wound and was then fixed via an elastic adhesive bandage. Throughout wound healing process, the reduction of the wound size was photographed and recorded over the passage of 0, 4, 8 and 16 days. During the wound healing process, the rat was kept in sterilized conditions to eliminate the effect of bacterial growth which could be caused by external factors. The percentage reduction of the wound size was calculated with the following equation:| wr = ([ai − at]/ai) × 100 |
3. Results and discussion
Numerous approaches have been proposed for the synthesis of CDs,35 among which the hydrothermal and solvothermal approaches are known as the best methods due to offering facile, large-scale and green synthesis procedures.36 In this study, CDs were hydrothermally synthesized at 180 °C, according to Scheme 1. The shape, size and chemical structure of the synthesized CDs were comprehensively characterized using atomic transmission electron microscopy (TEM), high-resolution transmission electron microscopy (HRTEM), dynamic light scattering (DLS) and UV-Visible and photoluminescence (PL) spectroscopy (Fig. 1). Fig. 1A and B show the TEM and HRTEM images of the CDs. These figures illustrate that no significant agglomeration occurs during the synthesis of the CDs. The hydrodynamic diameter of the CDs was evaluated by DLS (Fig. 1C), in which the dominant diameter of the CDs was found to be about 4 ± 1 nm, as confirming by the TEM images. The UV-Visible spectrum of the CDs and fluorescence images under UV light (366 nm) can be seen in Fig. 1D. The absorption peaks at 231 and 330 nm can be attributed to π–π* transition of C![[double bond, length as m-dash]](https://www.rsc.org/images/entities/char_e001.gif) C bond and n–π* transition of CO bond, respectively.37 Also, various excitation wavelengths were applied to evaluate the excitation dependency or independency of the CDs. Fig. 1E illustrates the PL response of CDs by varying the excitation wavelength from 246 to 396 nm. It can be seen that the fluorescence emission peaks remain invariable by altering the excitation wavelength. Furthermore, the wavelength of emission was approximately 462 (±5 nm) indicating a uniform size distribution of CDs, which confirms the DLS and TEM results.38,39 The PL characterization approves that the as-prepared CDs indicate an independent-excitation behaviour.40
C bond and n–π* transition of CO bond, respectively.37 Also, various excitation wavelengths were applied to evaluate the excitation dependency or independency of the CDs. Fig. 1E illustrates the PL response of CDs by varying the excitation wavelength from 246 to 396 nm. It can be seen that the fluorescence emission peaks remain invariable by altering the excitation wavelength. Furthermore, the wavelength of emission was approximately 462 (±5 nm) indicating a uniform size distribution of CDs, which confirms the DLS and TEM results.38,39 The PL characterization approves that the as-prepared CDs indicate an independent-excitation behaviour.40
 | ||
| Scheme 1 Schematic illustration for synthesis of carbon dots. | ||
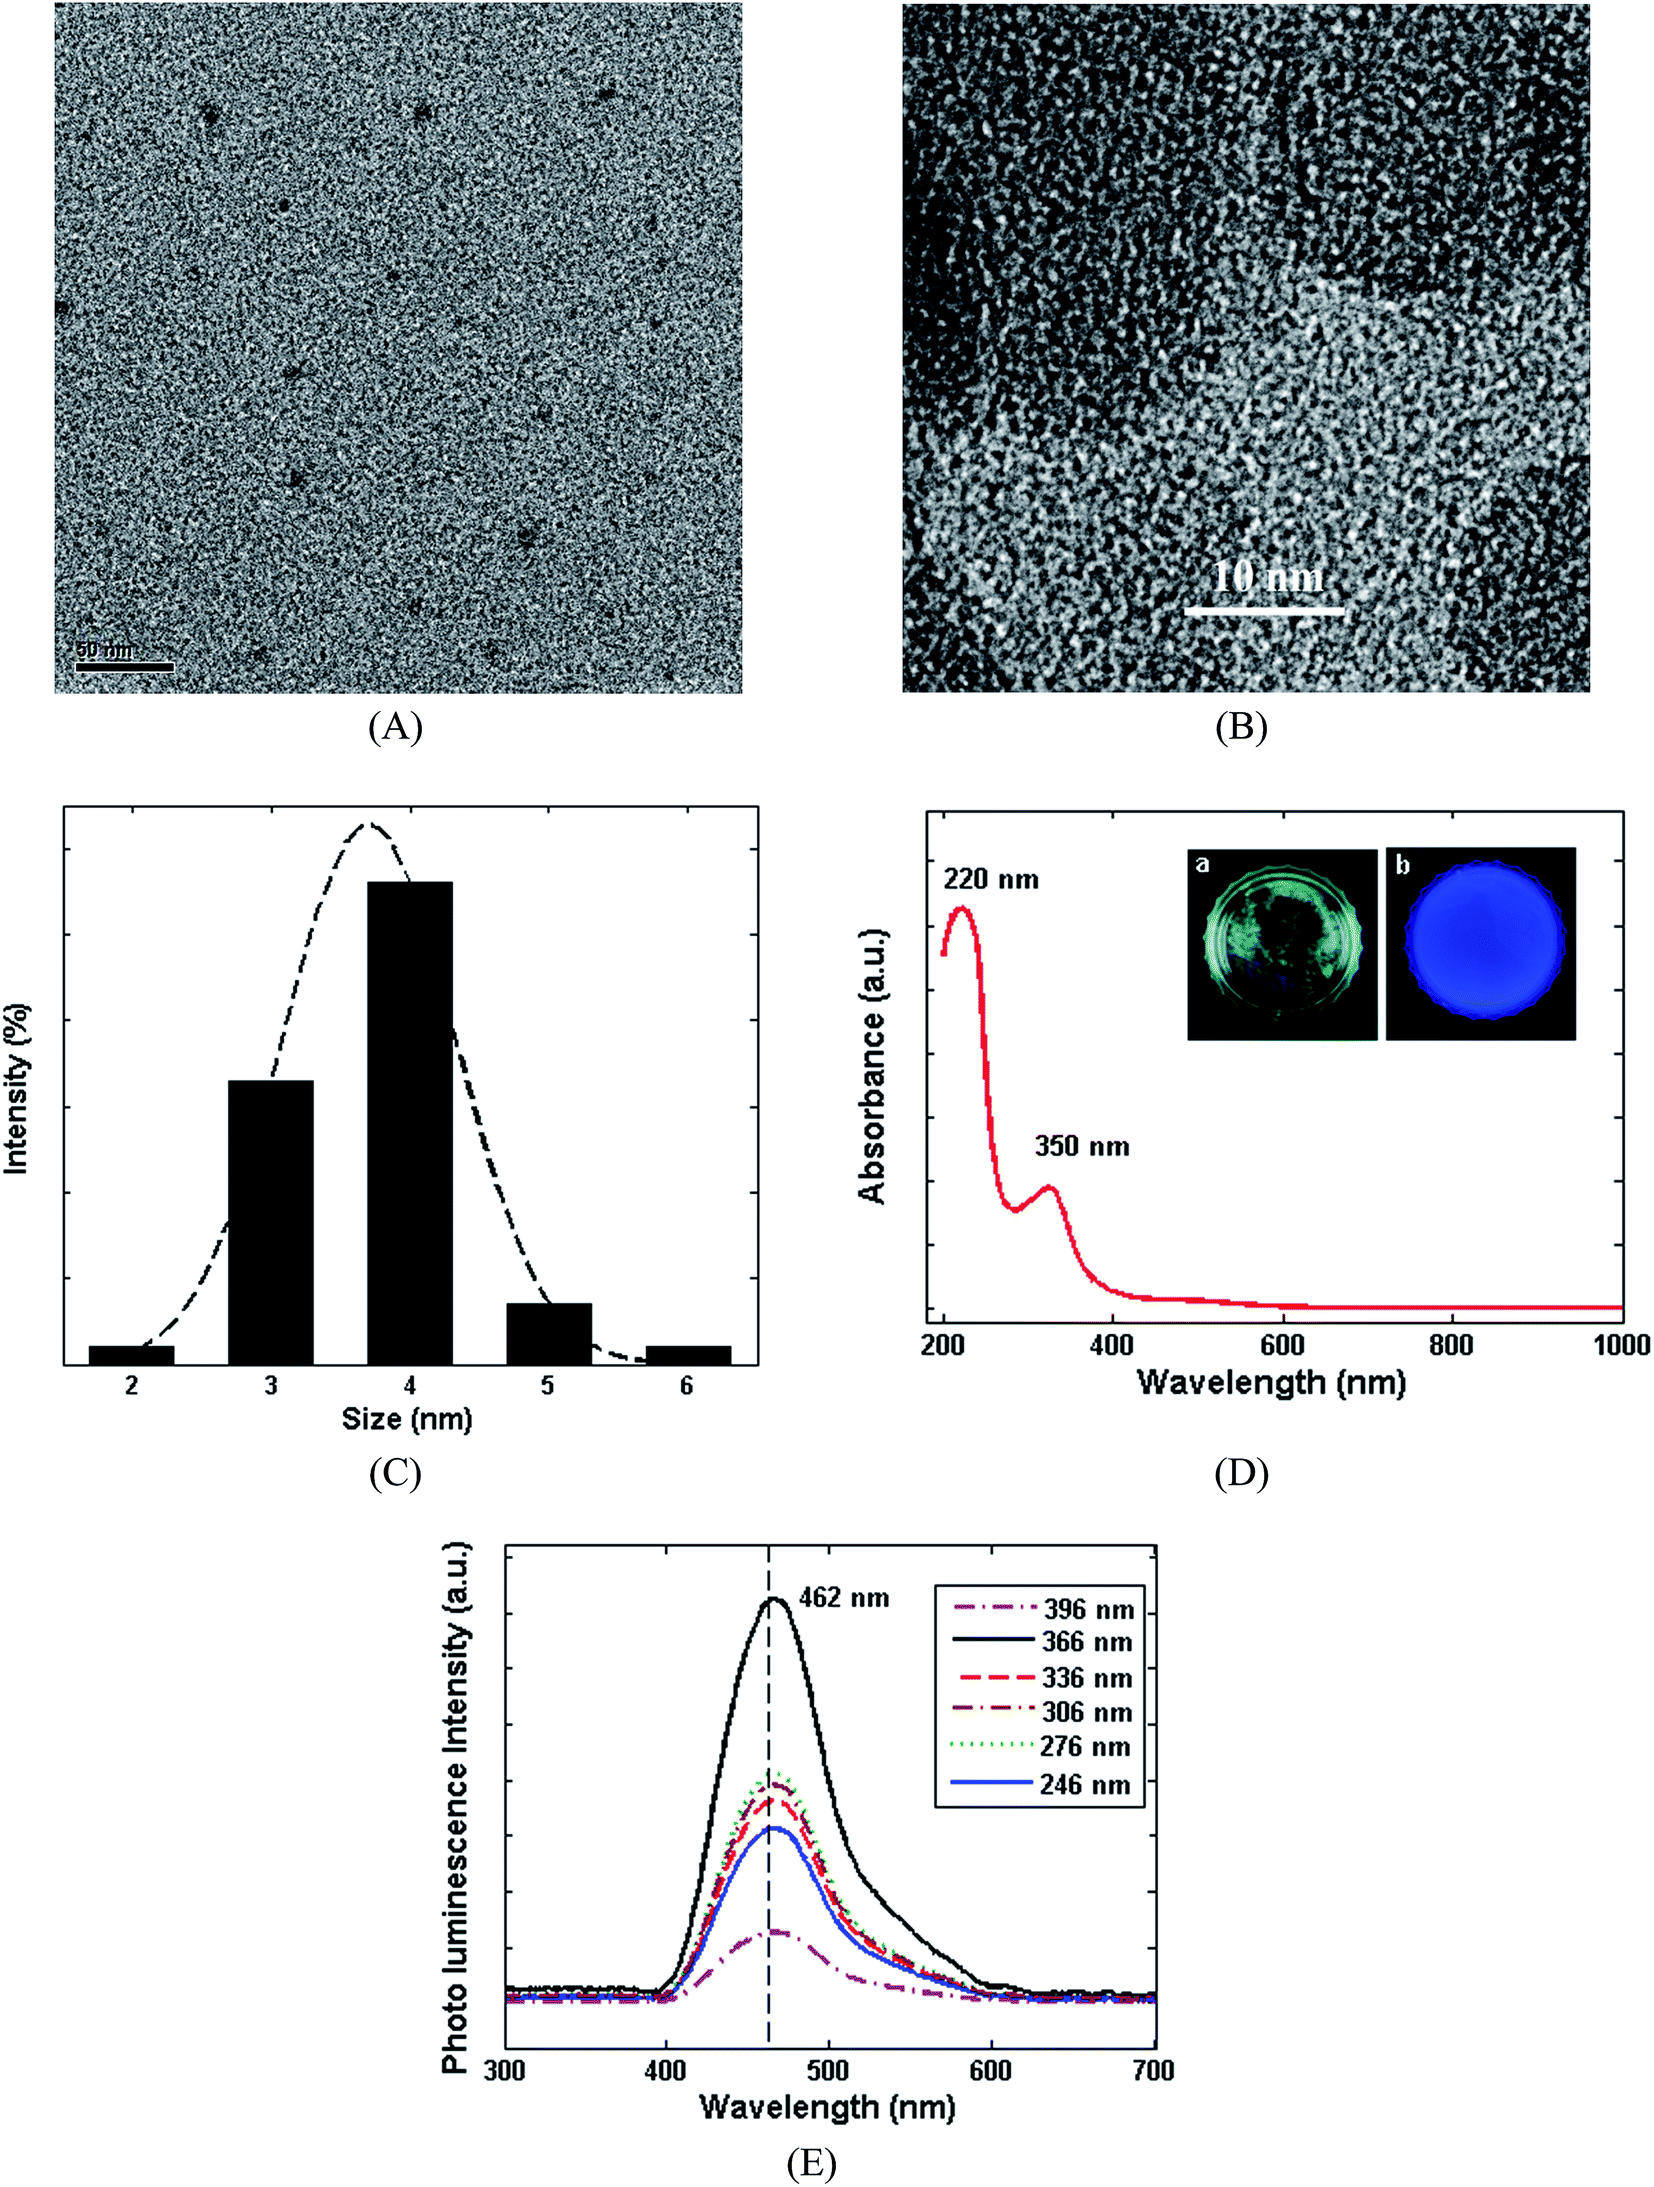 | ||
| Fig. 1 (A) TEM and (B) HRTEM images of CDs. (C) Particle size distribution of CDs, (D) UV-Visible absorption spectrum of CDs. The insets: photographic images of the CDs (1 mg ml−1) under a: sunlight and b: UV light (366 nm). (E) PL response of the CDs by varying the excitation wavelength from 246 to 396 nm. | ||
X-ray photo-electron spectroscopy (XPS) was utilized to investigate the chemical composition of the CDs (Fig. 2). According to Fig. 2A, three major peaks can be observed, which are related to carbon, nitrogen and oxygen atoms. The high-resolution C 1s spectrum (Fig. 2B) is divided into four distinctive peaks. The first and main component is related to C–C bonds at 284.7 eV. The second one is attributed to C–N bonds at 285.4 eV, while the third component at 287.8 eV can be related to CO bonds and the fourth peak at 289.3 eV is associated with C–O bonds.40,41 Fig. 2C, exhibits the high-resolution XPS spectra of N 1s for the CDs. The two distinct peaks at 400.2 and 401.5 eV can be related to C–N and N–H bonds, respectively. These peaks confirm the formation of nitrogen-containing CDs during the hydrothermal process. The O 1s spectrum of the carbon nanodots (Fig. 2D) can be divided into two main peaks at 531.6 and 533.1 eV relating to CO and C–O bonds, respectively. The XPS results confirm the synthesis of oxygen–nitrogen dual-doped CDs.40
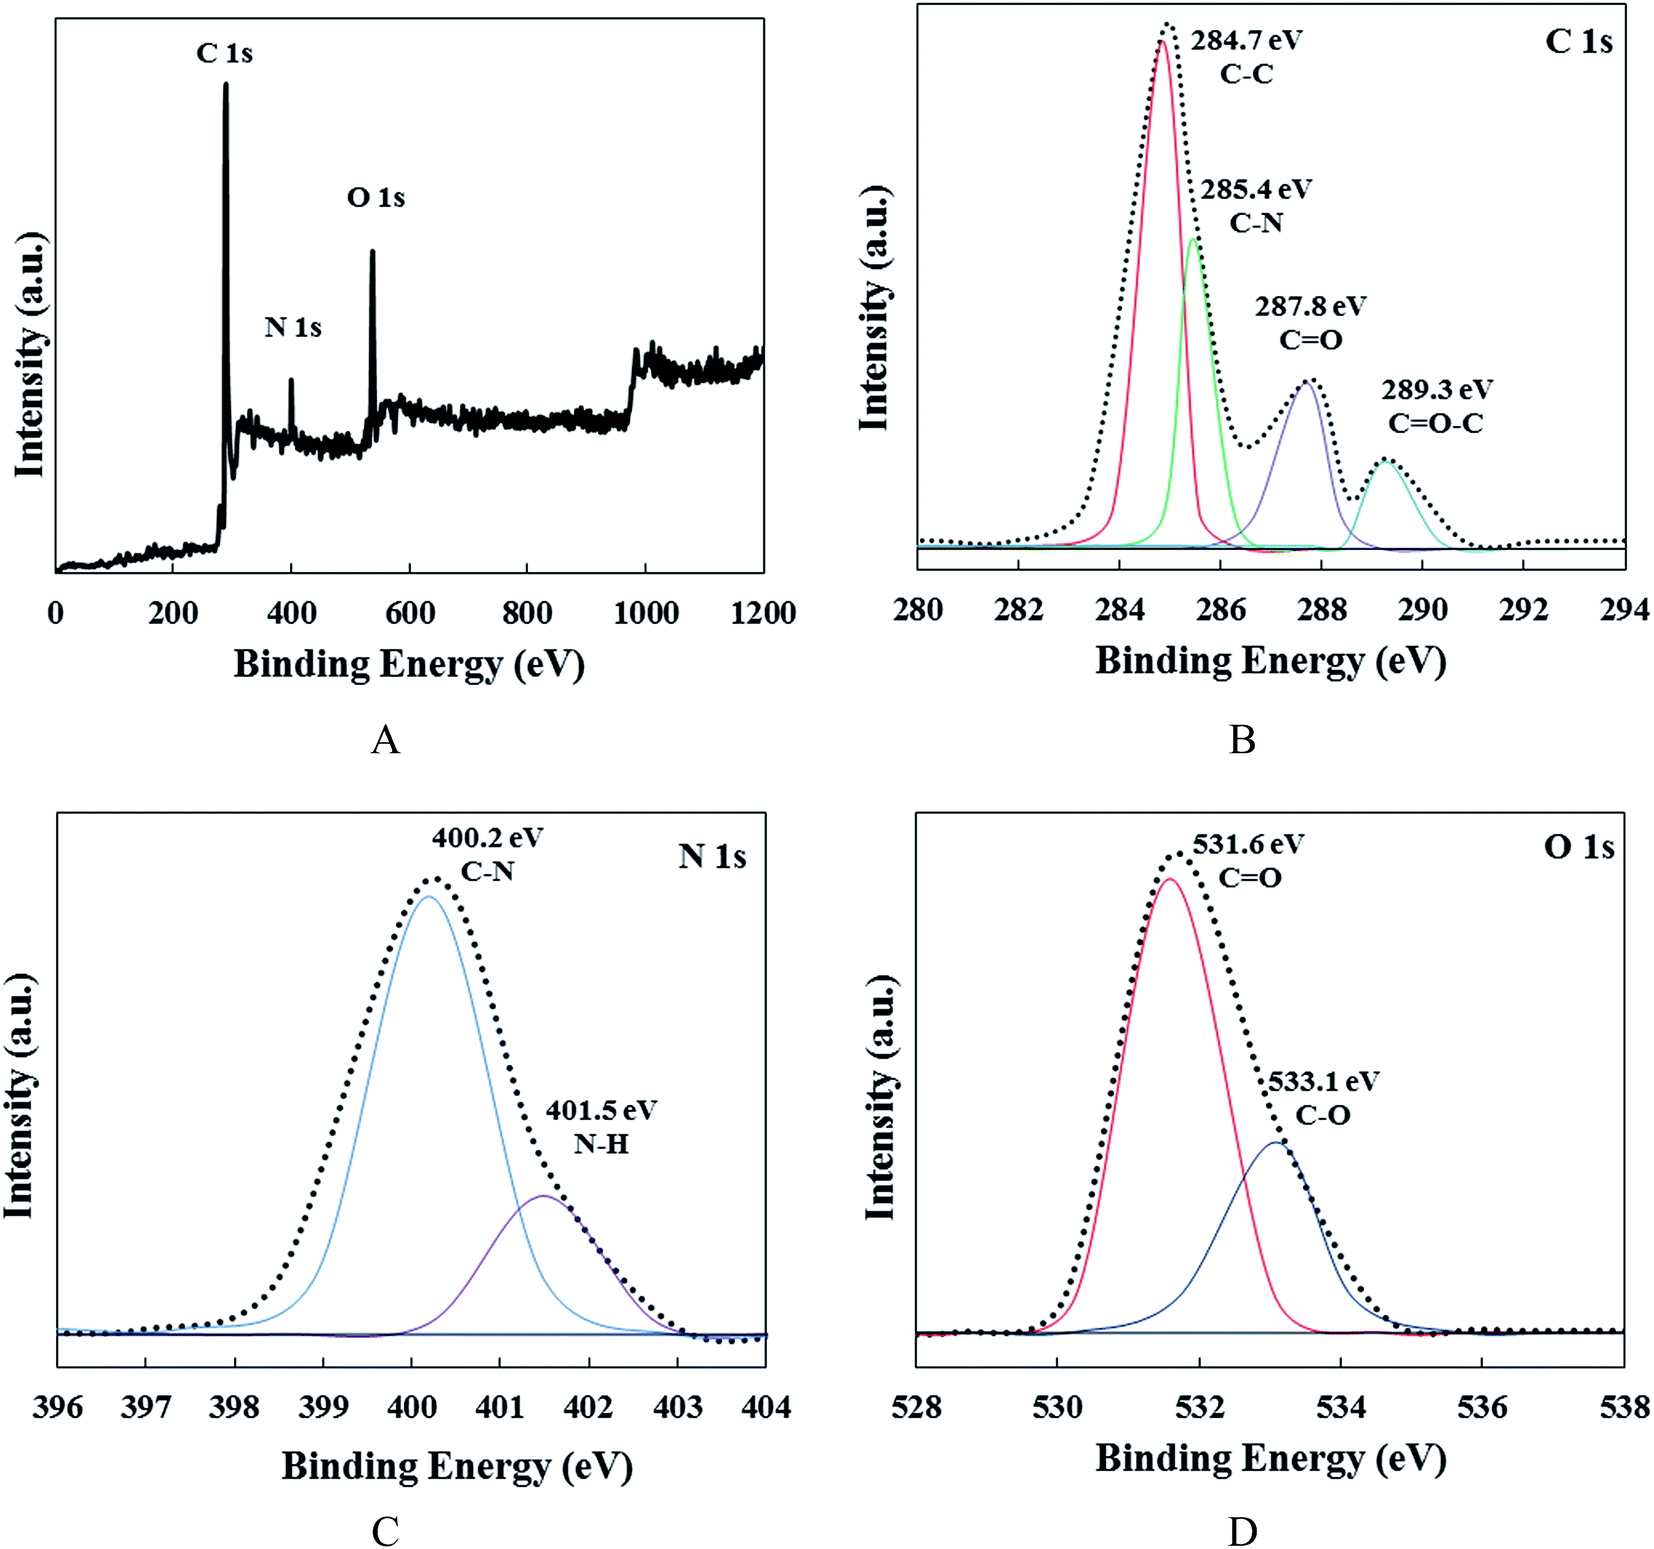 | ||
| Fig. 2 (A) XPS survey spectra of the CDs. (B) XPS high-resolution survey scan of C 1s, (C) N 1s and (D) O 1s region of the CDs. | ||
The antibacterial properties of the CDs against Staphylococcus aureus were confirmed by DDM (Fig. 3A). The CDs showed strong antibacterial properties with an inhibition zone of 3.1 mm, 3.7 mm and 4.6 mm being observed for 5%, 10% and 15% v/v, respectively. Bacterial growth kinetics were also carried out in order to study the antibacterial properties of different concentrations of CDs (Fig. 3B). The bacterial growth was obtained by measuring the optical density at 610 nm. As presented in Fig. 3B, the bacterial growth was inhibited by increasing the CDs concentration, in comparison with the control (without CDs). The growth of Staphylococcus aureus was inhibited completely when the concentration of CDs was more than 10 μg ml−1. The toxicity of the CDs samples on L929 fibroblasts cell lines was evaluated using the WST assay kit. As shown in Fig. 3C, the CDs also show negligible toxicity on fibroblasts cell. The nontoxic behaviour of the CDs as well as their good antibacterial activity can indicate the potential application of CDs in nanocomposites.
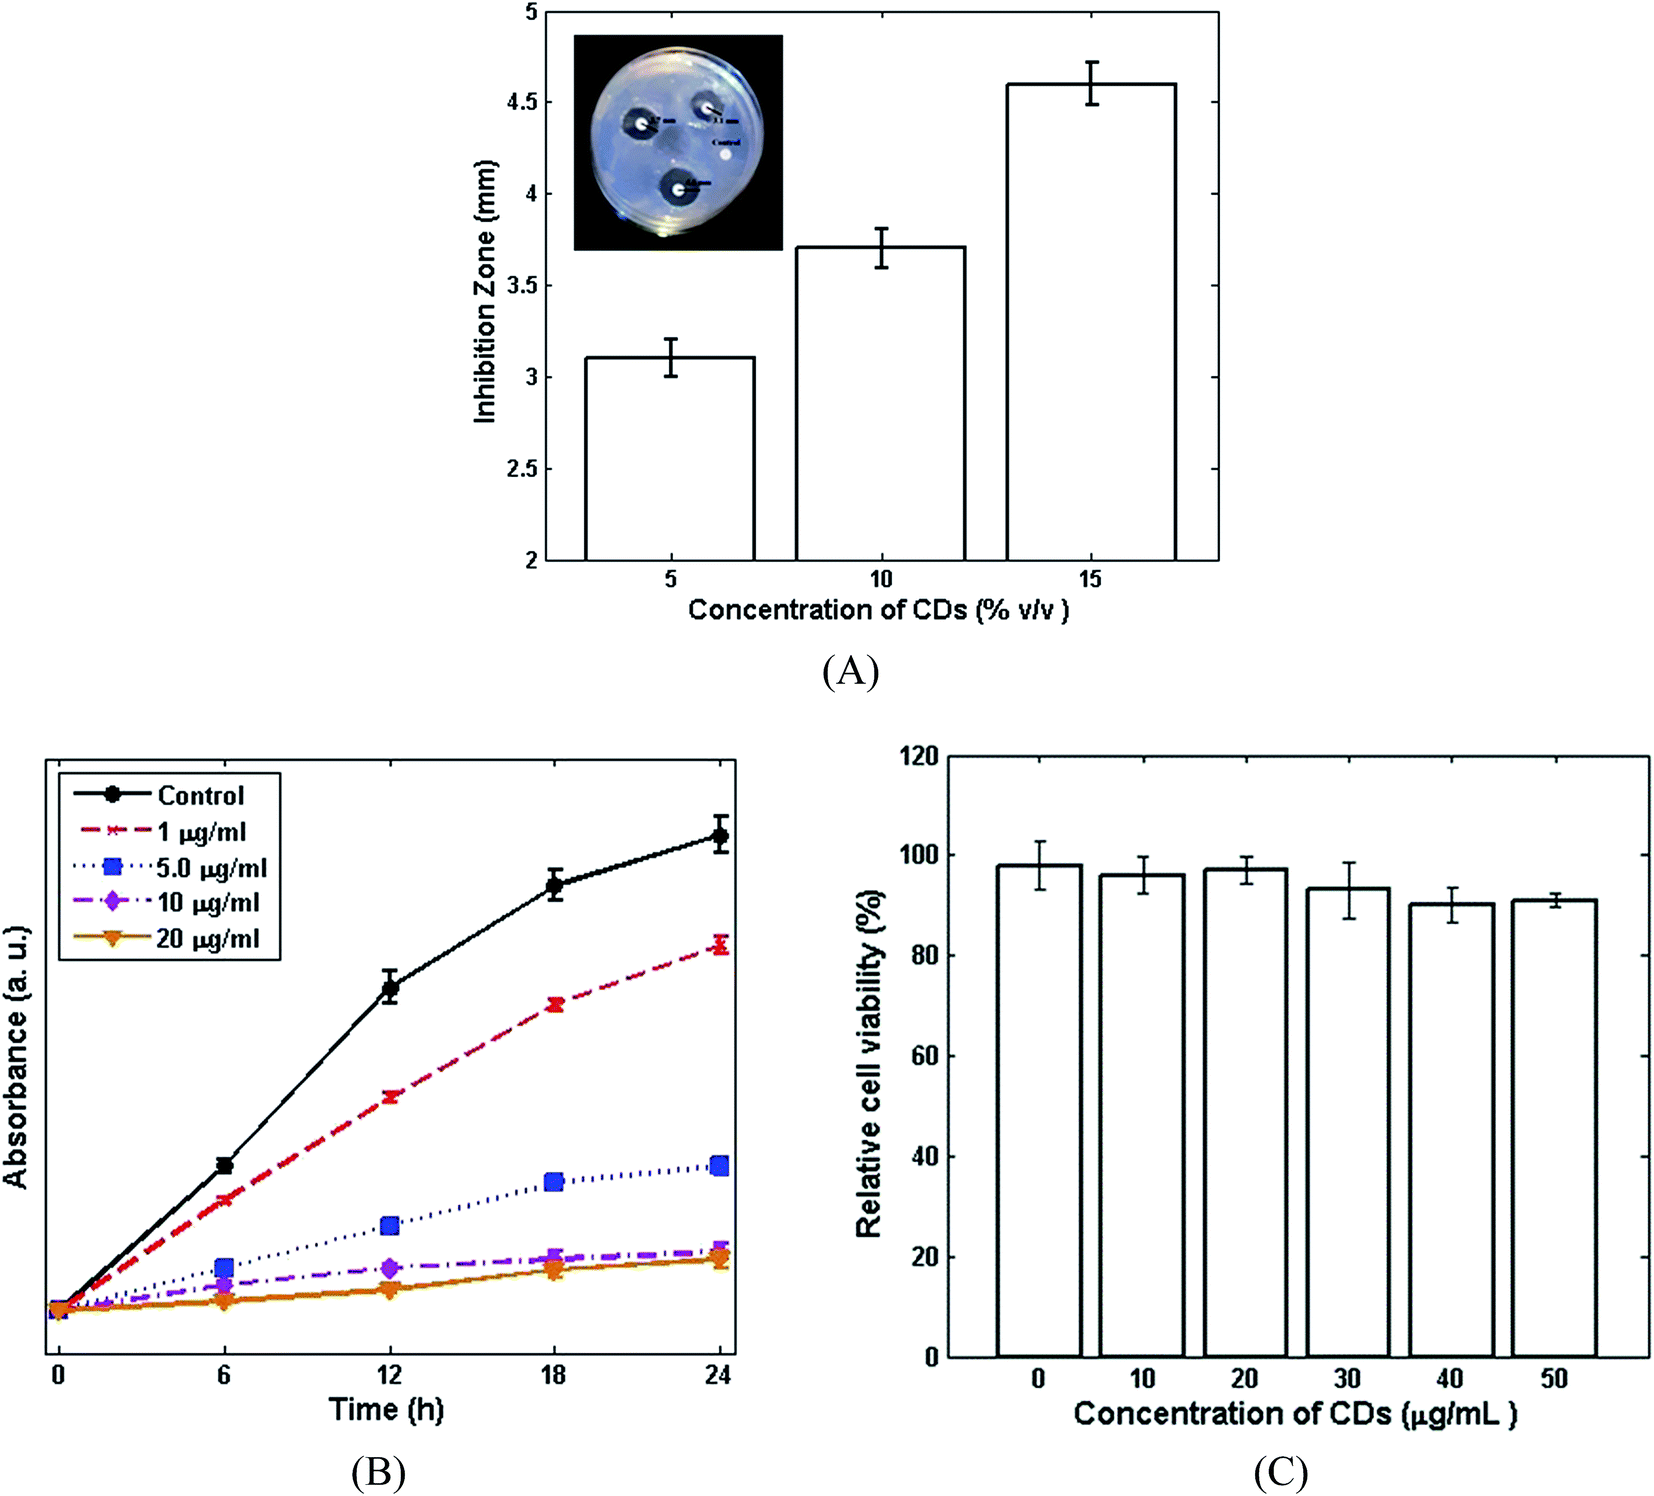 | ||
| Fig. 3 (A) Antibacterial activity of the CDs by the DDM. (The insets: photographic image) and (B) optical density method. (C) Relative cell viability of the L929 cell line after 24 hour treatment with different concentration of CDs. | ||
Optical images of chitosan and the chitosan/CDs nanocomposites film under sunlight and UV light are presented in Fig. 4A. Fig. 4B shows the XRD patterns of the CDs, chitosan and chitosan/CDs nanocomposites film. The XRD spectrum of the CDs indicate distinct peaks near 28 (2θ) corresponding to the (002) crystal lattices of carbon atoms. The interlayer spacing distance of the CDs was found to be about 3.3 Å.40 The XRD pattern of the chitosan film indicates a peak indexing at 2θ 11.5°, along with three broad peaks at 18.2°, 30° and 42°. The XRD spectrum of the chitosan/CDs nanocomposites shows the diffraction pattern of both CDs and chitosan. The peak intensity of the chitosan at 11.5° and 18.2° was slightly decreased in the chitosan/CDs nanocomposites. This decreased peak intensity of the nanocomposites indicates a slight increase in the crystallinity of the nanocomposites.31 Mechanical strength is one of the important criteria that should be considered in biomaterial design. For further evaluation of the role of the CDs in the chitosan matrix, the mechanical properties of the chitosan/CDs nanocomposites were investigated. The stress–strain curves of the chitosan and chitosan/CDs nanocomposites at different concentrations of CDs are shown in Fig. 4C. The tensile strength, Young's modulus and elongation at break of the chitosan/CDs nanocomposites are tabulated in Table 1. The mechanical properties of the nanocomposites are conspicuously improved by the addition of CDs, which highlights the role of carbon nanoparticles in the chitosan/CDs nanocomposites.42 As summarized in Table 1, the mechanical properties of the nanocomposites at the concentration of 1.0 wt% CDs was improved compared to the concentration of 0, 0.25 and 0.5 wt%. After that, increasing the concentration of CDs from 1.0 to 2.0 wt% resulted in the mechanical properties of the nanocomposites remaining approximately unchanged. It can be inferred that the concentration of 1.0 wt% might be chosen as the optimal concentration of chitosan/CDs nanocomposite. The SEM images of the chitosan and chitosan/CDs nanocomposite at the concentration of 1.0 wt% are shown in Fig. 4D and E, respectively. Fig. 4D shows the fractured surface of neat chitosan. The neat chitosan shows a smoother surface compared to the chitosan/CDs nanocomposite, indicating the creation of more fracture via the addition of CDs. According to Fig. 4E, the SEM micrographs reveal that the roughness of the chitosan/CDs nanocomposite increases, implying a tortuous crack propagation path after the addition of the CDs. Thus, the higher fracture energy, greater roughness and higher strength of the chitosan/CDs nanocomposites is due to the inclusion of CDs to chitosan, which confirms the aforementioned mechanical properties of the chitosan and chitosan/CDs nanocomposites.
 | ||
| Fig. 4 (A) Photographic images of a: chitosan/CDs nanocomposites and b: chitosan film under sunlight and UV light (366 nm). (B) XRD patterns of CDs, chitosan and chitosan/CDs nanocomposites. (C) Stress–strain curves for chitosan and chitosan/CDs nanocomposites films. (D) Typical SEM micrograph of chitosan and (E) 1.0 wt% chitosan/CDs nanocomposites films. | ||
| wt% of CDs | Young's modulus (GPa) | Tensile strength (MPa) | Elongation at break (%) |
|---|---|---|---|
| 0 | 2.26 ± 0.20 | 64 ± 3.1 | 8.6 ± 0.19 |
| 0.25 | 2.62 ± 0.18 | 67 ± 4.2 | 9.2 ± 0.14 |
| 0.50 | 2.86 ± 0.32 | 70 ± 5.6 | 8.8 ± 0.21 |
| 1.00 | 2.88 ± 0.17 | 79 ± 4.4 | 9.1 ± 0.22 |
| 1.50 | 2.91 ± 0.16 | 80 ± 3.3 | 8.9 ± 0.18 |
| 2.00 | 2.90 ± 0.15 | 81 ± 3.4 | 8.8 ± 0.23 |
The toxicity of chitosan and the chitosan/CDs nanocomposites samples on L929 fibroblasts cell lines was evaluated using the WST assay kit. Fig. 5A shows the relative viability of L929 cells on chitosan and the chitosan/CDs nanocomposites with different concentrations of CDs, including 0.25, 0.5, 1.0, 1.5 and 2.0 wt% over 48 h. Accordingly, there is no significant difference between the relative cell viability of chitosan and the nanocomposites, indicating the high biocompatibility and nontoxicity of the chitosan/CDs nanocomposites. The identification of the cell viability was further confirmed through Calcein AM and EthD-1 recognize assay of L929 cells cultured on chitosan and 1.0 wt% chitosan/CDs nanocomposite. Generally, EthD-1 and Calcein AM are used to identify cell viability. As a matter of fact, in the presence of live cells, non-fluorescence Calcein AM can be converted to a fluorescence agent and then excited at the wavelength of ∼495 nm due to plasma membrane and intracellular esterase activities.43 The live cells can be observed through the interaction between L929 cells and Calcein AM, which are shown as the green channel in Fig. 5B (emission of ∼515 nm). On the other side, the interaction of EthD-1 and nucleic acids in damaged cells leads to the emission of a fluorescence agent at ∼640 nm, which can be seen as the red channel in Fig. 5B, representing the dead cells.43 As observed in this figure, the obtained results are in good agreement with the WST assay, both of which indicate the high biocompatibility and nontoxicity of the CDs and chitosan/CDs nanocomposites. Furthermore, the effect of the concentration of CDs on the fluorescence intensities of chitosan and the nanocomposites under UV light was investigated. As presented in Fig. 5C, the fluorescence emission of the nanocomposites intensified with increasing the concentration of CDs. The addition of CDs (0 to 1 wt%) also amplified the emission from the nanocomposites under UV light; however, the further addition of CDs until 2.0 wt% then led to a decrease in the fluorescence intensity. Fig. 5C suggests that the nanocomposite with the concentration of 1.0 wt% possesses the highest fluorescence intensity compared to the others. Also, the antibacterial activities of chitosan and the chitosan/CDs nanocomposites were evaluated using the optical density method. In the optical density method, bacterial growth was monitored by recording the growth media absorption at 610 nm (OD). The curves of OD against time for the control, chitosan and for 0.25 to 2 wt% chitosan/CDs nanocomposites are shown in Fig. 5D. The results show that the chitosan/CDs nanocomposites had antibacterial activity by them inducing a clear inhibition of bacterial growth as compared to the control and neat chitosan. The inhibition of bacterial growth of the chitosan/CDs nanocomposites increased when the volume fraction of the CDs increased, and it was completely inhibited when the volume fraction was more than 1%. Although several antimicrobial mechanisms for nanoparticles have been proposed in the literature, the exact antibacterial mechanisms are not yet completely understood. Generally, the antibacterial properties of CDs can be related to their large surface area and due to their reactive oxygen species.44 All of the investigated experiments, including antibacterial, cell viability, photoluminescence (PL) spectroscopy and mechanical properties, indicate that the inclusion of CDs to chitosan at the concentration of 1.0 wt% can be introduced as the best composition for the preparation of the chitosan/CDs nanocomposite.
 | ||
| Fig. 5 (A) Proliferation of L929 cell line on chitosan and chitosan/CDs nanocomposites over a 48 hour period. (B) Fluorescence images of L929 cells cultured on (a) chitosan and (b) 1.0 wt% chitosan/CDs nanocomposites. Green channel shows live cells, and red channel shows dead cells. (C) Variation of the fluorescence intensities of chitosan/CDs nanocomposites films with various CDs weight contents. Inset: photograph of the fluorescence composite with various CDs weight contents under UV and daylight. (D) Antibacterial activity of chitosan and chitosan/CDs nanocomposites by the optical density method. | ||
The healing procedure is always affected by pH, for both acute and chronic wounds.45 Fig. 6A, shows the typical fluctuation of pH for both acute and chronic wounds. As shown in Fig. 6A, for acute wounds the pH varies through a simple profile; however, the pH changes between acidic pH (∼5–6) and basic pH (7.5–8), which indicates a greater alteration of pH during the healing of an acute wound versus a chronic wound. In the case of chronic wounds, the oscillation of pH (7–8) is less than for acute wounds implying a more complicated and lengthy process. It has been suggested that the main reason for the pH oscillation is related to the colonization of bacteria. Other reasons, such as the type of the bacteria and their toxicity, the type of tissue, angiogenesis, protease activity and oxygen release, have also been suggested in literature45 as the source of the pH oscillation in the wound healing process. The pH sensitivity of CDs is shown in Fig. 6B through visual photographs of the CDs under daylight and UV (365 nm). As can be clearly seen, under daylight at various pH values, the colour of the CDs changes from bright yellow towards dark yellow when increasing the pH values indicating the pH sensitivity of the CDs even under daylight. Moreover, under UV light, the fluorescence intensity of the CDs is obviously affected from acidic milieu towards basic. The high sensitivity of the CDs at lower pH can be attributed to the aggregation of CDs due to the deprotonation of the present carboxylic acid groups on the surface of the CDs.22 The photoluminescence spectra of the CDs at different pH values and under 365 nm excitation were also investigated for further confirming the pH sensitivity of the fluorescence of the CDs. According to Fig. 6C, the intensity of the CDs considerably decreased when reducing the pH values from 6 to 4. While, at basic pH values (8 to 10), the intensity is slightly diminished which is in good agreement with the visual photographs in Fig. 6B. Hence, the fluorescence of the CDs disclose their great potential to be applied as a novel and super sensitive pH indicator for monitoring different stages of wound healing. In addition to the previous results, the pH sensitivity of fluorescence of the CDs was quantitatively evaluated by plotting the values of pH (2–12) versus the florescence intensities. As can be seen in Fig. 6D, the obtained plot shows a breakthrough curve in which the intensity of fluorescence of the CDs is increased by increasing the pH from 4 to 9. At the beginning, in the range of (pH: 2–4), there is no obvious change in fluorescence intensity, but when increasing the pH from 4 to 9, the fluorescence intensity is heightened. At the end (pH: 10–12), the intensity shows a stable behaviour. Considering the range of pH oscillation in the wound healing process (Fig. 6A), the main range of pH fluctuation is between 4 and 9. Therefore, the proposed pH-sensitive CDs can be introduced as an excellent candidate for monitoring pH during wound healing. Regarding the desired pH range for wound healing, the detailed responses of the pH-sensitive chitosan/CDs nanocomposites film (1.0 wt%) towards a pH alteration from 5 to 9 are shown in Fig. 6E. As observed in this figure, an appropriate linear relationship between the pH values and fluorescence intensity was achieved. The regression coefficient factor (R2 = 0.98) shows a decent linearity between the pH values and fluorescence intensities. The results reveal that the synthesized chitosan/CDs nanocomposites can be utilized as an outstanding pH-sensitive probe for biomedical applications, especially for monitoring the pH values during the wound healing process.
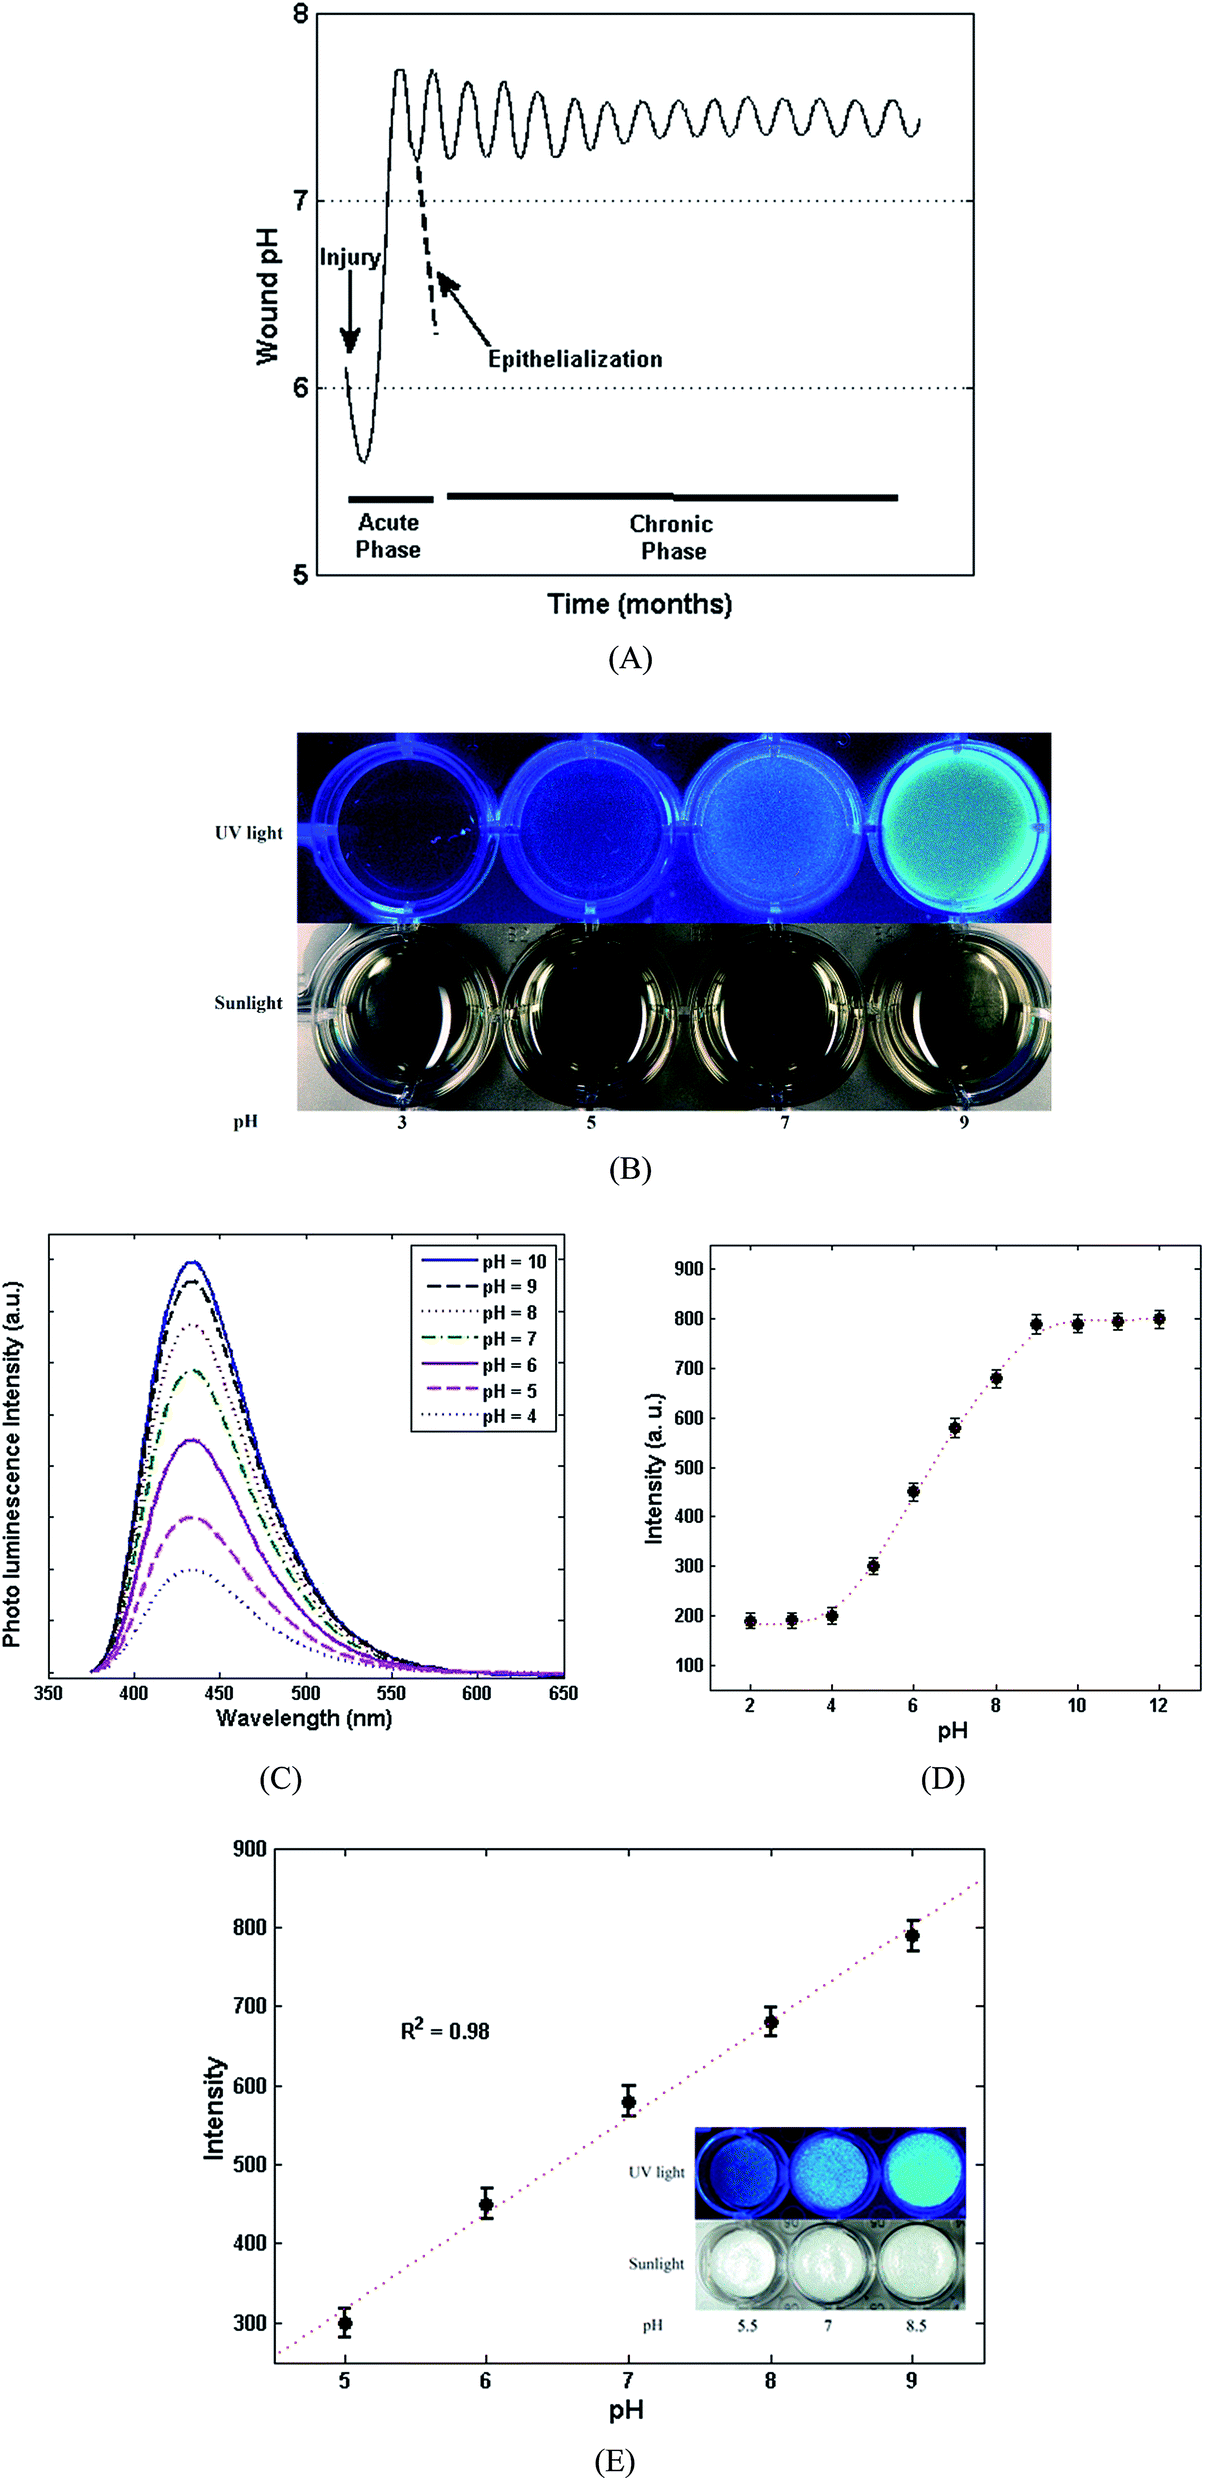 | ||
| Fig. 6 (A) The alteration of pH for acute and chronic wounds. (B) Visual images for illustration of the pH sensitivity of CDs at different pH under UV 365 nm (top) and daylight (down). (C) The fluorescence spectra of CDs at various pH values and 365 nm excitation. (D) Variation of the fluorescence intensities of CDs at different pH values. (E) The linearization of the fluorescence intensity and pH values for 1.0 wt% chitosan/CDs nanocomposite. Inset: photograph of the fluorescence composite at various pH values under UV and daylight. | ||
In order to gain a further insight into the effect of chitosan/CDs nanocomposite on the wound healing process, in vivo experiments were investigated in the rat model. The visual images of an excised wound at different stages and the wound healing's related pH response under UV light are presented in Fig. 7. As can be clearly seen, the untreated wound (control group) does not show a significant treatment or reduction in the size of the wound after 9 and 18 days. Conversely, the dressed wound with chitosan and chitosan/CDs nanocomposite showed noticeable healing after 9 days, and complete healing after 18 days in the case of the CDs/chitosan nanocomposite, indicating the effect of carbon nanoparticles as appropriate antibacterial agents for wound healing. Fig. 7B shows the wound closure of the control, chitosan, and chitosan/CDs nanocomposite after 4, 8 and 16 days. As presented, wound dressing with chitosan and the chitosan/CDs nanocomposite bandage partially reduced the wound size after the passage of 4 and 8 days. However, in the case of the control wound, the negative values of wound closure can be related to the deterioration and enlargement of the undressed wound. After 16 days, the percentage of wound closure was calculated to be about 45% and 62% for the control and dressed wound with the chitosan bandage, respectively. Accordingly, the wound was completely healed after 16 days in the case of the CDs/chitosan nanocomposite, implying the synergetic effect between the carbon nanoparticles and chitosan. Hence, such a great wound healing characteristic of chitosan/CDs nanocomposite can be attributed to the antibacterial properties of carbon nanoparticles, which facilitate the permeation of oxygen for cellular and tissue growth. The pH response for each group of wounds are presented in Fig. 7 as recorded under UV light due to the pH sensitivity of the CDs/chitosan nanocomposite. As the right side of Fig. 7A shows, at the first stage of wound healing, the pH values is acidic (∼5.5), with a low fluorescence emission of chitosan/CDs. The second stage is related to the treatment of the wound at a basic pH (∼7.3), which possesses a higher fluorescence emission rather than at acidic pH values, confirming the high pH sensitivity of chitosan/CDs nanocomposite. At the final stage, the fluorescence emission of chitosan/CDs nanocomposite is quenched compared to the previous stage, indicating completion of the wound healing at the normal pH (5–6) of skin. Therefore, the as-prepared chitosan/CDs nanocomposite can be used as a pH-sensitive and antibacterial wound dressing for the treatment of acute and chronic wounds.
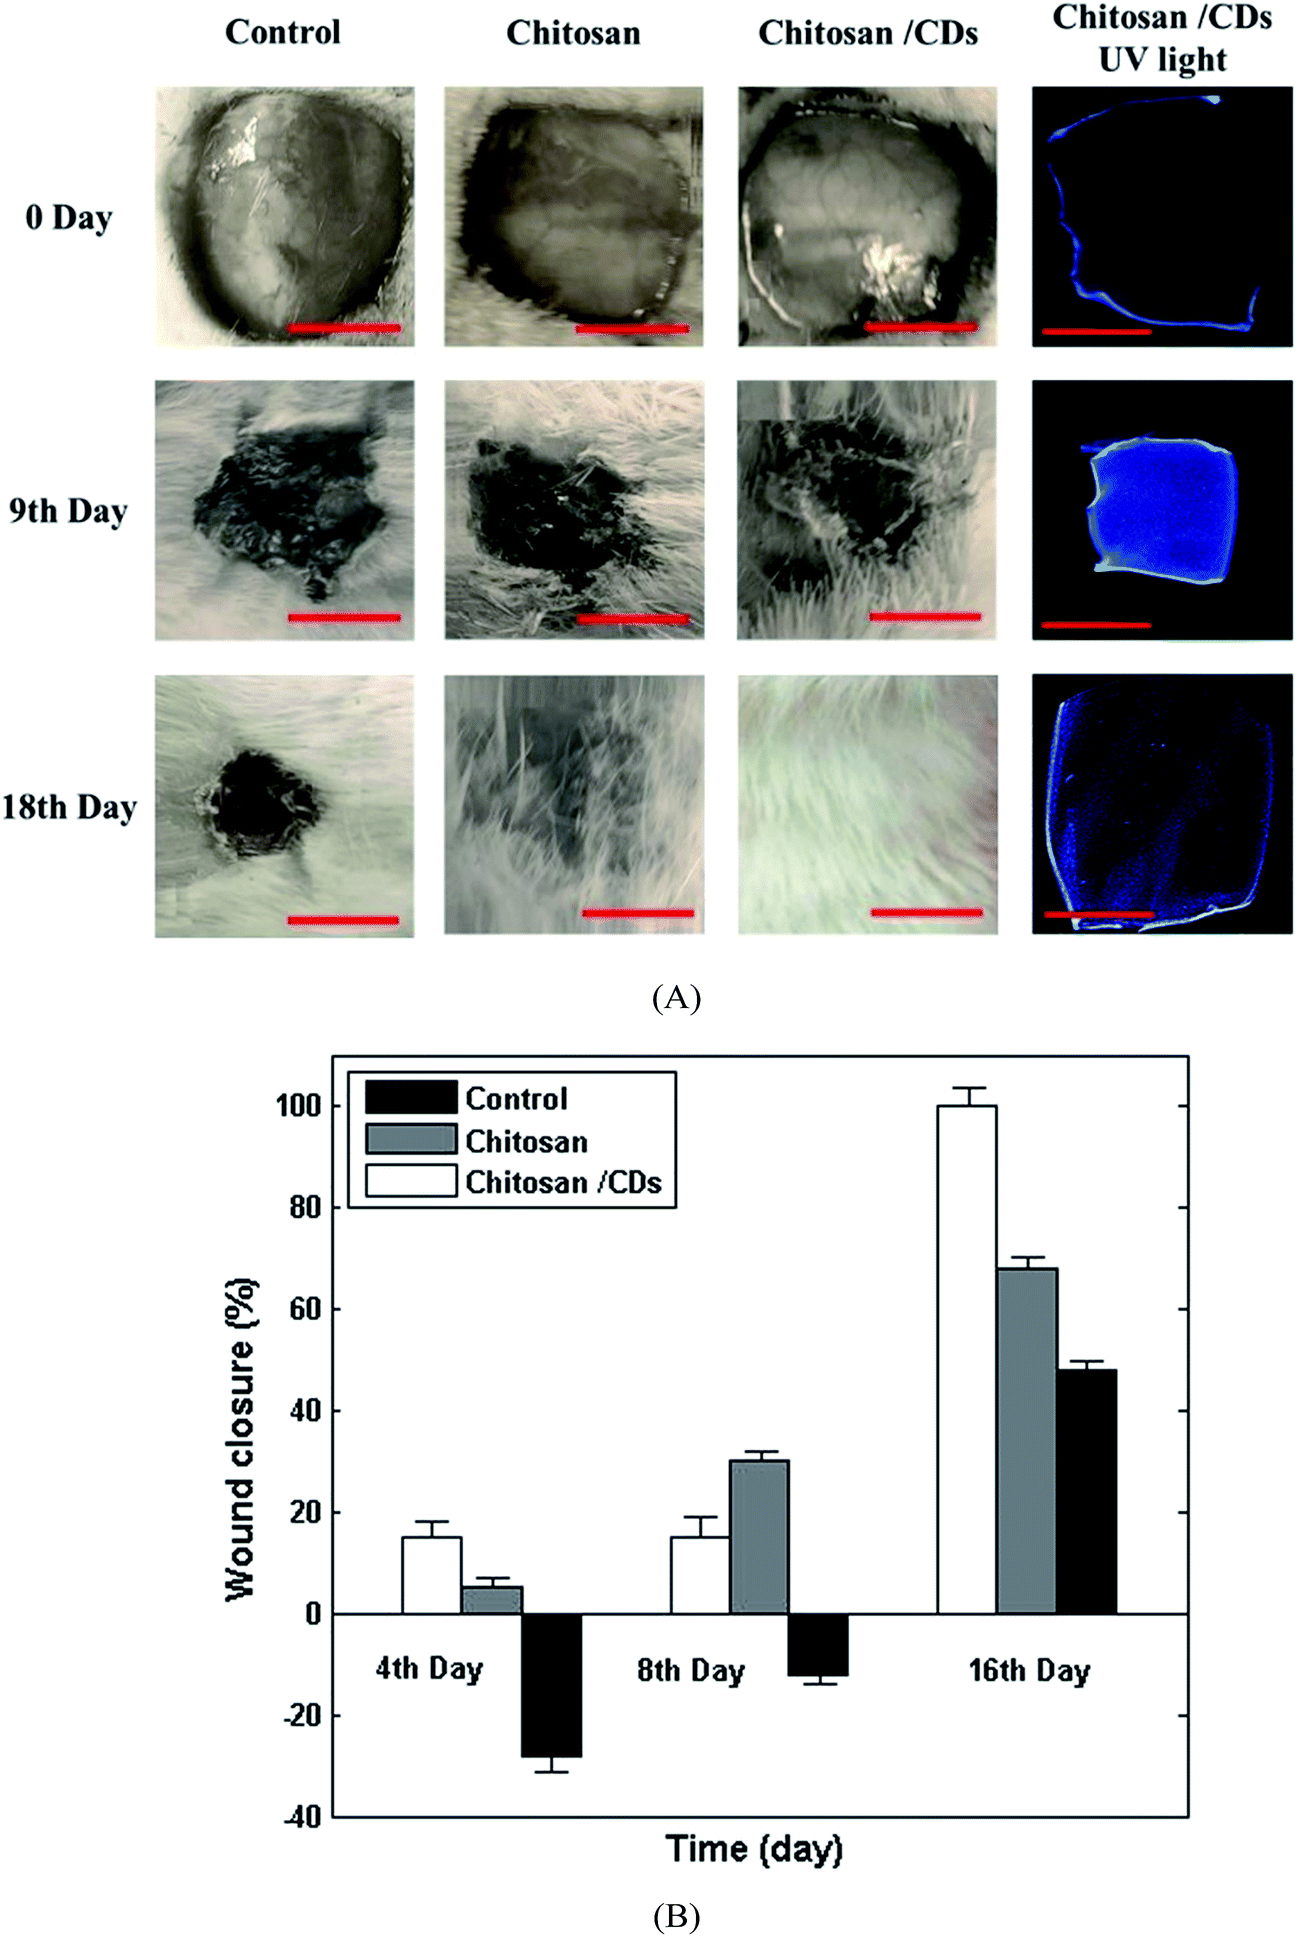 | ||
| Fig. 7 (A) The visual images of the untreated (control) and treated wound with chitosan, and chitosan/CDs nanocomposite at different stages (0, 9 and 18 days); the fluorescence images at the right-hand side show the pH sensitivity of the chitosan/CDs nanocomposite. (B) Wound closure percentage of untreated (control) and treated wounds (chitosan and chitosan/CDs nanocomposite). | ||
4. Conclusion
In this study, a novel carbon dots chitosan nanocomposite film was developed. A simple procedure was proposed for the synthesis of carbon-rich, nitrogen-doped CDs using AHC precursors. The solvent casting method was used for fabrication of the chitosan/CDs nanocomposite. The antibacterial properties and biocompatibility of CDs and chitosan/CDs nanocomposites were examined by antibacterial and cytocompatibility tests. Furthermore, the pH sensitivity of CDs was thoroughly investigated and showed that the proposed pH-sensitive CDs and chitosan/CDs nanocomposites could be introduced as an excellent candidate for monitoring pH during the wound healing process. Due to strong antibacterial properties and nontoxicity towards fibroblasts cell as well as outstanding pH sensitivity, chitosan/CDs nanocomposites can be applied as an effective wound-dressing material for enhancing the healing and pH monitoring of wounds at the same time.Acknowledgements
The Authors would like to thank the supports from Delta Dental, Marquette Innovation Fund, and NSF (CMMI-1363485) and Shahid Beheshti University of Medical Sciences (Grant No. 9266).Notes and references
- C. K. Sen, G. M. Gordillo, S. Roy, R. Kirsner, L. Lambert, T. K. Hunt, F. Gottrup, G. C. Gurtner and M. T. Longaker, Wound Repair Regen, 2009, 17, 763–771 CrossRef PubMed
.
- S. a. Guo and L. A. DiPietro, J. Dent. Res., 2010, 89, 219–229 CrossRef CAS PubMed
- L. A. Schneider, A. Korber, S. Grabbe and J. Dissemond, Arch. Dermatol. Res., 2007, 298, 413–420 CrossRef PubMed
- K. Srinivasan and R. Mahadevan, BMC Biotechnol., 2010, 10, 1 CrossRef PubMed
- L. Shi, S. Ramsay, R. Ermis and D. Carson, Journal of Wound, Ostomy and Continence Nursing, 2011, 38, 514–521 CrossRef PubMed
- S. Trupp, M. Alberti, T. Carofiglio, E. Lubian, H. Lehmann, R. Heuermann, E. Yacoub-George, K. Bock and G. Mohr, Sens. Actuators, B, 2010, 150, 206–210 CrossRef CAS
- V. Sridhar and K. Takahata, Sens. Actuators, A, 2009, 155, 58–65 CrossRef CAS
- J. Phair, L. Newton, C. McCormac, M. F. Cardosi, R. Leslie and J. Davis, Analyst, 2011, 136, 4692–4695 RSC
- T. R. Dargaville, B. L. Farrugia, J. A. Broadbent, S. Pace, Z. Upton and N. H. Voelcker, Biosens. Bioelectron., 2013, 41, 30–42 CrossRef CAS PubMed
- H. M. Wang, M. L. Ho, G. J. Wang, J. K. Chang, Y. T. Chou, C. Y. Wu, and L. E. E. Su-Shin, Biomaterial for wound healing, US Pat. 9,173,969, Kaohsiung Medical University, 2015
- R. Jayakumar, D. Menon, K. Manzoor, S. Nair and H. Tamura, Carbohydr. Polym., 2010, 82, 227–232 CrossRef CAS
- B. Lu, T. Li, H. Zhao, X. Li, C. Gao, S. Zhang and E. Xie, Nanoscale, 2012, 4, 2978–2982 RSC
- H. Sun, N. Gao, K. Dong, J. Ren and X. Qu, ACS Nano, 2014, 8, 6202–6210 CrossRef CAS PubMed
- Y. Zhang, B. Wang, X. Meng, G. Sun and C. Gao, Ann. Biomed. Eng., 2011, 39, 414–426 CrossRef PubMed
- V. Georgakilas, J. A. Perman, J. Tucek and R. Zboril, Chem. Rev., 2015, 115, 4744–4822 CrossRef CAS PubMed
- Z. Guo, Z. Zhang, W. Zhang, L. Zhou, H. Li, H. Wang, C. Andreazza-Vignolle, P. Andreazza, D. Zhao and Y. Wu, ACS Appl. Mater. Interfaces, 2014, 6, 20700–20708 CAS
- X. T. Zheng, A. Ananthanarayanan, K. Q. Luo and P. Chen, Small, 2015, 11, 1620–1636 CrossRef CAS PubMed
- P. Karfa, E. Roy, S. Patra, S. Kumar, A. Tarafdar, R. Madhuri and P. K. Sharma, RSC Adv., 2015, 5, 58141–58153 RSC
- A. Zhao, Z. Chen, C. Zhao, N. Gao, J. Ren and X. Qu, Carbon, 2015, 85, 309–327 CrossRef CAS
- J. Yao, M. Yang and Y. Duan, Chem. Rev., 2014, 114, 6130–6178 CrossRef CAS PubMed
- W. Kong, H. Wu, Z. Ye, R. Li, T. Xu and B. Zhang, J. Lumin., 2014, 148, 238–242 CrossRef CAS
- C. Zheng, X. An and J. Gong, RSC Adv., 2015, 5, 32319–32322 RSC
- B.-L. Wang, X.-S. Liu, Y. Ji, K.-F. Ren and J. Ji, Carbohydr. Polym., 2012, 90, 8–15 CrossRef CAS PubMed
- R. C. Goy, D. d. Britto and O. B. Assis, Polimeros, 2009, 19, 241–247 CAS
- J. F. Prudden, P. Migel, P. Hanson, L. Friedrich and L. Balassa, Am. J. Surg., 1970, 119, 560–564 CrossRef CAS PubMed
- M. S. Lord, B. Cheng, S. J. McCarthy, M. Jung and J. M. Whitelock, Biomaterials, 2011, 32, 6655–6662 CrossRef CAS PubMed
- S. Saravanan, S. Nethala, S. Pattnaik, A. Tripathi, A. Moorthi and N. Selvamurugan, Int. J. Biol. Macromol., 2011, 49, 188–193 CrossRef CAS PubMed
- A. Tripathi, S. Saravanan, S. Pattnaik, A. Moorthi, N. C. Partridge and N. Selvamurugan, Int. J. Biol. Macromol., 2012, 50, 294–299 CrossRef CAS PubMed
- C. Lau, M. J. Cooney and P. Atanassov, Langmuir, 2008, 24, 7004–7010 CrossRef CAS PubMed
- H. Fan, L. Wang, K. Zhao, N. Li, Z. Shi, Z. Ge and Z. Jin, Biomacromolecules, 2010, 11, 2345–2351 CrossRef CAS PubMed
- G. Z. Kyzas and D. N. Bikiaris, Mar. Drugs, 2015, 13, 312–337 CrossRef PubMed
- M. Ul-Islam, W. A. Khattak, M. W. Ullah, S. Khan and J. K. Park, Cellulose, 2014, 21, 433–447 CrossRef CAS
- M. Hashemi, A. Yadegari, G. Yazdanpanah, S. Jabbehdari, M. Omidi and L. Tayebi, RSC Adv., 2016, 6, 74072–74084 RSC
- M. Omidi, G. Amoabediny, F. Yazdian and M. Habibi-Rezaei, Europhys. Lett., 2015, 109, 18005 CrossRef
- S. Zhu, Y. Song, X. Zhao, J. Shao, J. Zhang and B. Yang, Nano Res., 2015, 8, 355–381 CrossRef CAS
- G. T. P. K. Dutta, H. Kumar, T. Jain and Y. Singh, Asian Chitin Journal, 2015, 11, 1–4 Search PubMed
- X. Jia, J. Li and E. Wang, Nanoscale, 2012, 4, 5572–5575 RSC
- Y. Dong, H. Pang, H. B. Yang, C. Guo, J. Shao, Y. Chi, C. M. Li and T. Yu, Angew. Chem., Int. Ed., 2013, 52, 7800–7804 CrossRef CAS PubMed
- Z.-C. Yang, X. Li and J. Wang, Carbon, 2011, 49, 5207–5212 CrossRef CAS
- Y. Guo, P. Yao, D. Zhu and C. Gu, J. Mater. Chem. A, 2015, 3, 13189–13192 CAS
- Y. Li, Y. Zhao, H. Cheng, Y. Hu, G. Shi, L. Dai and L. Qu, J. Am. Chem. Soc., 2011, 134, 15–18 CrossRef PubMed
- M. Omidi, Hossein Rokni D. T., A. S. Milani, R. J. Seethaler and R. Arasteh, Carbon, 2010, 48, 3218–3228 CrossRef CAS
- A. W. Hayes and C. L. Kruger, Hayes' Principles and Methods of Toxicology, CRC Press, 2014 Search PubMed
- M. J. Hajipour, K. M. Fromm, A. A. Ashkarran, D. J. de Aberasturi, I. R. de Larramendi, T. Rojo, V. Serpooshan, W. J. Parak and M. Mahmoudi, Trends Biotechnol., 2012, 30, 499–511 CrossRef CAS PubMed
- G. Gethin, Wounds UK, 2007, 3, 52 Search PubMed
| This journal is © The Royal Society of Chemistry 2017 |