 Open Access Article
Optimized preparation of micro-block CPAM by response surface methodology and evaluation of dewatering performance†
Xiang Liab,
Huaili Zheng*ab,
Baoyu Gao c,
Yongjun Sund,
Xiaomin Tange and
Bincheng Xuab
aKey Laboratory of the Three Gorges Reservoir Region's Eco-Environment, State Ministry of Education, Chongqing University, Chongqing 400045, China. E-mail: lx33cqu@163.com; zhl6512@126.com; Fax: +86 23 65120827; Tel: +86 23 65120827
bNational Centre for International Research of Low-carbon and Green Buildings, Chongqing University, Chongqing 400045, China
cShandong Key Laboratory of Water Pollution Control and Resource Reuse, School of Environmental Science and Engineering, Shandong University, Ji'nan 250100, China
dJiangsu Key Laboratory of Industrial Water-Conservation & Emission Reduction, College of Urban Construction, Nanjing Tech University, Nanjing, 211800, China
eChongqing Key Laboratory of Catalysis and Environmental New Materials, College of Environment and Resources, Chongqing Technology and Business University, Chongqing 400067, P. R. China
First published on 22nd December 2016
Abstract
Micro-block cationic polyacrylamide (P(AM-MAPTAC)) was synthesized through UV-initiated template copolymerization and characterized by FTIR, 1H NMR, SEM and TG/DSC analyses. Furthermore, the main influence factors of the preparation process were optimized through Box–Behnken experiment design and Respond Surface Method (RSM). The maximum intrinsic viscosity of micro-block CPAM was 13.223 dL g−1 under the optimum synthesis conditions. The dewatering performance of micro-block CPAM was evaluated taking activated sludge collected from a dyeing mill as the processing object. Results showed that the micro-block CPAM exhibited excellent dewatering performance. At a 30 mg L−1 dosage of micro-block CPAM, the residual turbidity, filter cake moisture content, specific resistance to filtration and chemical oxygen demand removal rate reached 4.47 NTU, 72.2%, 5.47 (1012 m kg−1) and 79.2%, respectively. Dewatering tests not only demonstrated the superiority of micro-block P(AM-MAPTAC) synthesized by UV-initiated template copolymerization over that synthesized by traditional methods but also demonstrated that increasing the molecular weight can further enhance the dewatering performance of flocculants.
Introduction
With the increasing development of the textile industry, dyeing wastewater discharge increases year by year, and a large amount of excess sludge is ultimately produced. Excess sludge disposal has become a major factor restricting the development of the textile industry. Dyeing excess sludge with a high moisture content, complex composition, and high content of harmful substances is categorized as hazardous solid waste.1,2 It is of very important significance to realize a harmless, reduction and stabilization treatment of dyeing excess sludge along with the increase of environmental awareness and strict environmental regulations. In the process of dyeing excess sludge treatment, the moisture content of the concentrated sludge is more than 97%.3 Therefore, dewatering is the most important means of sludge reduction in the whole sludge treatment system. Excess sludge is a colloidal system in which fine sludge particles are suspended in water owing to electrostatic repulsion and is difficult to condense to form a large particle size to facilitate subsequent dewatering process.4,5 Therefore, before the mechanical dewatering, it is necessary to adjust the sludge properties to enhance its dewatering performance.Cationic polyacrylamide (CPAM) is a kind of synthetic organic compound with excellent sludge dewatering performance.6,7 Positive charged CPAM can effectively neutralize the negative charge on the surface of sludge. Furthermore, long chain molecular structure is conducive to adsorption and bridging effect in the coagulation–flocculation process. Relative molecular weight and cationic degree are considered to be the two most important parameters affecting the flocculation performance of CPAM. Relative molecular weight (limiting viscosity) directly affects the efficiency of bridging effect.8,9 Therefore, to improve the relative molecular weight (MW) of polymer has become an important research direction in CPAM synthesis.10–12 The cationic degree (CD) is closely related to the electrical neutralization performance of CPAM. Besides, CD can also affect the morphology of CPAM in aqueous solution. The strength of the electrostatic repulsion between the positive charges in the CPAM molecular chain can affect the extension of the CPAM molecular chain in water.13–15 However, due to the higher price of the cationic monomer, it is uneconomical to enhance the dewatering performance of CPAM only by increasing the CD. In recent years, researchers have begun to pay attention to the effect of CPAM sequence structure distribution on flocculation performance and some studies have indicated that polymer with cationic micro-block structure is more conducive to the coagulation–flocculation process.16–19 Our previous works have also proved the cationic micro-block structure in CPAM chain is conducive to the electrical neutralization and thus enhance the dewatering performance of CPAM, furthermore, verified the feasibility of synthesizing CPAM with micro-block structure by UV-initiated mode in combination with template polymerization technology.20,21 However, the CPAM with cationic micro-block structure synthesized in our previous works were all with lower molecular weight and thus with a weaker adsorption bridging effect. Therefore, in order to make CPAM play both strong electrical neutralization and adsorption bridging effect in coagulation–flocculation process, it is necessary to optimize the preparation conditions of CPAM to obtain CPAM with both cationic micro-block structure and high relative molecular.
Response surface analysis (RSM) is a statistical method for process design and parameter optimization. In this method, the continuous variable surface model is established to evaluate the factors that affect the reaction process and their interaction, so as to obtain the best experimental conditions. This method has the advantages of short experimental period and can directly reflect the optimal value of the dependent variable, thus received wide attention and extensive application. Hence, this method was used to optimize the synthesis conditions of micro-block CPAM in this study.
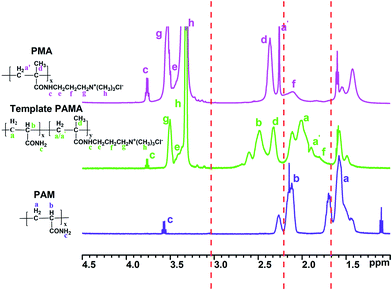
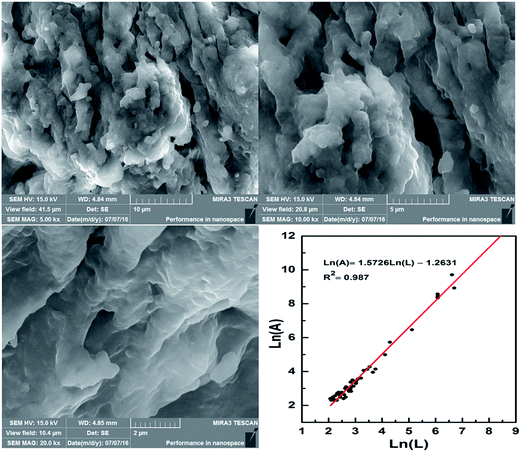
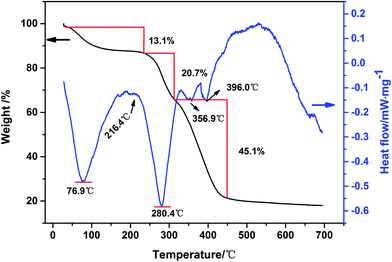
In the present study, CPAM with micro-block was synthesized by UV-initiated template polymerization. The properties of micro-block CPAM were tested by using Fourier transform infrared spectroscopy (FTIR), 1H nuclear magnetic resonance (1H NMR), scanning electron microscopy (SEM) and thermal analysis (TG/DSC). Box–Behnken experiment design and Respond Surface Method (RSM) were used to optimize the synthesis conditions of micro-block CPAM. Furthermore, flocculation performance of micro-block CPAM were explored in terms of residual turbidity (RT), filter cake moisture content (FCMC), specific resistance to filtration (SRF), chemical oxygen demand (COD) of supernatant and floc properties.
Materials and methods
Materials
| Flocculants | Full name of flocculants | Intrinsic viscosity dL g−1 | Cationic degree (%) |
|---|---|---|---|
| a Flocculants P was synthesized by UV-initiated copolymerization without addition template PAAS.b Flocculants CPAM was commercial product and synthesized taking DAC as the cation monomer. | |||
| TP1 | Template poly(AM-MAPTAC) 1# | 9.050 | 25 |
| TP2 | Template poly(AM-MAPTAC) 2# | 11.280 | 25 |
| TP3 | Template poly(AM-MAPTAC) 3# | 13.223 | 25 |
| Pa | P(AM-MAPTAC) | 13.348 | 25 |
| CPAMb | Commercial P(AM-DAC) | 13.386 | 25 |
Optimize synthesis conditions by RSM
The synthesis process and characterization methods were described in S1 and S2 Texts.† An integrative method of Box–Behnken (BBD) and RSM was used to optimize the synthesis process of micro-block P(AM-MAPTAC), the experimental range for independent variables was preliminary trials based, with negligible error. In the optimization test, five independent variables, pH (X1), concentration of initiator (wt% of total monomer) (X2), mole ratio of PAAS and MAPTAC (n(PAAS/MAPTAC)) (X3), mole ratio of MAPTAC and AM (n(MAPTAC/AM)) (X4), irradiation time (t/min) (X5) were chosen for BBD-RSM approach, while intrinsic viscosity (η/dL g−1) was considered as response variable. The details of BBD experimental design are listed in Table 2. B46 (35) was used to improve the experiment. As given in Table 2, eqn (1) was used to account for the control and prediction of optimization process.
 | (1) |
| Independent variables | Code | Levels | ||
|---|---|---|---|---|
| −1 | 0 | 1 | ||
| pH | X1 | 3 | 4.75 | 6.5 |
| Va-044 (wt%) | X2 | 0.02 | 0.07 | 0.12 |
| n(PAAS/MAPTAC) | X3 | 0.5 | 1 | 1.5 |
| n(MAPTAC/AM) | X4 | 0.15 | 0.33 | 0.5 |
| t (min) | X5 | 30 | 60 | 90 |
Dewatering tests
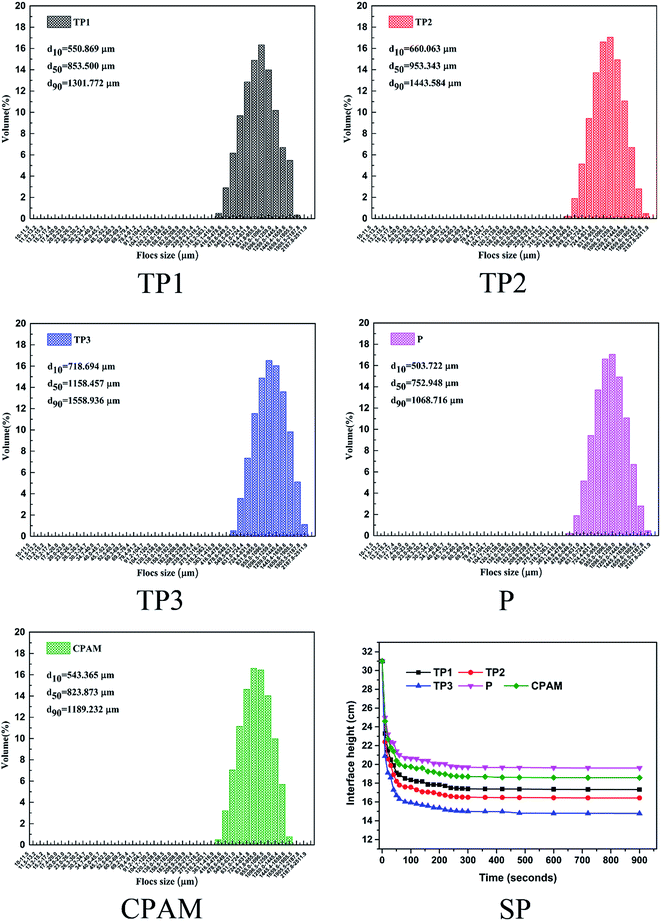
1 g L−1 (concentration of pure flocculants) of flocculants were pre prepared by dissolving a certain amount of solid flocculants in 100 ml distilled water. All the dewatering tests were conducted on a program-controlled jar-test apparatus (ZR4-6, Zhongrun Water Industry Technology Development Co., China) at room temperature. RT and COD of supernatant, FCMC and SRF of sludge were used to evaluate the dewatering performance of flocculants. In the sludge dewatering test, a set dosage of flocculants was added into 250 ml beaker with 100 ml initial dyeing excess sludge and the pH was adjusted with sodium hydroxide (0.1 mol L−1) and hydrochloric acid (0.1 mol L−1) to the set value. Then quickly stirring at 120 rpm for 20 s and followed by 40 rpm for 60 s, then stand for 10 min. The supernatant 1 cm below the water surface was collected for the measurement of RT, COD and zeta potential, and then the conditioned sludge samples were filtered through a vacuum suction filter machine under a pressure of 0.05 MPa for 30 min for the FCMC and SRF measure. The detail measure methods of RT, COD, zeta potential, FCMC and SRF are described in S3 Text.† The sludge settle performance was conducted in a 500 ml graduated cylinder. 500 ml original dyeing sludge with 30 mg L−1 dosage of flocculants was firstly rapid mixed in a beaker and then poured into a 500 ml graduated cylinder. After quickly and repeatedly inverted for 4 times, the height of the solid–liquid surface with time was immediately recorded until the height remained unchanged. Finally, the sludge flocs were collected for size measurement using a laser diffraction instrument (Mastersizer 2000, Malvern, U.K.). The measurement of each sample was repeated conducted for three times, and the average value was taken as the final value for analysis.Results and discussion
Structure identification
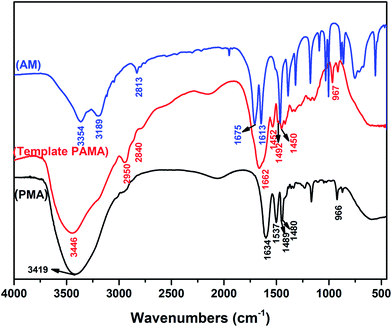
![[double bond, length as m-dash]](https://www.rsc.org/images/entities/char_e001.gif) O and C
O and C![[double bond, length as m-dash]](https://www.rsc.org/images/entities/char_e001.gif) C; asymmetry stretching vibration of H–C
C; asymmetry stretching vibration of H–C![[double bond, length as m-dash]](https://www.rsc.org/images/entities/char_e001.gif) and symmetric stretching vibration of H–C
and symmetric stretching vibration of H–C![[double bond, length as m-dash]](https://www.rsc.org/images/entities/char_e001.gif) .22,23 As shown in Fig. 1 (PMA), the absorption peaks at 3419, 2942, 1634, 1537, 1489, 1480 and 966 cm−1 were assigned to stretching vibration of N–H, –CH3, C
.22,23 As shown in Fig. 1 (PMA), the absorption peaks at 3419, 2942, 1634, 1537, 1489, 1480 and 966 cm−1 were assigned to stretching vibration of N–H, –CH3, C![[double bond, length as m-dash]](https://www.rsc.org/images/entities/char_e001.gif) O, N–H and methyl groups of quaternary ammonium; deformation vibration of the methylene group in MAPTAC unit and N+ (CH3)3 stretching vibration.24 Comparing with Fig. 1 (AM) and (PMA), as shown in Fig. 1 (template PAMA), the peaks at 3189, 2813 and 1613 cm−1 which represent C
O, N–H and methyl groups of quaternary ammonium; deformation vibration of the methylene group in MAPTAC unit and N+ (CH3)3 stretching vibration.24 Comparing with Fig. 1 (AM) and (PMA), as shown in Fig. 1 (template PAMA), the peaks at 3189, 2813 and 1613 cm−1 which represent C![[double bond, length as m-dash]](https://www.rsc.org/images/entities/char_e001.gif) C in AM disappeared; the peaks at 2942, 1489, 1480 and 966 cm−1 which represent MAPTAC unit were observed and the peaks at 3354(3419) and 1675(1634) which represent N–H and C
C in AM disappeared; the peaks at 2942, 1489, 1480 and 966 cm−1 which represent MAPTAC unit were observed and the peaks at 3354(3419) and 1675(1634) which represent N–H and C![[double bond, length as m-dash]](https://www.rsc.org/images/entities/char_e001.gif) O both in AM and MAPTAC unit were also observed. All the corresponding peaks in template PAMA had a certain shift comparing with those in AM and MAPTAC. Therefore, all these characteristic peaks confirmed that the two monomers were successfully copolymerized.
O both in AM and MAPTAC unit were also observed. All the corresponding peaks in template PAMA had a certain shift comparing with those in AM and MAPTAC. Therefore, all these characteristic peaks confirmed that the two monomers were successfully copolymerized.
Optimize synthesis conditions by RSM
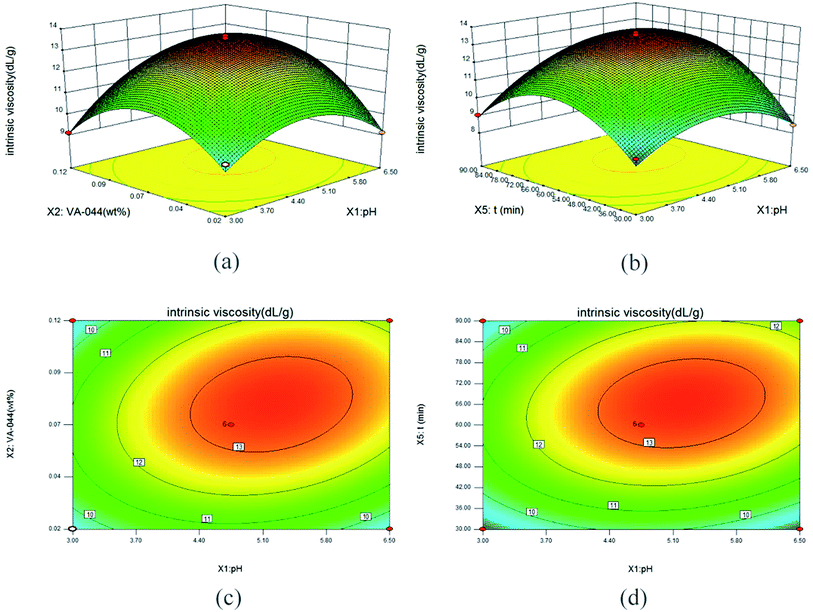
The regression model of intrinsic viscosity affected by pH, concentration of initiator, mole ratio of PAAS and MAPTAC, mole ratio of MAPTAC and AM and irradiation time were calculated using the least square method with the experimental data (S1 Table†). The final regression equation in terms of coded factors and the detail of variance analysis of the regression model are shown as eqn (2) and listed in Table 3 respectively. As shown in Table 3, the F-value is 34.35, and p-value (Prob > F) is less than 0.05 indicating statistically significance of this model. At the same time, R2-value of 0.9648 suggested a relatively strong correlation between the observed and predicted values. This model could be used to analyze and predict the optimal conditions for the synthesis of template PAMA by UV-initiated template copolymerization. Furthermore, X1, X2, X4, X5, X1X2, X1X5, X12, X22, X32, X42, X52 were significant model terms, and the order of significant effect were irradiation time (t/min) (X5) > pH (X1) > mole ratio of MAPTAC and AM (X4) > concentration of initiator (X2).| [η] = 13.25 + 0.63X1 + 0.57X2 − 0.19X3 + 0.61X4 + 0.81X5 + 0.71X1X2 + 0.33X1X3 + 0.31X1X4 + 0.66X1X5 + 0.096X2X3 + 0.36X2X4 + 0.16X2X5 + 0.31X3X4 + 0.32X3X5 − 0.058X4X5 − 1.52X12 − 1.90X22 − 0.53X32 − 1.00X42 − 2.32X52 | (2) |
| Source | Sum of squares | df | Mean square | F value | P value Prob > F | |
|---|---|---|---|---|---|---|
| Model | 102.78 | 20 | 5.14 | 34.35 | <0.0001 | Significant |
| X1 | 6.38 | 1 | 6.38 | 42.65 | <0.0001 | |
| X2 | 5.15 | 1 | 5.15 | 34.41 | <0.0001 | |
| X3 | 0.57 | 1 | 0.57 | 3.83 | 0.0616 | |
| X4 | 5.92 | 1 | 5.92 | 39.58 | <0.0001 | |
| X5 | 10.48 | 1 | 10.48 | 70.02 | <0.0001 | |
| X1X2 | 2.01 | 1 | 2.01 | 13.42 | 0.0012 | |
| X1X3 | 0.42 | 1 | 0.42 | 2.82 | 0.1053 | |
| X1X4 | 0.37 | 1 | 0.37 | 2.5 | 0.1266 | |
| X1X5 | 1.76 | 1 | 1.76 | 11.73 | 0.0021 | |
| X2X3 | 0.037 | 1 | 0.037 | 0.25 | 0.624 | |
| X2X4 | 0.51 | 1 | 0.51 | 3.43 | 0.076 | |
| X2X5 | 0.11 | 1 | 0.11 | 0.71 | 0.4059 | |
| X3X4 | 0.38 | 1 | 0.38 | 2.57 | 0.1215 | |
| X3X5 | 0.41 | 1 | 0.41 | 2.71 | 0.1121 | |
| X4X5 | 0.013 | 1 | 0.013 | 0.089 | 0.7677 | |
| X12 | 20.21 | 1 | 20.21 | 135.06 | <0.0001 | |
| X22 | 31.35 | 1 | 31.35 | 209.53 | <0.0001 | |
| X32 | 2.45 | 1 | 2.45 | 16.36 | 0.0004 | |
| X42 | 8.76 | 1 | 8.76 | 58.52 | <0.0001 | |
| X52 | 47.05 | 1 | 47.05 | 314.46 | <0.0001 | |
| Residual | 3.74 | 25 | 0.15 | |||
| Lack of fit | 3.27 | 20 | 0.16 | 1.74 | 0.2806 | Not significant |
| Pure error | 0.47 | 5 | 0.094 | |||
| Cor total | 106.52 | 45 |
Dyeing sludge dewatering
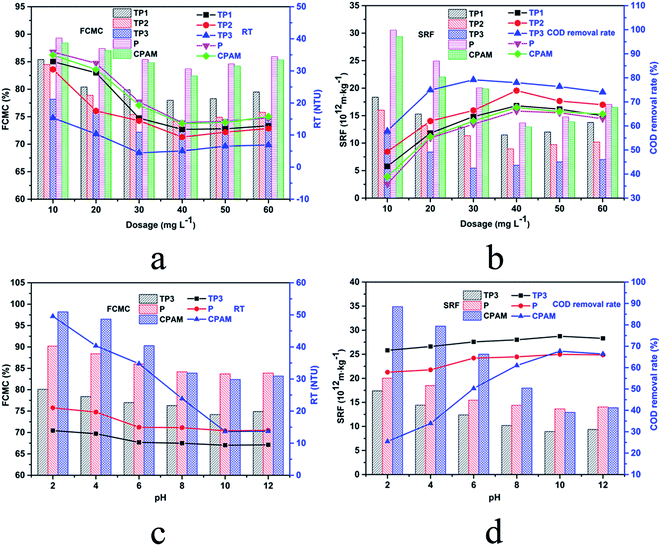
Compare analysis of TP1, TP2 and TP3 which featured the same cationic degree but different intrinsic viscosity, the dewatering efficiency of flocculants derived from the analysis of the indicators were enhanced with the increase of viscosity. This phenomenon indicated that in the sludge conditioning process by this kind of flocculants, bridging effect also played a crucial role. In the process of bridging, the polymer chains can span and reduce the gap between the colloidal particles to make the colloid destabilized and gathered to settle. Polymer with higher intrinsic viscosity feature longer molecular chain, consequently improve the collision probability between flocculants and sludge particle, which is conducive to the trapping and bridging action for colloidal particle.35 Therefore, to improve the intrinsic viscosity of flocculants is one of the important means to enhance the flocculation efficiency. In addition, these results indicated the significance of RSM optimize section in this paper.
In view of the importance of sludge pH in the flocculation process and the pH diversity of sludge to be treated, the study of relationship between the dewatering performance and the pH value of sludge is of great practical significance. The effect of sludge pH on dewatering performance is illustrated in Fig. 6c and d. With the increased pH, after sludge treated by CPAM, the RT, FCMC and SRF sharply decreased to the minimum (13.66 NTU, 82.4% and 12.93 × 10¹² m kg−1) at pH 10.0, in addition, the COD removal rate sharply increased to the maximum (67.7%) accordingly. The results indicated that alkaline conditions were more favorable for CPAM to exert flocculation efficiency in the process of dyeing sludge dewatering. However, as shown in Fig. 6c and d, comparing with CPAM, after treated by TP3 and P, the change of the four indicators was slight. This phenomenon could be explained by the high stability of polymer chain of TP3 and P under acid/base condition which could attribute the success to the stable amide bond in the TP3 and P molecular chain instead of acyl oxygen bond in the CPAM molecular chain.
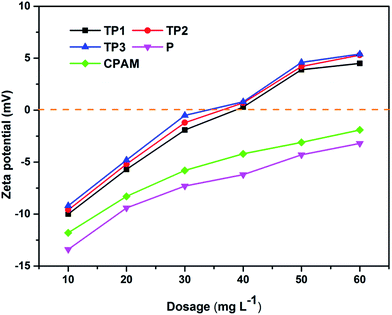
Adsorption bridging and charge neutralization are the main mechanism of flocculation process. In addition, zeta potential of flocculation system can verify the charge neutralization effect directly and effectively.38 Fig. 9 illustrates the zeta potential of flocculation system along with the increasing of flocculants dosage. All the zeta potential of system after flocculation process were increased with the increased dosage. This phenomenon indicated charge neutralization played an important role in the flocculation process. Zeta potential of TP1, TP2 and TP3 at their optimum dosage were all close to zero indicated charge neutralization was the mainly flocculation mechanism.39 However, zeta potential of P and CPAM at their optimum dosage were all below zero indicated that charge neutralization played a less important role than that of TP1, TP2 and TP3. Furthermore, TP1, TP2 and TP3 had the almost same of zeta potential which can be considered as the same charge neutralization effect, yet with different dewatering performance. This phenomenon could attribute to the different intrinsic viscosity of polymer which could affect the adsorption bridging effect in flocculation process.
Conclusions
In this research, UV-initiated template copolymerization technology was used to prepare cationic polyacrylamide with micro-block structure. All the results of structural characterization verified the successful synthesis and existence of micro-block structure. Furthermore, in order to promote its molecular weight, Box–Behnken experiment design and Respond Surface Method (RSM) were employed to optimum the synthesis conditions taking intrinsic viscosity as the response factor. The optimum synthesis conditions were 4.75 for pH, 0.07 wt% for initiator concentration, 1.0 for mole ratio of PAAS and MAPTAC, 0.33 for mole ratio of MAPTAC and AM, and 60 min for irradiation time respectively, and under these conditions, about 13.223 dL g−1 of intrinsic viscosity can be obtained. Results of dyeing sludge dewatering tests showed that the TP3 with micro-block structure exhibited excellent dewatering performance and at 30 mg L−1 of dosage, and 10.0 of pH, the RT, FCMC, SRF and COD removal rate reached the optimum of 4.47 NTU, 72.2%, 5.47 (1012 m kg−1) and 79.2% respectively; in the range below the optimum intrinsic viscosity obtained in this research, the dewatering performance was promoted along with the increased intrinsic viscosity; TP series of flocculants which synthesized taking MAPTAC as the cation monomer had a wider range of pH application than DAC series of flocculants (CPAM).Abbreviations
| AM | Acrylamide |
| MAPTAC | Methacrylamido propyl trimethyl ammonium chloride |
| DAC | Acryloyloxyethyltrimethylammonium chloride |
| CPAM | Cationic polyacrylamide |
| UV | Ultraviolet |
| PAAS | Sodium polyacrylate |
| VA-044 | 2,2′-Azobis[2-(2-imidazolin-2-yl)propane]dihydrochloride |
| 1H NMR | 1H nuclear magnetic resonance |
| FTIR | Fourier transform-infrared spectroscopy |
| SEM | Scanning electron microscopy |
| TG/DSC | Thermogravimetric/differential scanning calorimetry |
| RT | Residual turbidity |
| FCMC | Filter cake moisture content |
| SRF | Specific resistance to filtration |
| TP(1-3) | Template poly(AM-MAPTAC)(1-3) |
| P | Poly(AM-MAPTAC) |
| COD | Chemical oxygen demand |
| RSM | Response surface analysis |
| MW | Molecular weight |
| CD | Cationic degree |
Acknowledgements
This research was supported by the National Natural Science Foundation of China (Project No. 21477010) and 111 Project (Project No. B13041).References
- H. J. Luo, X. A. Ning, X. J. Liang, Y. F. Feng and J. Y. Liu, Bioresour. Technol., 2013, 139, 330–336 CrossRef CAS PubMed.
- X. A. Ning, Y. F. Feng, J. J. Wu, C. M. Chen, Y. J. Wang and J. Sun, et al., J. Environ. Manage., 2015, 162, 81–86 CrossRef CAS PubMed.
- H. L. Zheng, Y. J. Sun, C. J. Zhu, J. S. Guo, C. Zhao and Y. Liao, et al., Chem. Eng. J., 2013, 234, 318–326 CrossRef CAS.
- J. R. Zhu, H. L. Zheng, Z. Z. Jiang, Z. Zhang, L. W. Liu and Y. J. Sun, Desalin. Water Treat., 2012, 51, 2791–2801 CrossRef.
- Y. Qi, K. B. Thapa and A. F. A. Hoadley, Chem. Eng. J., 2011, 171, 373–384 CrossRef CAS.
- Y. Liao, H. L. Zheng, L. Qian, Y. J. Sun, L. Dai and W. W. Xue, Ind. Eng. Chem. Res., 2014, 53, 11193–11203 CrossRef CAS.
- Y. X. Zhao, B. Y. Gao, Q. B. Qi, Y. Wang, S. Phuntsho and J. H. Kim, et al., J. Hazard. Mater., 2013, 258–259C(6), 84–92 CrossRef PubMed.
- H. L. Zheng, Y. J. Sun, J. S. Guo, F. Li, W. Fan and Y. Liao, et al., Ind. Eng. Chem. Res., 2014, 53, 2572–2582 CrossRef CAS.
- Y. J. Sun, W. Fan, H. L. Zheng, Y. X. Zhang, F. T. Li and W. Chen, PLoS One, 2015, 10(6), e0130683 Search PubMed.
- J. R. Zhu, H. L. Zheng, Z. Z. Jiang, Z. Zhang, L. W. Liu and Y. J. Sun, et al., Desalin. Water Treat., 2013, 51(13–15), 2791–2801 CrossRef CAS.
- X. G. Liu, Q. Chen, K. Xu, X. D. Zhang and P. X. J. Wang, Appl. Polym. Sci., 2009, 113(4), 2693–2701 CrossRef CAS.
- H. L. Zheng, Y. Liao, M. Z. Zheng, C. J. Zhu, F. Y. Ji and J. Y. Ma, et al., Sci. World J., 2014, 2014, 1–11 Search PubMed.
- B. Bolto and J. Gregory, Water Res., 2007, 41, 2301–2324 CrossRef CAS PubMed.
- Y. Zhou, G. J. Jameson and G. V. Franks, Colloids Surf., A, 2008, 331(3), 183–194 CrossRef CAS.
- Y. Zhou and G. V. Franks, Langmuir, 2006, 22(16), 6775–6786 CrossRef CAS PubMed.
- L. J. Wang, G. D. Li, Y. Q. Zhang and H. J. Xiao, Appl. Polym. Sci., 2013, 130(6), 4040–4046 CAS.
- W. C. Chai, Y. W. Zhang and Y. F. Hou, Polym. Chem., 2013, 4(4), 1006–1013 RSC.
- A. Q. Zhang, Y. H. Shen, X. Y. Zhang, L. C. Han and Z. Z. Wang, J. Polym. Res., 2009, 17(1), 11–17 Search PubMed.
- M. Ma and S. Zhu, Colloid Polym. Sci., 1999, 277(2–3), 123–129 CAS.
- W. Chen, H. L. Zheng, Q. Q. Guan, H. K. Teng, C. Zhao and C. L. Zhao, Ind. Eng. Chem. Res., 2016, 55, 2892–2902 CrossRef CAS.
- Q. Q. Guang, H. L. Zheng, J. Zhai, B. Z. Liu, Y. J. Sun and Y. L. Wang, et al., J. Appl. Polym. Sci., 2015, 132, 41747 CrossRef.
- P. Lanthong, R. Nuisin and S. Kiatkamjornwong, Carbohydr. Polym., 2006, 66, 229–245 CrossRef CAS.
- N. Şahiner, S. Malcı, Ö. Çelikbıçak, Ö. Kantoğlu and B. Salih, Radiat. Phys. Chem., 2005, 74, 76–85 CrossRef.
- A. Pourjavadi, S. M. Fakoorpoor and S. H. Hosseini, Carbohydr. Polym., 2013, 93, 506–511 CrossRef CAS PubMed.
- K. H. Hong, N. Liu and G. Sun, Eur. Polym. J., 2009, 45, 2443–2449 CrossRef CAS.
- B. Kordoghli, R. Khiari, M. F. Mhenni, F. Sakli and M. N. Belgacem, Appl. Surf. Sci., 2012, 258, 9737–9741 CrossRef CAS.
- G. C. Zhu, H. L. Zheng, Z. Zhang, T. Tshukudu, P. Zhang and X. Y. Xiang, Chem. Eng. J., 2011, 178, 50–59 CrossRef CAS.
- H. L. Zheng, G. C. Zhu, S. J. Jiang, T. Tshukudu, X. Y. Xiang and P. Zhang, et al., Desalination, 2011, 269, 148–156 CrossRef CAS.
- L. Ghimici, I. Dranca, S. Dragan, T. Lupascu and A. Maftuleac, Eur. Polym. J., 2001, 37, 227–231 CrossRef CAS.
- Q. Q. Guan, H. L. Zheng, J. J. Zhai, C. Zhao, X. K. Zheng and X. M. Tang, et al., Ind. Eng. Chem. Res., 2014, 53, 5624–5635 CrossRef CAS.
- Z. Abdollahi, M. Frounchi and S. S. J. Dadbin, Ind. Eng. Chem., 2011, 17(3), 580–586 CrossRef CAS.
- J. P. Wang, S. J. Yuan, Y. Wang and H. Q. Yu, Water Res., 2013, 47(8), 2643–2648 CrossRef CAS PubMed.
- Z. Yang, H. Yang, Z. W. Jiang, T. Cai, H. J. Li and H. B. Li, et al., J. Hazard. Mater., 2013, 254, 36–45 CrossRef PubMed.
- G. C. Zhu, H. L. Zheng, W. Y. Chen, W. Fan, P. Zhang and T. Tshukudu, Desalination, 2012, 285, 315–323 CrossRef CAS.
- M. Hjorth and B. U. Jørgensen, Water Res., 2012, 46(4), 1045–1051 CrossRef CAS PubMed.
- Y. G. Chen, Y. S. Chen and G. W. Gu, Chem. Eng. J., 2004, 99, 137–143 CrossRef CAS.
- A. R. Heath, P. A. Bahri, P. D. Fawell and J. B. Farrow, AIChE J., 2006, 52(6), 1987–1994 CrossRef.
- B. Y. Gao, Y. Wang, Q. Y. Yue, J. C. Wei and Q. Li, Sep. Purif. Technol., 2007, 54, 157–163 CrossRef CAS.
- E. Pefferkorn, Adv. Colloid Interface Sci., 2006, 120, 33–45 CrossRef CAS PubMed.
Footnote |
| † Electronic supplementary information (ESI) available. See DOI: 10.1039/c6ra25245a |
| This journal is © The Royal Society of Chemistry 2017 |

