
 Open Access Article
 This Open Access Article is licensed under a
 Creative Commons Attribution 3.0 Unported Licence
Facile synthesis of KCl:Sm3+ nanophosphor as a new OSL dosimetric material achieved through charge transfer between the defect states
Mini Agarwal a,
S. K. Gargb,
K. Asokanb,
D. Kanjilalb and
Pratik Kumar*a
a,
S. K. Gargb,
K. Asokanb,
D. Kanjilalb and
Pratik Kumar*a
aMedical Physics Unit, IRCH, AIIMS, New Delhi-110 029, India. E-mail: drpratikkumar@gmail.com
bInter-University Accelerator Centre, Aruna Asaf Ali Marg, New Delhi-110 067, India
First published on 1st March 2017
Abstract
Since precise control of nanoscale features is in high demand, it is being exploited to develop and improve OSL dosimetric materials, where striking improvement might also be expected in lanthanide-doped metal halides. The major challenge in the development of a nanophosphor lies in avoiding the aggregation of a dopant element in host materials, which has long prevented an in-depth exploration for the same purpose. This study focuses on the synthesis and characterization of Sm-doped KCl nanophosphors to develop a novel accession to investigate the highly sensitive trivalent Sm-doped KCl phosphor. Herein, we were able to overcome the aggregation phenomena and we showed that Sm-doped KCl with 0.45 mol% of Sm, which is the optimised dopant concentration, exhibits the high-intensity luminescence performance under blue light stimulation for the gamma doses in the range from 100 mGy to 1000 Gy. This sensitivity is attributed to the uniform nanospheres encapsulated in KCl along with the predominant existence of a trivalent (Sm3+) state, where these conditions can introduce additional defects centres. The presence of these additional defect centres was confirmed by photoluminescence studies, plausibly supporting the charge transfer due to the optical energy between these states, leading to high sensitivity. To establish KCl:Sm as a good OSL dosimetric materials (DM), we investigated fading, reusability, and reproducibility and compared these with those of commercial DM compounds such as Al2O3:C and BeO. Overall, Sm-doped KCl is non-toxic, cost-effective, robust, and a promising candidate for reusable dosimetry.
1. Introduction
The optically stimulated luminescence (OSL) technique-based medical dosimetry is attracting significant attention compared to thermoluminescence (TL) technique due to the advantages such as cost-effectiveness, fast to read, and easy to handle. Optically excited materials emit a significant amount of luminescence without producing adverse effects such as complete photoionization of defects; hence, the guard detector is available for many readings without destroying the signal.1 The OSL signal originates from the recombination centres/luminescence centres existing deep in the forbidden band gap, where electrons combine with holes at neutral and charged vacancies/colour centres F and F+, respectively.2 This is an outcome of illumination on the pre-irradiated detector material, which excites the electrons from moderate defect centres to the conduction band; therefore, the whole process largely depends on the electronic structure of the material in association with electron and hole defect centres at various energy depths.3 Some of the radiation-generated holes become trapped at the recombination centres known as F+ centres (F + h+ → F+). When the phosphor is optically stimulated by blue LEDs light of 470 nm, electrons depopulate from the electron trap centres and through the conduction band recombine with holes at the F+ trap centres, resulting in radiative luminescence of 420 nm (F+ + e− → F* + hν420 nm).4In the continuous search of better OSL materials to overcome the issues such as fading, low efficiency, compromised reusability, imperfect reproducibility, high-cost, high effective atomic number, tissue in-equivalency etc., a few OSL phosphors have been reported. These include oxides, halides, silicates, ammonium salts, sulphates, and aluminates.5 These phosphors were prepared by the introduction of a foreign dopant in the host matrix with its (dopant) precise concentration, where better control of the luminescence properties was achieved by exploiting its nanoscale features, which was quite difficult due to the agglomerative nature of the dopant.6 However, these phosphors suffer from one or more drawbacks that make these less favourable for dosimetric applications. The best known and commercially available OSL materials Al2O3:C and BeO are used as personal dosimeters despite the complexities in their synthesis process.7 For example, accurate carbon doping without aggregation in alumina under a reducing atmosphere of graphite at very high temperature is a demanding condition.5,8 Other near tissue-equivalent materials such as aluminates and silicates have been found to suffer from the limitations of high fading of about 80% within a month and are highly hygroscopic in nature.9 Compared to commercial Al2O3:C, a much lower sensitivity was achieved for LiAlO2:Cu,P and MgO:Tb.10 Ammonium salts and Fluorosilicates such as NH4Br and (NH4)2SiF6 have also been reported to suffer from the higher fading of more than 80% within 10 hours. Fluorides such as NaMgF3:Ce and KMgF3:Ce,Eu despite having good OSL sensitivity of about 7–8 times than that of commercial Al2O3:C could not be adopted for personal dosimetry due to high self-dose and fading.5 Hence, there is enough scope and motivation to develop suitable personal OSL dosimetric material.
Recently, halides have emerged as potential OSL materials for two-dimensional (2D) imaging in medical diagnostics, radiation therapy, and a routine check of dosimetric parameters.11 These materials show a great storing efficiency and reusability, which are desirable properties in radiation therapy.12 BaFBrI:Eu and CsBr storage phosphor plates were designed for diagnostic radiology in the dose range of μGy–mGy. However, these materials have a high Zeff (49) and show undesirable strong photon energy dependence.13 KBr:Eu and KCl:Eu do not show any photon energy dependence and also exhibit less fading in the dark at room temperature.14 On the other hand, the low-cost halide material KCl, which is abundantly found in nature, has a lower effective atomic number than that of other storage phosphors such as BaFBr, KBr, etc., making it more suitable for radiation dosimetry.11 Moreover, the lattice of KCl (highly ionic material) is face-centred cubic and exhibits a high melting point (770 °C), which allow for its use under extreme temperature conditions. Most of the properties of KCl, such as a wide band gap (∼8.5 eV) are profoundly influenced by the coulomb interactions, which makes it suitable to generate defect centers in the forbidden band gap by introducing foreign dopant atoms. Note that Sm (lanthanide) as a dopant in insulators/inorganic compounds offer high luminescence efficiency due to narrow emission bands and insufficient absorption in ultraviolet (UV-A) regions. Lanthanide ion (especially Sm)-doped phosphors have shown important and substantial optical and chemical properties on the nanoscale level,15 associated with more than one oxidation state; for instance, Kusaba et al. reported the direct excitation of lanthanides ions via charge transfer 4f → 5d, which is responsible for inducing the photoreduction of Sm3+ to Sm2+.16 Therefore, we expected that Sm as a dopant may improve the fading in halide-based materials achieved via a high-temperature solid state synthesis method that leads to thermodynamically stable materials such as oxides, halides etc.6b For instance, in the present work we observed that KCl:Sm nanophosphor can measure the doses from 100 mGy to 750 Gy with a linear response and with the estimated minimum detectable dose ∼ 6.8 μGy due to the incorporation of trivalent Sm3+. The present investigation focused on the solid state synthesis of Sm-doped KCl nanophosphors with better OSL dosimetric properties and the systematic series of investigation indicated KCl:Sm as a new OSL dosimetric phosphor in this first report.
2. Material and methods
2.1 Material synthesis
Sm-doped nanocrystalline KCl was synthesised by a solid state reaction at a high temperature of 200 °C for 3 hours with high-quality precursors KCl (M/S Merck, AR grade, 99.95% pure) and SmCl2·6H2O (M/S Alfa Aesar, 99.5% pure).17 During the synthesis, KCl was mixed with various concentrations of dopant precursor Sm such as 0.15, 0.25, 0.45, and 0.50 mol% to investigate the role of the Sm concentration for OSL applications. A finely ground homogenous mixture of prepared powder was subjected to a thermal treatment at 353–363 K for 3 hours to obtain fine nanophosphor. In addition, the mixture was then annealed (thermally) in a muffle furnace at various temperatures for 2 hours (from 950 to 1050 K) at the heating rate of 15 °C per minute. In situ cooling of the mixture up to 573 K was achieved by keeping it in the furnace for about 20 minutes after switching off the furnace as per the suggestion prescribed by other workers.18 After this, the powder was taken out from the furnace and was kept on an alumina plate at room temperature. The powder and pellet form of the same mixture was used for further studies.2.2 Characterization
High-resolution transmission electron microscopy (HRTEM) was performed on the newly synthesised KCl:Sm using TECNAI G2 HR-TEM, 200 kV, FEI Company, Holland. To examine the elemental composition and oxidation states of the prepared phosphor, X-ray photoelectron spectroscopy (XPS) was performed using an Omicron Nanotechnology, Oxford Instruments, Mistral USC at the ultra-high vacuum of 5 × 10⁻¹⁰ bar. A monochromatized excitation source with X-ray photon energy (Al Kα: 1486.7 eV) was used with an analyser pass energy of 50 eV at the high-resolution scan (HR) at 20 eV. Photoluminescence (PL) measurements were carried in the wavelength range of 200–950 nm (for both excitation and emission, separate monochromator) using a xenon flash lamp. The light signal was detected by a photon counting system with a red sensitive photomultiplier tube with the wavelength accuracy of ±0.1 nm at 200–950 nm. All spectra were obtained with the limiting resolution of less than 1.5 nm using a solid state fluorescence spectrometer. X-ray diffractometer (XRD, D8 advance, Bruker, Germany) was employed with the monochromatic Cu-Kα radiation at the scan rate of 1.0 s per step at room temperature for the range of 2θ = 20–80° with a step size of 0.01°.Continuous-wave optically stimulated luminescence (CW-OSL) decay curves were obtained using a RISO TL/OSL reader (model TL/OSL-DA-20 from M/S DTU Denmark) at room temperature. The RISO reader was armed with blue LEDs, green LEDs, and IR LEDs (NICHIA type NSPB-500AS) for stimulation; blue LEDs (for detail study) with stimulation at the wavelength of 470 nm (FWHM = 20 nm) and a power output of ∼4.8 cd at 20 mA were used. In this equipment, blue LEDs were arranged in 4 clusters with 7 individuals LEDs each, which deliver a total power of 80 mW cm−2 at the sample position. To achieve the best detection of OSL signal, a combination of filters such as green long pass filter (GG-420 with 3 mm thickness) in front of blue LED cluster and UV transmitting broadband (Hoya U-340) detection filter were used.19 Low and high dose irradiation of the OSL phosphor was carried out using a RISO in situ beta irradiation source (90Sr/90Y) at the fixed dose rate of 3 mGy s−1 and an external gamma source (137Cs) at the dose rate of 11.7 cGy s−1. The OSL decay curves of an 8 mg luminescence phosphor were obtained just after irradiation to avoid the fading issue.
3. Results and discussions
To completely understand the present proposed material KCl:Sm, synthesised by the high-temperature solid-state synthesis method, as an OSL dosimetry material, we divided the present section into two parts: (1) structural and morphological characterization and (2) OSL measurement, followed by discussion.3.1 Structural characterization
The XRD patterns of KCl (pristine) and KCl:Sm shown in Fig. 1 evidence that these compounds are crystalline in nature with a face-centred cubic KCl structure and exhibit peaks at 2θ = 28.34°, 40.5°, 50.18°, 58.6°, 66.36°, and 73.72° that were indexed to (200), (220), (222), (400), (420), and (422), respectively.20 All peaks in KCl:Sm (0.45 mol%) are similar to those of the pristine material, indicating a similar structure to that of KCl. While the intensities of peaks (200) and (400) were reduced, the peaks at (220), (222), (420), and (422) showed an increase in intensities with Sm doping, implying the improvement in crystallinity in one direction (220) at the cost of the other (200). A close inspection of the data revealed a small shift of (∼2θ = ±0.6) in all the peak positions of KCl:Sm with respect to those of pristine KCl, implying that the generation of stress in KCl:Sm may be due to the presence of Sm in the KCl matrix. In this study, Sm doping at low concentrations in KCl did not alter the crystallinity [data not shown]. Moreover, the average grain size corresponding to the (200) peak was estimated, which was approximately 20–60 nm, using the Debye–Scherrer formula:
D = 0.9λ/β![[thin space (1/6-em)]](https://www.rsc.org/images/entities/char_2009.gif) cosθ cosθ
| (1) |
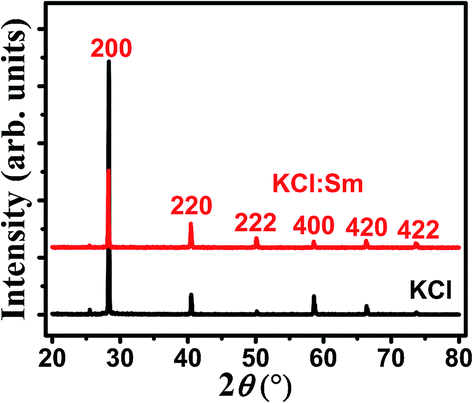 | ||
| Fig. 1 X-ray diffraction patterns of pristine KCl & (0.45 mol%) samarium-doped KCl. | ||
TEM images along with selective-area diffraction (SAD) pattern as a function of the dopant concentration before and after irradiation are shown in Fig. 2. The average particle size was found in the range of 90–190 nm for pristine KCl [Fig. 2(a)], KCl:Sm (0.15 mol%) [Fig. 2(b)], and KCl:Sm (0.25 mol%) [image not shown]. Further increase in the dopant concentration to 0.45 mol% resulted in an average isolated particle size of 20–60 nm with a variation in particle shape (spherical and cubic), as shown in Fig. 2(c). A further slight increment in the dopant concentration (e.g. 0.50 mol%, Fig. 2(d)) resulted in a connecting and irregular particles with an average particle size of approx. 80–100 nm. Thus, KCl:Sm (0.45 mol%) shows better isolated and sub 100 nm particles of KCl:Sm than that at other Sm concentration, which is considered as an optimum system for nano-based applications. This direct observation of the particle size was found to be consistent with the XRD data, confirming the nanoparticle grain size of KCl:Sm. Moreover, the presence of Sm in the KCl matrix was confirmed by EDS analysis [data not shown herein].
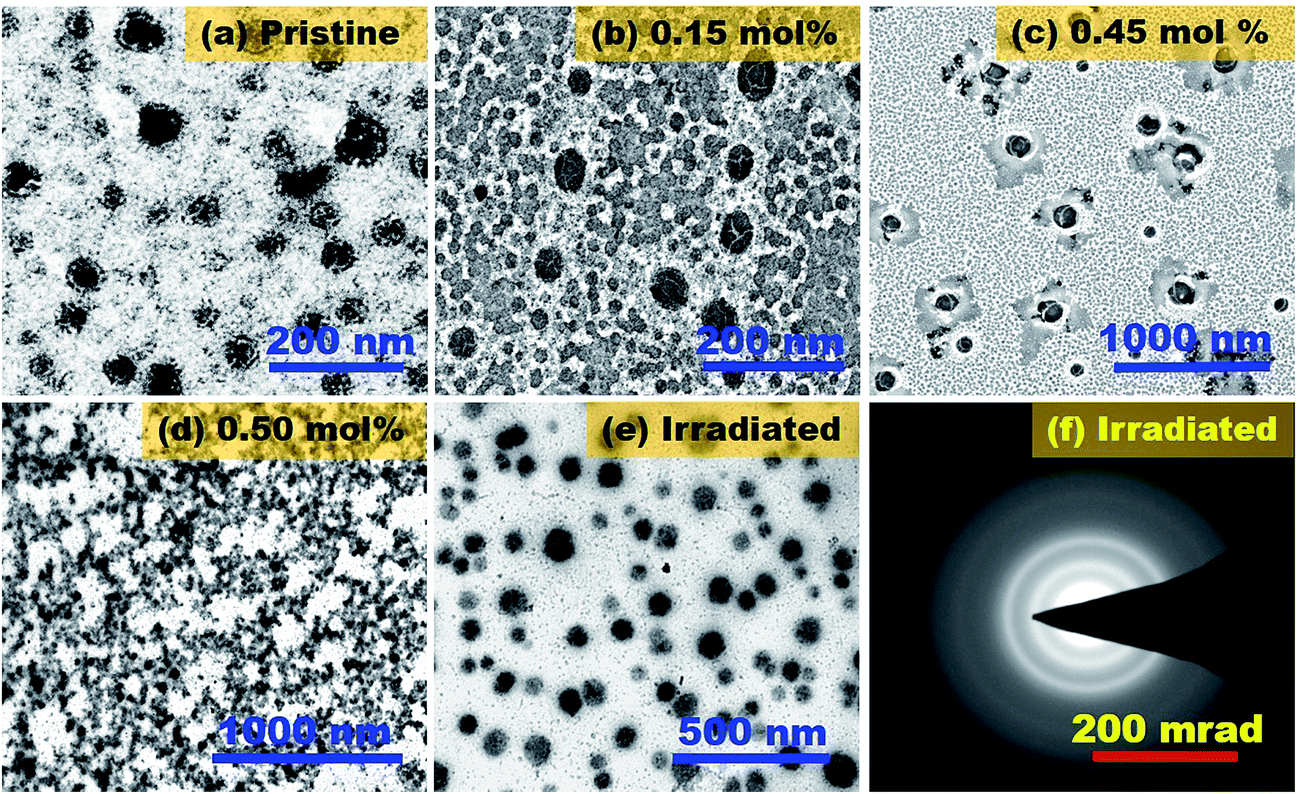 | ||
| Fig. 2 TEM image of KCl powder (a) pristine KCl, (b) KCl with 0.15 mol% of Sm, (c) 0.45 mol% of Sm, (d) 0.50 mol% of Sm, (e) optimized Sm-doped KCl (0.45 mol%) after irradiation with 500 Gy of gamma photons, and (f) SAD pattern of (e). | ||
Fig. 3(a) shows the photoluminescence (PL) excitation spectra of pure KCl and KCl:Sm (0.45 mol%) in the UV-vis region at room temperature. The PL intensities of KCl and KCl:Sm, excited at the wavelength of 200–320 nm, were found in the comparable range. After the inclusion of Sm ion in KCl, a peak at 265 nm was observed for pure KCl, which was absent for KCl:Sm; however, a narrow peak at 257.2 nm and a broad peak in the range of 267–280 nm was observed for KCl:Sm. This phenomenon may be associated with the direct charge transfer (bound exciton), which indicates the presence of Sm3+ that is induced due to the photoreduction of Sm2+ to Sm3+.16,21 Size dispersion in KCl:Sm may lead to broadening of PL peak and being able to modify optical properties of luminescent centres, help to obtain higher PL intensities. Whereas, the observed red shift in the peak position (emergence of a new peak at 257.2 nm) indicates the nano aspect, which is in well accordance with the TEM results.22
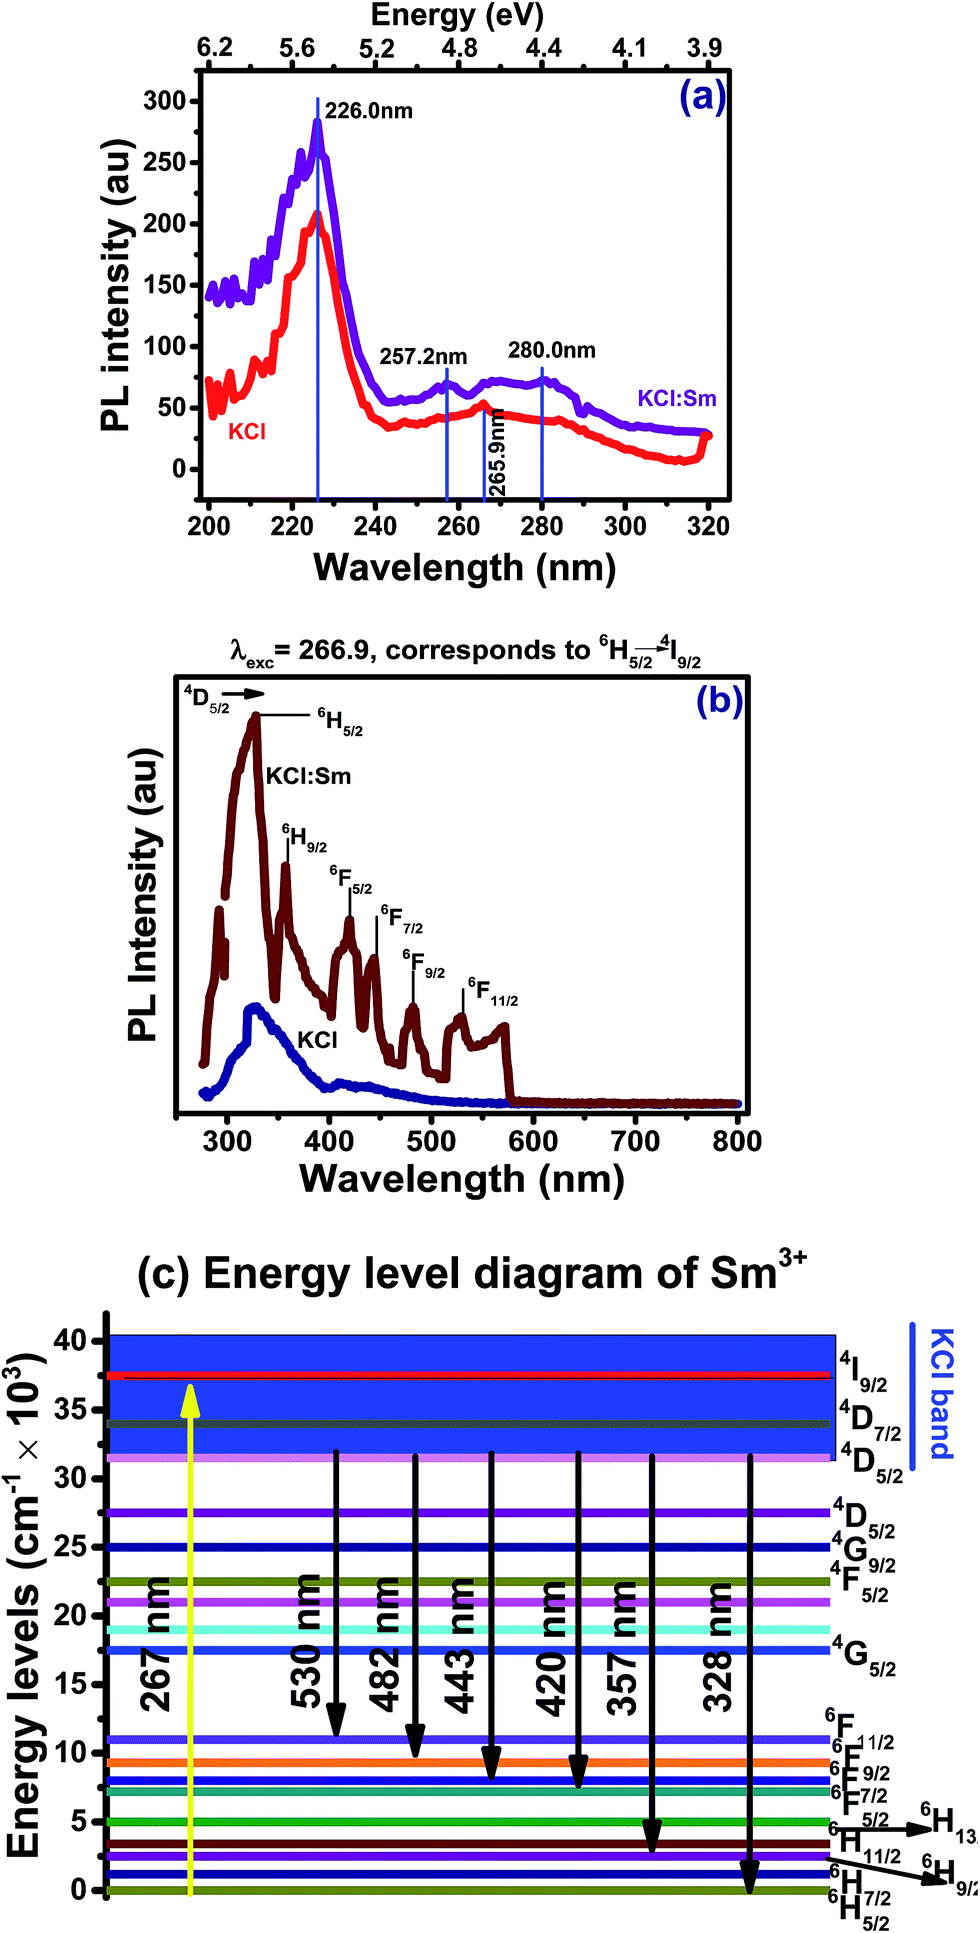 | ||
| Fig. 3 PL (a) excitation and (b) emission spectra of KCl & KCl:Sm (optimised dopant conc. of 0.45 mol%) and (c) schematic energy level diagram of Sm3+ in the KCl host matrix. | ||
The PL emission spectrum of KCl (used in our study and shown in Fig. 3(b)) exhibits a small peak at 329 nm instead at ∼140 nm for pure KCl and it can be associated with the impurities already present in the used KCl.23 After incorporating Sm in the KCl matrix, the resulting material KCl:Sm shows many other peaks at various positions in their emission spectra apart from the peak at 328 nm. The PL emission spectrum of KCl:Sm after excitation at the wavelength of 266 nm (corresponding to 6H5/2 → 4I9/2 transition) shows a series of emission peaks at the wavelength of 295–580 nm. All these emission peaks resulting from the transitions of an electron from the energy level 4D5/2 to various ground levels, such as 6H5/2, 6H7/2, 6H9/2, 6F5/2, 6F7/2, 6F9/2, and 6F11/2, were expected.24 At first instance, it appeared that the Sm-doped KCl has created some more active defects at various positions inside the band gap of KCl, which may work as trap centres for free hole/electron. This has been evidenced in ref. 25, where Sm deeply diffuses into the host lattice of KCl and causes significant changes in the band edge of the PL measurements. Based on the PL experimental data and available theoretical studies,24,26 a proposed model of the energy band diagram for KCl:Sm is schematically summarised in Fig. 3(c), where the above mentioned various transitions are shown in the energy level diagram.
For better understanding of our KCl:Sm surface elemental analysis, we employed XPS where the survey scan of KCl:Sm shows the presence of peaks in XPS spectrum that were found to be associated with Sm-3d, Cl-2p [2p1/2-at 198.7 and 2p3/2-at 198.9 eV], Cl-1s [at 284.6 eV], C-1s, O-1s, and K-2s [at 377.2 eV], as shown in Fig. 4(a). With the help of a deconvolution process, we examined the effects of the various elemental concentrations, as shown in Fig. 4(b) where the Sm-3d peak was deconvoluted. Deconvolution of the Sm-3d spectrum was complex due to the presence of mixed oxidation states Sm3+ and Sm2+ as well as due to the multiple 3d-splitting on the nanoscale. The spin–orbit doublet Sm3+ 3d5/2,3/2 with the binding energy (BE) of 1083.7 and 1108.3 eV and Sm2+ 3d5/2,3/2 with the BE of 1081.1 and 1105.2 eV can be clearly observed from the spectra and reveal the presence of both oxidation states of Sm.27 Moreover, in the deconvolution process, we found additional peaks at 1074.8 eV for Sm2+ and other broader peak at 1110.5 eV in the Sm 3d XPS spectra, which can be assigned to the Sm Auger peak,28 which generally appears in the presence of metal oxide. In our study, we expected two types of metal bondings: (1) single metal bonding (Sm–O–Sm) and (2) mixed metal bonding (Sm–O–K), where single metal bonding allow multiple oxidation states and mixed metal oxides prefer the formation of Sm3+.29 This different types of metal bondings were further confirmed in the O-1s spectrum of KCl:Sm nanophosphor, as shown in Fig. 5(c), where the peaks at 530.5 eV and 526.7 eV (after de-convolution) were found to be associated with Sm–O–K bond and Sm–O–Sm bond, respectively.30 The asymmetry in the O-1s peak in Fig. 4(c) reveals O2− ions association with all the compositional ions K+, Cl−, Sm2+, and Sm3+, which could be advantageous to the energy transfer mechanism.30
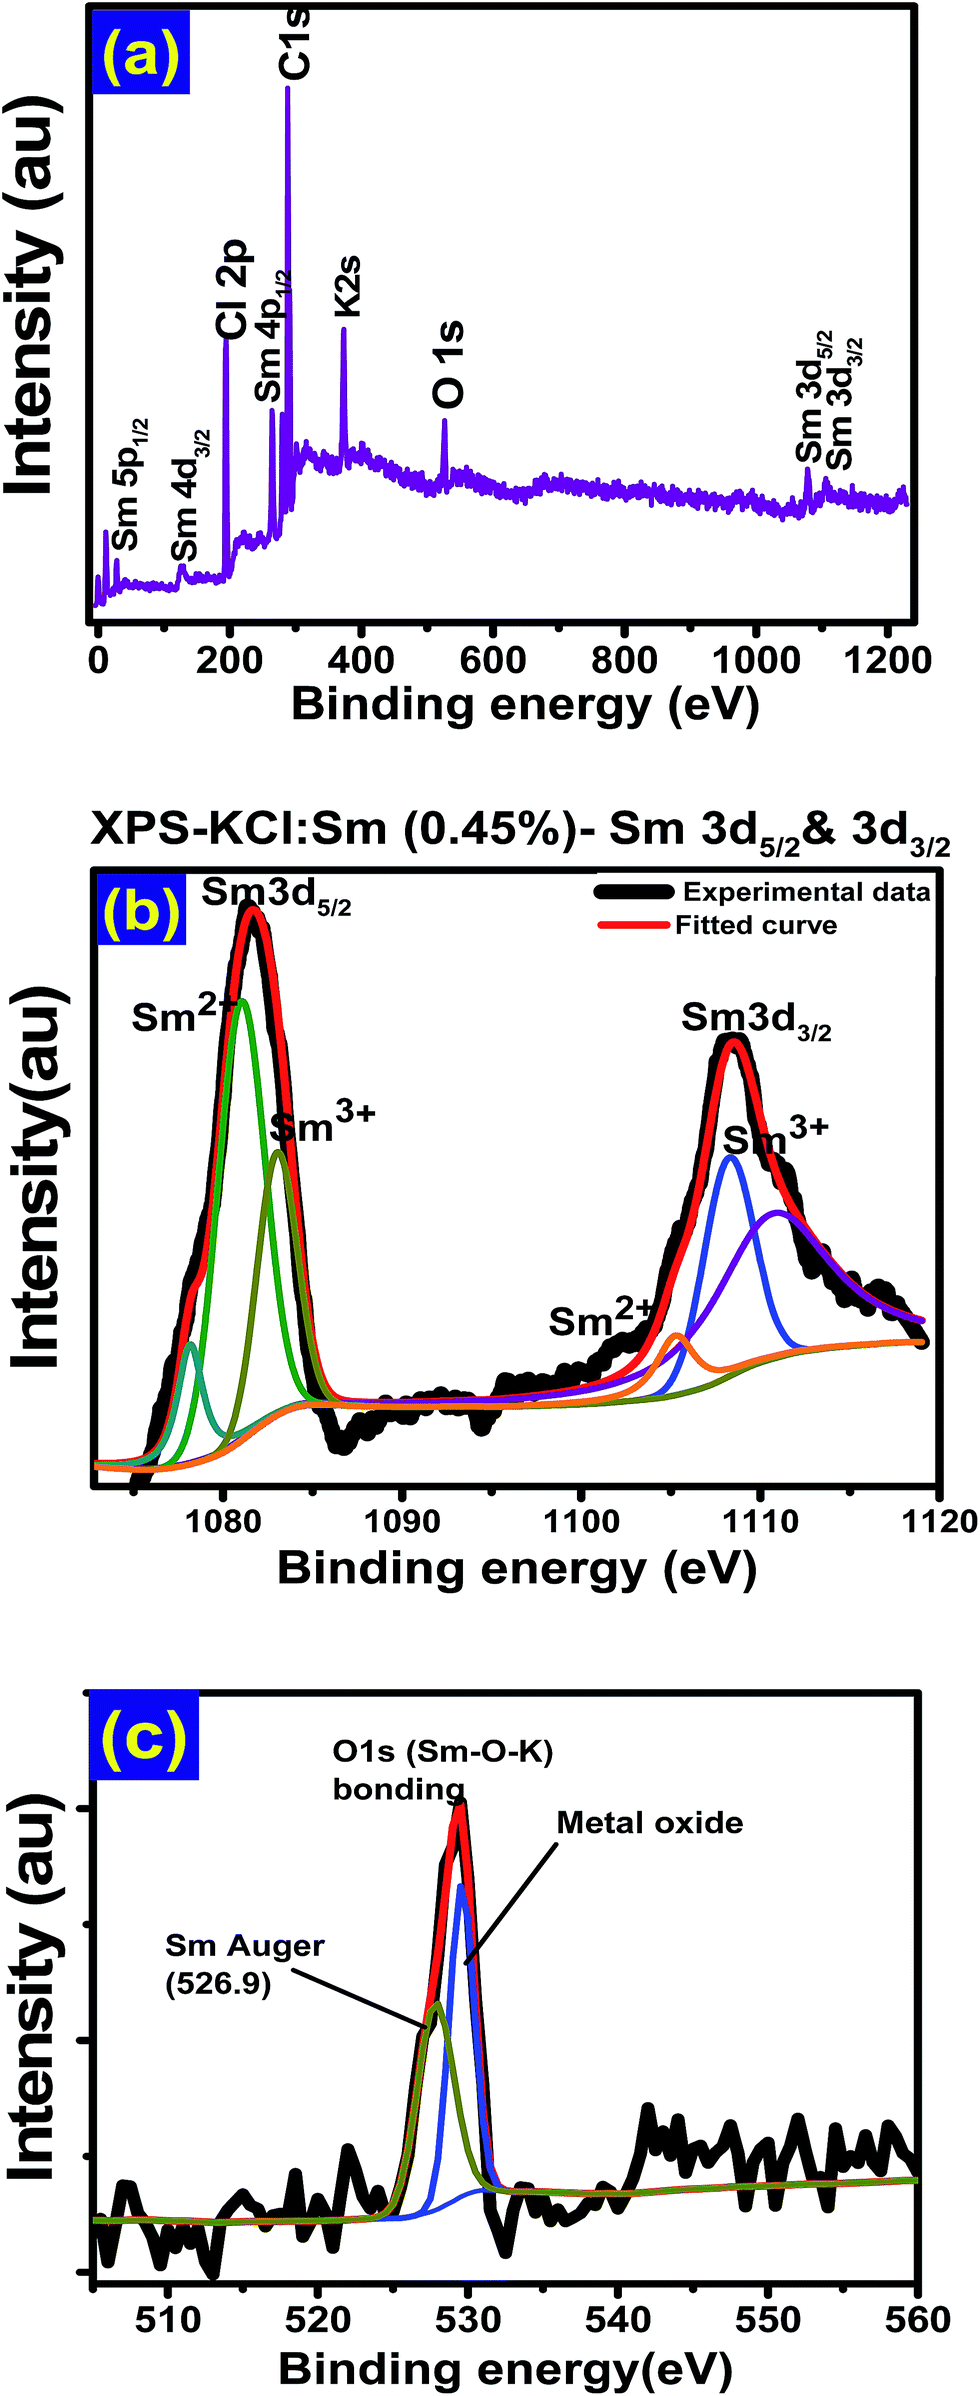 | ||
| Fig. 4 XPS spectra of KCl:Sm (0.45 mol%) (a) survey scan, (b) deconvolution-to 3d3/2 and 3d5/2 and (c) to O-1s of KCl:Sm. | ||
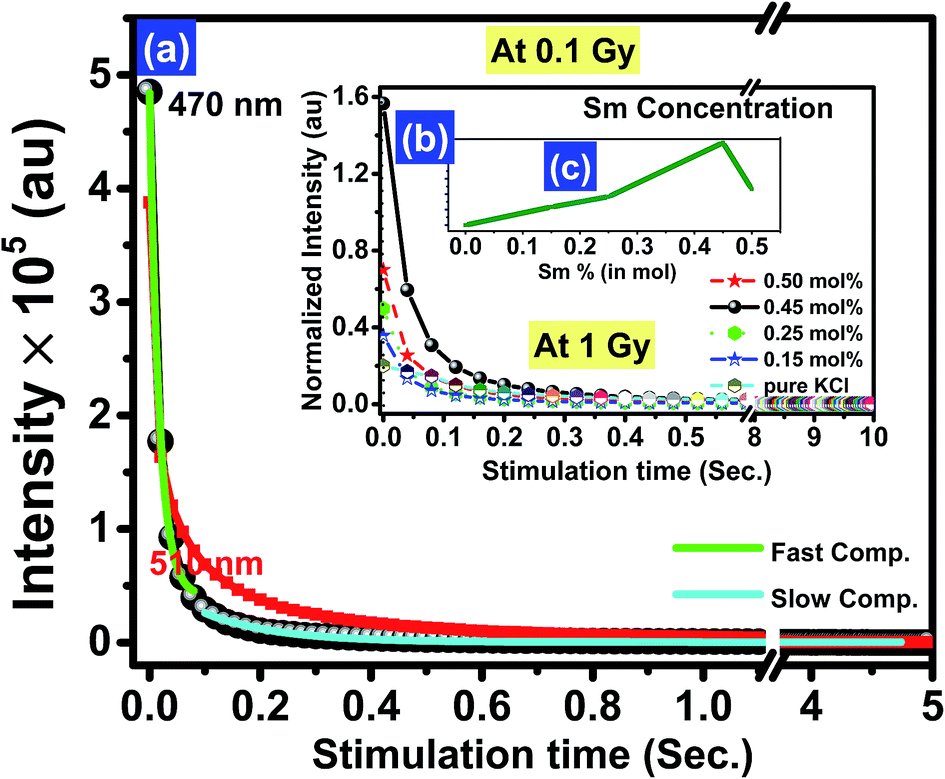 | ||
| Fig. 5 Parametric curves: CW-OSL decay curves of KCl:Sm after irradiation from Cs137-sourced gamma ray for 0.1 Gy of 0.45 mol% Sm dopant at two different OSL simulation wavelength (1) blue light: 470 nm (black sphere) and (2) green light: 510 nm (red square), (b) different dopant concentration of Sm (0.15, 0.25, 0.45, & 0.50 mol%) along with pristine KCl at blue OSL stimulation light for 1 Gy, and (c) plot of the obtained maximum intensity from plot (b) as a function of Sm concentration. Further OSL curve of KCl:Sm (0.45%) at 0.1 Gy dose has been fitted with exponentially decay in two component (1) fast and (2) slow shown in (a) corresponding to blue light stimulation. | ||
3.2 OSL measurements
The crystal structure, luminescent, and dosimetric properties of the material depend on the preparation methods. Fig. 5 shows the parametric curves of KCl and KCl:Sm (0.45 mol%) under various experimental parameters of the OSL system. Two stimulation sources of OSL, namely blue and green LEDs, for the fixed dose 0.1 Gy were used. Fig. 5(a) shows that the maximum intensity of the CW-OSL decay curves was obtained for a blue stimulation source, which is approximately two times higher than that of green light under the same experimental conditions. Another advantage of using blue light for stimulation lies in its large photoionization cross-section,31 which is reflected in the rapid decay of the CW-OSL signal. Therefore, we chose blue light for further OSL studies. Fig. 5(b) shows the CW-OSL decay curve as a function of Sm concentration at the fixed dose of 1 Gy of gamma rays. The maximum intensity of the KCl:Sm nanophosphor was found at 0.45 mol% at the optimal annealing temperature of 710 °C. Moreover, the intensity increased with the increasing Sm concentration from 0.15 to 0.45 mol% followed by a decrease at higher dopant concentrations (0.50 mol%) [Fig. 5(c)]. This behaviour could be due to either thermal quenching or conglomeration of particles at a higher concentration of Sm, resulting in saturation of luminescence/recombination centres.3a We found that its CW-OSL signal was very intense at 9 × 10⁶ compared to that of other lanthanides such as KCl:Dy and KCl:Tb (both at 0.45 mol%) synthesised in our lab, which showed a CW-OSL intensity of 2.85 × 10⁵ and 2.5 × 10⁵, respectively. Thus, the observed behaviour of the OSL intensity as a function of Sm concentration reveals the optimised concentration of 0.45 mol%. In connection with the material structural properties, this optimised percentage of Sm can be associated with the particle size of KCl systems, which have been observed as well-isolated nanoparticle of KCl:Sm [Fig. 2(c)]. In the same line, the reduction in the OSL intensity for KCl:Sm (0.50 mol%) could be associated with the observed agglomeration of particles found at 0.50 mol% Sm in Fig. 2(d).6a Therefore, this study excludes the possibility of thermal quenching, which is also capable of bringing a reduction in the OSL intensity. Further, TEM studies suggested that the percentage of Sm in KCl could affect the particle size of KCl on the nanoscale. To investigate the irradiation-induced change on the shape and size of the particle, a 500 Gy gamma photon-induced KCl:Sm (0.45 mol%) was investigated by TEM, as shown in Fig. 2(e). From Fig. 2(e), we found that the radiation brings a drastic change in the particle size but maintains the shape (spherical) and homogeneity. It shows a large density of particle size in the range of 20–50 nm (sub 50 nm) homogeneously distributed between the other particle size range 90–180 nm. Thus, irradiation was found to be an assistive process to grow particles at one site at the cost of another site. Irradiation-induced annealing is capable of changing the crystalline nature and may lead to a change in sensitivity, as shown in Fig. 2(f) [a SAD pattern of Fig. 2(e)]. Various ring patterns in the SAD image (as observed in Fig. 1) shows the polycrystalline nature of gamma-irradiated samples and further reveals that the polycrystalline nature of non-irradiated KCl:Sm remains unchanged at high doses. Thus, the divulge homogeneous, regular, and sub-50 nm polycrystalline particles were found to bring significant improvement in the photoluminescence properties of the investigated phosphor.32To calculate the decay rate, the CW-OSL decay curve was fitted with two components (minimum) for the best fit, where the first component describes the steeper part while the second component explains the less steep part of the observed CW-OSL decay curve. These are also known as a fast and slow component. This decay rate was obtained from Fig. 5 by fitting eqn (2) and (3). The CW-OSL decay curve stimulated by the blue LED light can be shown from the following equations:
| IOSL(blue) = A1e−x/τ1 + I01 | (2) |
936.43923, A1 = 443269.09834, τ1 = 0.01744, [for the fast component]| IOSL(blue) = A2e−x/τ2 + I02 | (3) |
482.60896, τ2 = 0.13011, [for the slow component].
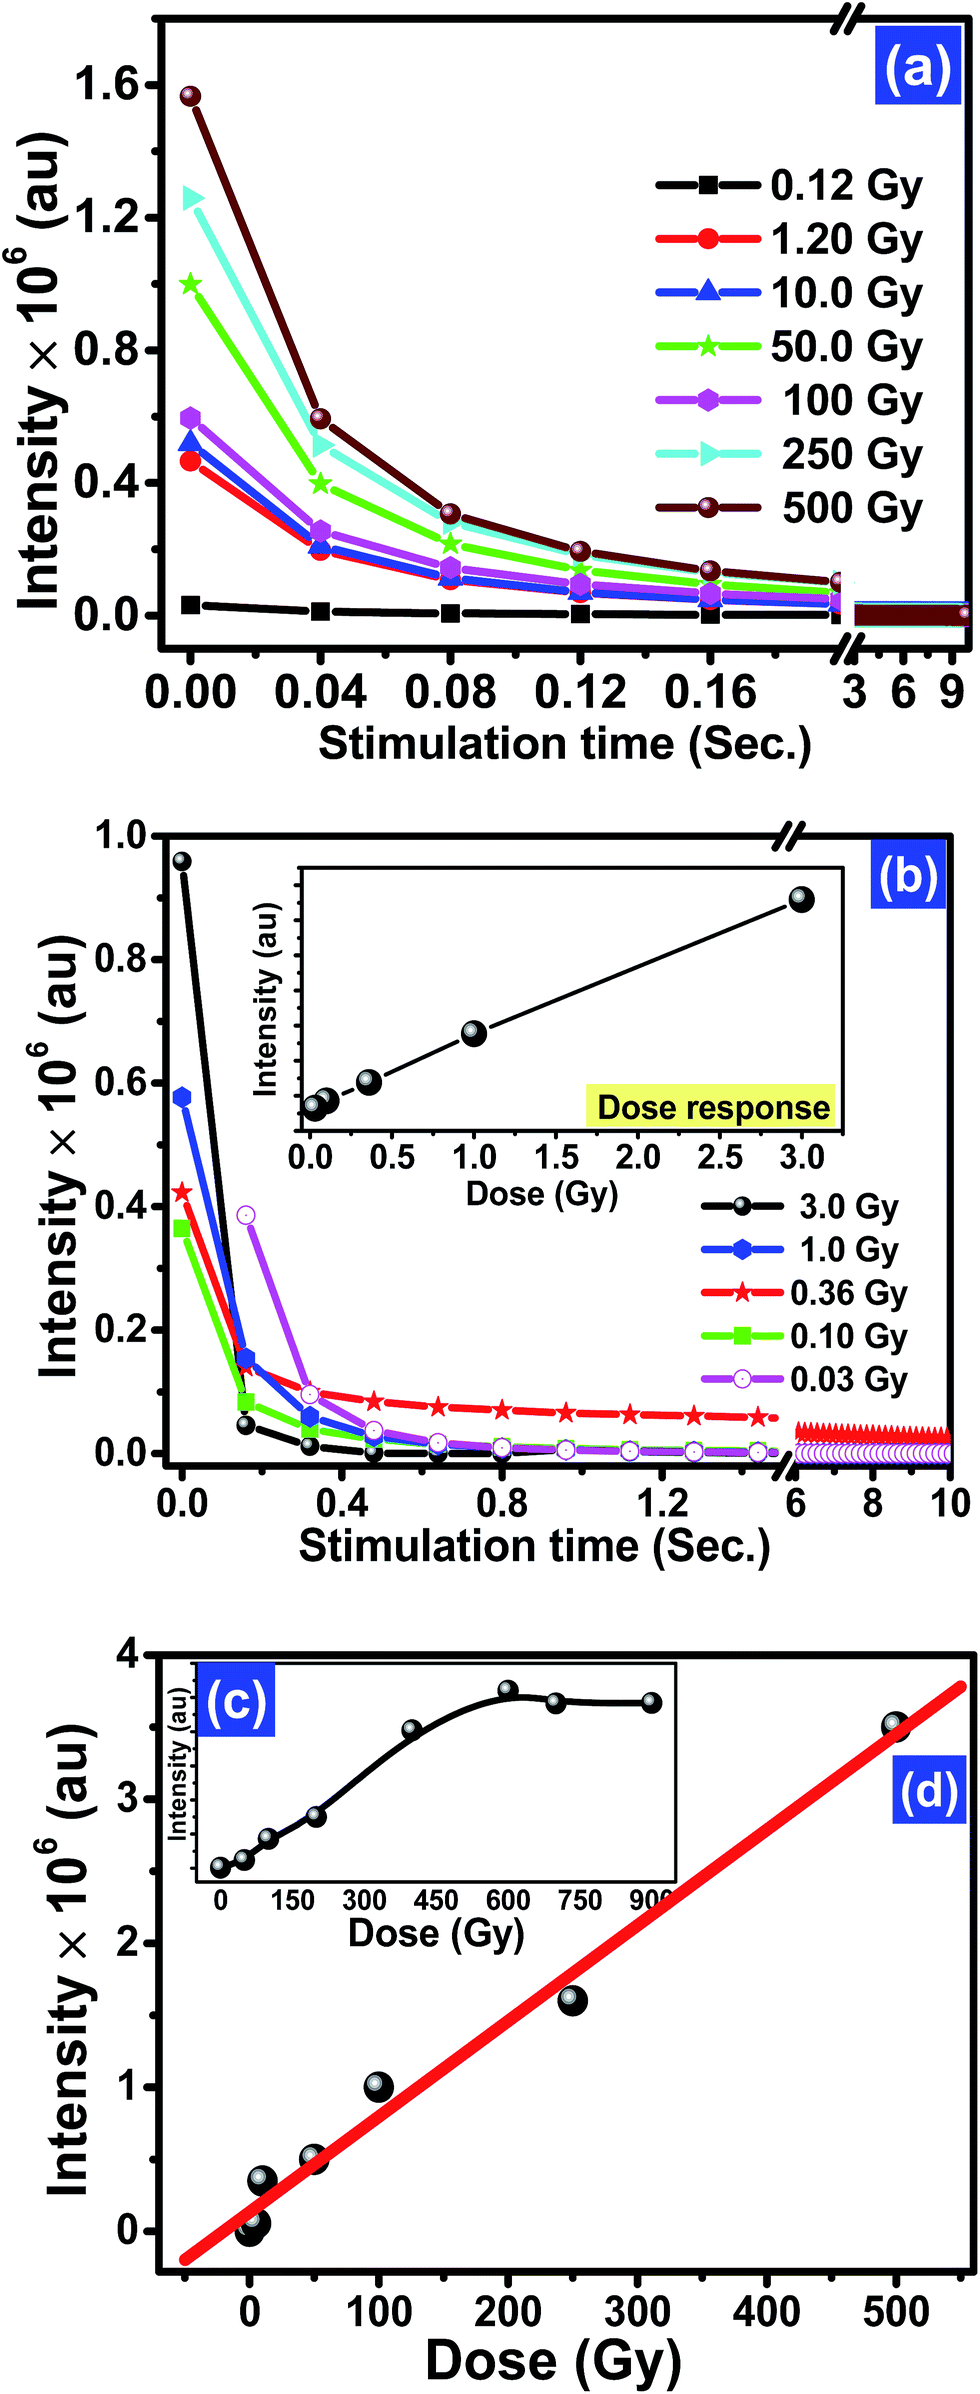
With these values of decay constants, the photoionization cross-section (σ) was calculated as follows:33
 | (4) |
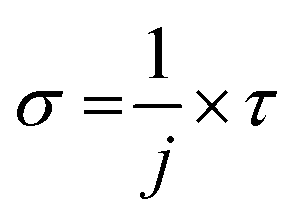
To investigate the dose response of the optimised phosphor KCl:Sm (0.45 mol%), the samples were irradiated with various doses of gamma photons (137Cs source in the dose ranges from 100 mGy to 1 kGy) and beta source (90Sr/90Y in the doses from 3 mGy to 5 Gy). The corresponding CW-OSL curves are shown in Fig. 6(a) and (b) for gamma and beta irradiation, respectively. The shape and decay rate of gamma and beta-irradiated OSL curves are slightly different and probably show their different ways of interaction [Fig. 6(a) and (b)]. The OSL intensity increased with the increasing gamma irradiation in the dose range from 10 cGy to 500 Gy and then decreased with dose beyond 500 Gy [Fig. 6(c)]. The observed saturation in intensity at high doses depicted in Fig. 6(c) could be due to the saturation of luminescence or reduction in the recombination centres.35 In this analysis, a linear fit in the dose range up to 500 Gy revealed a linear correlation coefficient (r = 0.978). Fig. 6(d) indicates that the KCl:Sm nanophosphor may be a good sensitive material for radiation dosimetry.13 The dose response for beta irradiation also yielded a linear correlation coefficient r = 0.91 for doses up to 3 Gy [Fig. 6(b)]. The OSL signal was found to be linear in the dose range of 100 mGy to 750 Gy, and after this range, the signal started to saturate. The minimum detectable dose (MDD) of the prepared phosphor was estimated to be ∼6.8 μGy using the standard method.36
 | ||
| Fig. 6 CW-OSL decay curves of KCl:Sm (0.45 mol%) irradiated from (a) Cs137-sourced gamma photons at different doses, (b) 90Sr/90Yr sourced β-rays at different doses in the range of 0.03–3 Gy, [inset shows the dose response of (b)], (c) dose response of (a) in the dose range of 0.12–1000 Gy, and (d) zoomed linear part of (c). | ||
A comparison of the experimental OSL phosphor KCl:Sm with the commercially available OSL material α-Al2O3:C and BeO was carried out, as shown in Fig. 7. The intensity of KCl:Sm is around one-third of that of Al2O3:C and BeO at the fixed dose of 1 Gy of 137Cs gamma photons. Although fading is one of the important characteristics of dosimetry that can be affected by the dopant concentration, the type of dopant, and energy of ionising radiation,5 we depicted fading of KCl:Sm nanophosphor at one test dose of 0.5 Gy of gamma photons (Fig. 8). For the same fading issue, the samples were stored in the dark at room temperature after irradiation for a period of 50 days and the CW-OSL decay response curve was obtained at a certain gap of time (in days), as shown in Fig. 8(b). For clarity, only three curves are shown: just after the irradiation, 5 days after irradiation, and 12 days after irradiation. A nominal reduction of 7–8% in normalised intensity was found for the first 12 days after irradiation [Fig. 8(a)], which may be due to the presence of shallow traps. A 20% decrease in the intensity was observed in 50 days after irradiation [Fig. 8(a)]. The nominal fading of 7–8% in 12 days in our OSL phosphor KCl:Sm indicates that it may be used in patient radiation dosimetry in radiotherapy and radiology. Reusability is the important property of a dosimetric material that indicates its efficiency over repeated use (irradiation–reading–bleaching cycle). The CW-OSL decay curve of gamma-irradiated KCl:Sm nanophosphors with the test dose of 0.5 Gy was obtained followed by in situ bleaching for 20 minutes to quench all electrons in the defect centres. This was again irradiated with the same dose of 0.5 Gy and its CW-OSL intensity was obtained. This was repeated and this read-out cycle was performed at least 7–8 times at the same sample with keeping the test dose at 0.5 Gy. Fig. 9(a) shows the variation of about 6–7% in the signal over repeated use. This study demonstrates that the KCl:Sm nanophosphor also possesses good reusability. For practical applications, dosimetric materials should also have the property of reproducibility. KCl:Sm was synthesised three times terming them batch each time. Eight-nine aliquots of KCl:Sm powder (8 mg) from all three batches were exposed to the test dose of 0.5 Gy. The CW-OSL signals were obtained for 10 seconds. The OSL reading of irradiated KCl:Sm nanophosphor was found to be reproducible [Fig. 9(b)] with the observed variation of 4–5% across the batches.
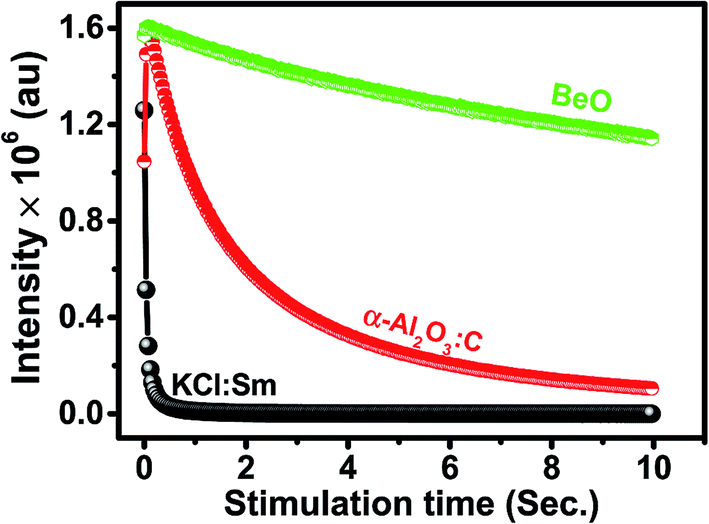 | ||
| Fig. 7 CW-OSL comparison curves of KCl:Sm with commercially available Al2O3:C (Landauer Inc., USA) and BeO (Thermalox® 995, Materiaon Inc., USA) irradiated at 1 Gy of gamma photons (137Cs). | ||
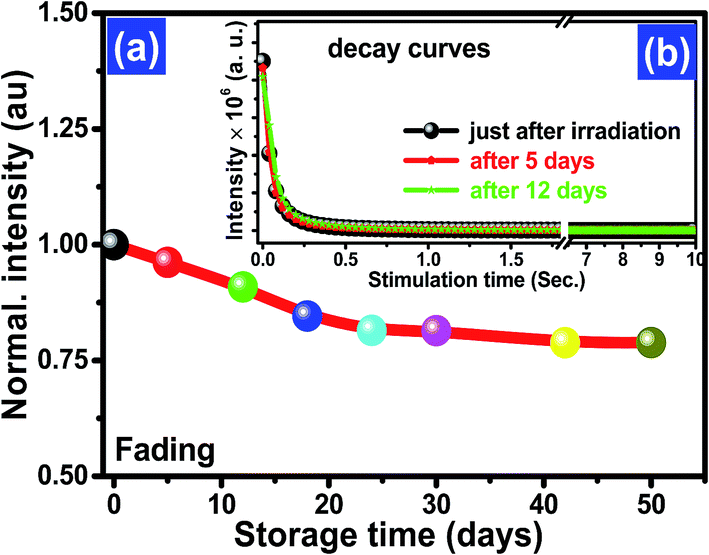 | ||
| Fig. 8 The fading curve of KCl:Sm (0.45 mol%) (a) up to test 50 days and (b) CW-OSL curve as a function of storage days up to 12 days [higher days not shown to maintain clarity]. | ||
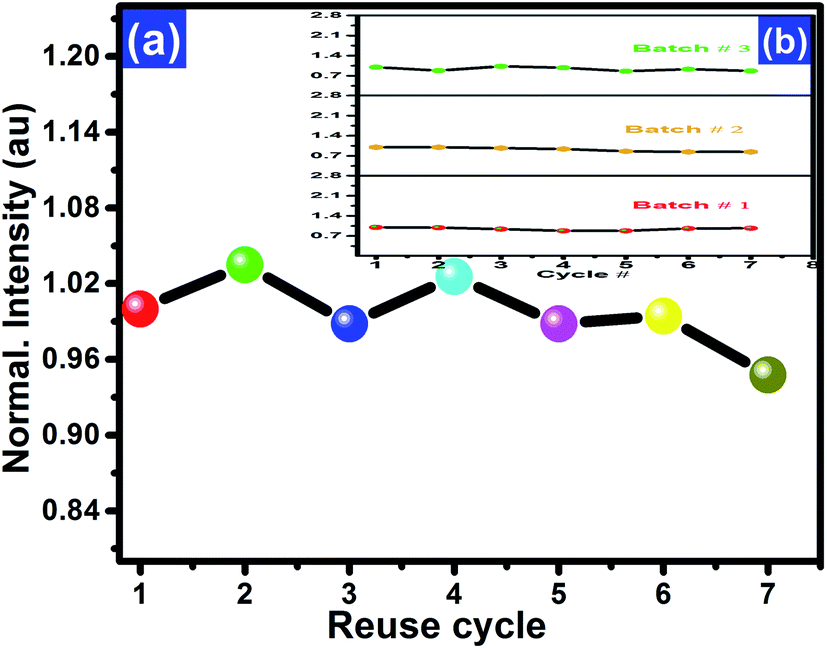 | ||
| Fig. 9 (a) Reusability of KCl:Sm (0.45 mol%) that is irradiated with 0.5 Gy from gamma-sourced 137Cs and (b) reproducibility with different batches of KCl:Sm (0.45 mol%) under the test dose of 0.5 Gy. | ||
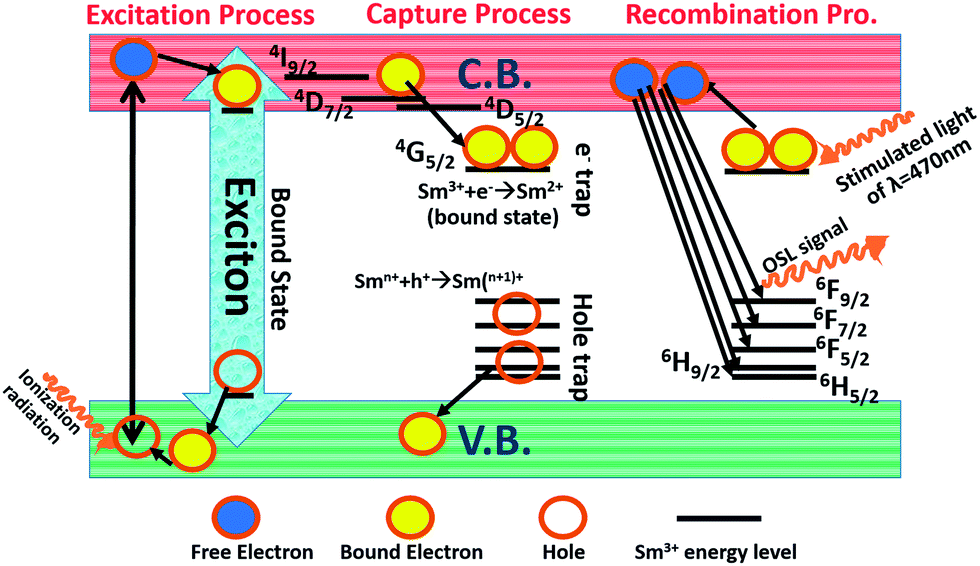
Then, in the light of our both performed experimental analysis (1) structural and (2) OSL, we presented a model (depicted in Fig. 10) to understand the possible mechanism of the OSL properties of KCl:Sm. We understood the full OSL mechanism in three parts: part (1) excitation, (2) capture process, and (3) recombination process, which comes in sequences one after another. The unirradiated sample whose absorbed dose measurement is our aim, is brought subjected to excitation process by allowing energetic irradiation. As a result, photoionization takes place, in which the valence band (VB) electron of KCl moves into the conduction band (CB) of KCl, and generates the delocalized/free charge carriers (e− and h+) in the VB and CB, respectively. Some of the energy levels of Sm3+ may exist within the both the bands (VB and CB) of KCl. The energy levels that lie within the VB release an electron to the VB of KCl and behave like a hole defect centre. At the same time, the Sm3+ energy levels inside the CB can capture the free e− from the CB and make a bound state of e− and h+ within Sm3+ energy levels, which is known as an exciton. After this excitation process, the capture process starts where the energy level at nearest below the CB receives some e− via a non-radiative process, which is known as electron trapping and occur through the following process:37
| Sm3+ + e− (free electron capturing) → Sm2+ (bound state). | (5) |
 | ||
| Fig. 10 A simple model for OSL mechanism: a schematic of nanophosphor KCl:Sm OSL processes. | ||
The Sm3+ energy levels at nearest above the VB release an e− to VB, which work as hole centres through a process known as hole trapping that occurs through the following process:38
| Smn + h+ → Smn+1. | (6) |
This capturing process contributes to obtaining a stronger OSL signal, where the capturing process increases with the introduction of a larger number of energy levels near both the bands. The same was achieved in this case by doping Sm ions into the nano KCl matrix. This has been confirmed in our PL studies. In the last process, namely recombination process, this nanophosphor was brought to optical stimulation, where light of wavelength 470 nm, also known as stimulation light source, released the trapped electron from the e− trap centres to free the e− in the CB. These free e− will undergo a transition from the CB to various Sm3+ hole trap centres and release the OSL signal through the following process:39
| (Smn+ + h+) + e− → Smn+ + hν (light emission at 420 nm) | (7) |
This emission spectrum of KCl:Sm shows the transition in the range from 330 to 580 nm, mainly due to the Sm3+ oxidation state.
4. Conclusion
In this synthesis process, we successfully established an easy process through which we overcame the barrier of dopant agglomeration in the host lattice using a certain dopant concentration (0.45 mol%) and we came close to developing the nanophosphor materials for dosimetric applications. Moreover, according to our comprehensive OSL studies, properties such as dynamic linear dose response, low fading, high reproducibility, and reusability, which endorse our synthesis materials for OSL applications, show good sensitivity up to 80% compared to those of commercial OSL compounds. This first ever report [to the best of our knowledge] on KCl:Sm3+ (0.45 mol%) nanophosphor, we have found well isolated polycrystalline nanophosphor KCl:Sm in the mixed oxidation state of Sm3+. Herein, Sm3+ works as an important dopant to increase the OSL signal by introducing various energy levels within the band gap of KCl and near to VB and CB, which further improves the e− and h+ capturing process. Based on the above mentioned facts, the proposed model enlightens the OSL behaviour of KCl:Sm3+ material. Thus, overall, this study opens a new approach for 2D medical imaging and high radiation dosimetry. In future, this phosphor may be used in space dosimetry and real-time dosimetry.Acknowledgements
The research was fully supported by AIIMS (All India Institute of Medical Research) fellowship. MSG are grateful to Mr D. Sen and Mr Birendra, Health Physics Lab, IUAC New Delhi for support in the preparation of samples. Authors acknowledge the Department of Science and Technology (DST) for supporting AIIMS and IUAC with the characterizations tools HRTEM and EDS-SEM, respectively.References
- A. Viamonte, L. A. R. Da Rosa, L. A. Buckley, A. Cherpak and J. E. Cygler, Radiotherapy dosimetry using a commercial OSL system, Med. Phys., 2008, 35(4), 1261–1266 CrossRef CAS PubMed.
- M. S. Akselrod, N. A. Larsen, V. Whitley and S. W. S. McKeever, Thermal quenching of F-centre luminescence in Al2O3:C, Radiat. Prot. Dosim., 1999, 84(1–4), 39–42 CrossRef CAS.
- (a) E. G. Yukihara and S. W. S. McKeever, Optically stimulated luminescence: fundamentals and applications, John Wiley & Sons, 2011 Search PubMed; (b) J. C. Polf, A study of optically stimulated luminescence in Al2O3 fibres for the development of a real-time, fibre optic dosimetry system, PhD Thesis, Oklahoma State University, 2002.
- K.-H. Lee and J. H. Crawford Jr, Luminescence of the F centre in sapphire, Phys. Rev. B: Condens. Matter Mater. Phys., 1979, 19(6), 3217 CrossRef CAS.
- A. S. Pradhan, J. I. Lee and J. L. Kim, Recent developments of optically stimulated luminescence materials and techniques for radiation dosimetry and clinical applications, J. Med. Phys., 2008, 33(3), 85 CrossRef CAS PubMed.
- (a) B.-I. Lee, E.-s. Lee and S.-H. Byeon, Assembly of Layered Rare-Earth Hydroxide Nanosheets and SiO2 Nanoparticles to Fabricate Multifunctional Transparent Films Capable of Combinatorial Color Generation, Adv. Funct. Mater., 2012, 22(17), 3562–3569 CrossRef CAS; (b) H. He, X. Zhang and G. Li, Synthesis and properties study of new rare earth sodium borates Eu3+-doped Na3Y(BO3)2, Micro Nano Lett., 2012, 7(3), 228–231 CrossRef.
- L. C. Yong, H. Wagiran and A. K. Ismail, Thermoluminescence Performance of Carbon-doped Aluminium Oxide for Dose Measurement by Various Preparation Methods, J. Technol., 2013, 62(3), 2013 Search PubMed.
- K. P. Muthe, M. S. Kulkarni, N. S. Rawat, D. R. Mishra, B. C. Bhatt, A. Singh and S. K. Gupta, Melt processing of alumina in graphite ambient for dosimetric applications, J. Lumin., 2008, 128(3), 445–450 CrossRef CAS.
- A. Twardak, P. Bilski, B. Marczewska, J. I. Lee, J.-L. Kim, W. Gieszczyk, A. Mrozik, M. Sądel and D. Wróbel, Properties of lithium aluminate for application as an OSL dosimeter, Radiat. Phys. Chem., 2014, 104, 76–79 CrossRef CAS.
- A. Twardak, P. Bilski, B. Marczewska and W. Gieszczyk, Analysis of TL and OSL kinetics of lithium aluminate, Radiat. Meas., 2014, 71, 143–147 CrossRef CAS.
- Y. Zheng, Z. Han, J. P. Driewer, D. A. Low and H. H. Li, Theoretical and empirical investigations of KCl:Eu2+ for nearly water-equivalent radiotherapy dosimetry, Med. Phys., 2010, 37(1), 146 CrossRef CAS PubMed.
- Z. Han, J. P. Driewer, Y. Zheng, D. A. Low and H. H. Li, Quantitative megavoltage radiation therapy dosimetry using the storage phosphor KCl:Eu2+, Med. Phys., 2009, 36(8), 3748–3757 CrossRef CAS PubMed.
- H. H. Li, J. P. Driewer, Z. Han, D. A. Low, D. Yang and Z. Xiao, Two-dimensional high-spatial-resolution dosimeter using europium doped potassium chloride: a feasibility study, Phys. Med. Biol., 2014, 59(8), 1899 CrossRef CAS PubMed.
- Y. Douguchi, H. Nanto, T. Sato, A. Imai, S. Nasu, E. Kusano and A. Kinbara, Optically stimulated luminescence in Eu-doped KBr phosphor ceramics, Radiat. Prot. Dosim., 1999, 84(1–4), 143–147 CrossRef CAS.
- (a) E. Snitzer, Optical maser action of Nd3+ in a barium crown glass, Phys. Rev. Lett., 1961, 7(12), 444 CrossRef CAS; (b) J. Qiu, K. Miura, K. Nouchi, T. Suzuki, Y. Kondo, T. Mitsuyu and K. Hirao, Valence manipulation by lasers of samarium ion in micrometer-scale dimensions inside the transparent glass, Solid State Commun., 1999, 113(6), 341–344 CrossRef CAS; (c) R. Nomura, T. Matsuno and T. Endo, Samarium Iodide-Catalyzed Pinacol Coupling of Carbonyl Compounds, J. Am. Chem. Soc., 1996, 118(46), 11666–11667 CrossRef CAS.
- M. Kusaba, N. Nakashima, W. Kawamura, Y. Izawa and C. Yamanaka, The Higher yield of photoreduction from Eu3+ to Eu2+ with shorter wavelength irradiation, Chem. Phys. Lett., 1992, 197(1), 136–140 CrossRef CAS.
- H. H. Li, Z. Xiao, R. Hansel, N. Knutson and D. Yang, Performance of KCl:Eu2+ storage phosphor dosimeters for low-dose measurements, Phys. Med. Biol., 2013, 58(12), 4357 CrossRef PubMed.
- P. D. Sahare, M. Singh and P. Kumar, A new high sensitivity Na2LiPO4:Eu OSL phosphor, RSC Adv., 2015, 5(5), 3474–3481 RSC.
- Manual for the guide to RISO TL/OSL reader, DTU, Denmark, 2013 Search PubMed.
- T. N. Blanton, T. C. Huang, H. Toraya, C. R. Hubbard, S. B. Robie, D. Louër, H. E. Göbel, G. Will, R. Gilles and T. Raftery, JCPDS—International Centre for Diffraction Data round robin study of silver behenate. A possible low-angle X-ray diffraction calibration standard, Powder Diffr., 1995, 10(02), 91–95 CrossRef CAS.
- P. Bamfield and M. G. Hutchings, Chapter 4 Phenomena Involving Absorption of Light and Energy Transfer, in Chromic Phenomena: Technological Applications of Colour Chemistry (2), The Royal Society of Chemistry, 2010, pp. 366–470 Search PubMed.
- N. Saxena, P. Kumar, D. Kabiraj and D. Kanjilal, Opto-structural studies of well-dispersed silicon nanocrystals grown by atom beam sputtering, Nanoscale Res. Lett., 2012, 7(1), 547 CrossRef PubMed.
- K. Teegarden and G. Baldini, Optical absorption spectra of the alkali halides at 10 K, Phys. Rev., 1967, 155(3), 896 CrossRef CAS.
- Q. Wu, H. Li, W. Xia, X. Fu, Z. Fu, S. Zhou, S. Zhang and J. H. Jeong, Investigation of the Structure and Photoluminescence Properties of Ln3+ (Eu3+, Dy3+, Sm3+) Ion-Doped NaY(MoO4)2, J. Electrochem. Soc., 2011, 158(12), J387–J393 CrossRef CAS.
- Y. Harada and S. Hashimoto, Enhancement of band-edge photoluminescence of bulk ZnO single crystals coated with alkali halide, Phys. Rev. B: Condens. Matter Mater. Phys., 2003, 68(4), 045421 CrossRef.
- C. K. Jayasankar and P. Babu, Optical properties of Sm3+ ions in lithium borate and lithium fluoroborate glasses, J. Alloys Compd., 2000, 307(1–2), 82–95 CrossRef CAS.
- (a) J. C. Polf, A study of optically stimulated luminescence in Al2O3 fibres for the development of a real-time, fibre optic dosimetry system, 2002 Search PubMed; (b) B. V. Crist, Handbook of Monochromatic XPS spectra, XPS international, 1999 Search PubMed; (c) G. K. Hodgson, S. Impellizzeri, G. L. Hallett-Tapley and J. C. Scaiano, Photochemical synthesis and characterization of novel samarium oxide nanoparticles: toward a heterogeneous Brønsted acid catalyst, RSC Adv., 2015, 5(5), 3728–3732 RSC.
- V. Kuncser and L. Miu, Surface Reactivity and Magnetism at Metal–Semiconductor Interfaces, in Size Effects in Nanostructures: Basics and Applications, ed. V. Kuncser and L. Miu, Springer, 2014, vol. 205 Search PubMed.
- T.-D. Nguyen, D. Mrabet and T.-O. Do, Controlled self-assembly of Sm2O3 nanoparticles into nanorods: simple and large scale synthesis using bulk Sm2O3 powders, J. Phys. Chem. C, 2008, 112(39), 15226–15235 CAS.
- C. D. Wanger, W. M. Riggs, L. E. Davis, J. F. Moulder and G. E. Muilenberg, Handbook of X-ray Photoelectron Spectroscopy, Perkin-Elmer Corporation: Physical Electronics Division, Waltham, M.A., 1979 Search PubMed.
- R. A. Barve, R. R. Patil, S. V. Moharil, N. P. Gaikwad, B. C. Bhatt, R. Pradeep, D. R. Mishra and M. S. Kulkarni, Na2SiF6:Cu,P: a new OSL phosphor for the radiation dosimetric applications, Radiat. Prot. Dosim., 2015, 163(4), 439–445 CrossRef CAS PubMed.
- (a) A. Lakshmanan, Sintering of ceramics: new emerging techniques, InTech, Rijeka, 2012, p. 324 Search PubMed; (b) D. R. Baer, D. J. Gaspar, P. Nachimuthu, S. D. Techane and D. G. Castner, Application of surface chemical analysis tools for characterization of nanoparticles, Anal. Bioanal. Chem., 2010, 396(3), 983–1002 CrossRef CAS PubMed.
- J. H. Choi, G. A. T. Duller and A. G. Wintle, Analysis of quartz LM-OSL curves, Ancient TL, 2006, 24(1), 9–20 CAS.
- N. F. Mott and R. W. Gurney, Electronic Theories in Ionic Solids, Oxford Univ. Press, New York, 1940 Search PubMed.
- H. Yasuda and I. Kobayashi, Optically stimulated luminescence from Al2O3:C irradiated with relativistic heavy ions, Radiat. Prot. Dosim., 2001, 95(4), 339–343 CrossRef CAS PubMed.
- A. Soni, D. R. Mishra, B. C. Bhatt, S. K. Gupta, N. S. Rawat, M. S. Kulkarni and D. N. Sharma, Thermally assisted OSL: a potent tool for improvement in minimum detectable dose and extension of dose range of Al2O3:C, Geochronometria, 2013, 40(4), 258–265 CrossRef CAS.
- L. C. Oliveira, E. G. Yukihara and O. Baffa, MgO:Li, Ce, Sm as a high-sensitivity material for optically stimulated luminescence dosimetry, Sci. Rep., 2016, 6, 24348 CrossRef CAS PubMed.
- V. Dierolf, Electronic defect states in alkali halides: effects of interaction with molecular ions, Springer Science & Business Media, 2003, vol. 185 Search PubMed.
- K. N. Shinde, S. Dhoble, H. Swart and K. Park, Basic Mechanisms of Photoluminescence, in Phosphate Phosphors for Solid-State Lighting, Springer, 2012, pp. 41–59 Search PubMed.
| This journal is © The Royal Society of Chemistry 2017 |