
 Open Access Article
 This Open Access Article is licensed under a Creative Commons Attribution-Non Commercial 3.0 Unported Licence
Sr1.7Zn0.3CeO4F0.2:Eu3+: novel dual-emission temperature sensors for remote, noncontact thermometric application†
Haifeng Lia,
Ran Pang*a,
Wenzhi Sunab,
Huimin Liab,
Tengfei Mac,
Yonglei Jiaa,
Da Lia,
Lihong Jianga,
Su Zhanga and
Chengyu Li *a
*a
aState Key Laboratory of Rare Earth Resource Utilization, Changchun Institute of Applied Chemistry, Chinese Academy of Sciences, Changchun 130022, P. R. China. E-mail: pangran@ciac.ac.cn; cyli@ciac.ac.cn
bUniversity of Chinese Academy of Sciences, Beijing 100049, P. R. China
cShandong Industrial Ceramics Research & Design Institute Co., Ltd, Zibo 255000, P. R. China
First published on 1st February 2017
Abstract
A novel dual-emitting temperature sensor, Sr1.7Zn0.3CeO4F0.2:Eu3+, is successfully synthesized via a ceramic reaction. Powder X-ray diffraction patterns and Rietveld refinement verify the phase purity of the sensor. Its photoluminescence spectrum exhibits a pronounced intrinsic dual emission, theoretically divided by the wavelength of 570 nm: one stems from Eu3+ and the other is derived from the Ce4+–O2− charge transfer state. The temperature-dependent luminescence spectra of the dual-emission thermophosphor demonstrate its superior sensitivity towards ambient temperature. Further studies illustrate that the intensity ratio between the aforementioned two parts, as a function of temperature, is perfectly linear over a broad temperature window, yielding a convenient and accurate approach to obtain the temperature of a target, measured using the noncontact self-referencing model. We also investigate the basis of the underlying mechanism of Sr1.7Zn0.3CeO4F0.2:Eu3+ as a dual-emission thermometric sensor. The research herein shows that the intrinsic dual-emission sensor, as a new-fashioned thermophosphor, displays potential for ratiometric intensity measurements in thermometry domains.
1. Introduction
Temperature, which has a strong relationship with humans, is of considerable significance in daily life and contributes greatly to human progress.1–3 Over the past decades, technology has promoted the measurement of temperature to a high degree. However, with the increasing sophistication of targets and continuously pursued accuracy comes the demand for technology to obtain the temperature with a high degree of precision, which thus fully enables the requirement of the society.4The traditional design paradigm of temperature measurement, presently widely used, is based on the principle of either the thermal expansion of materials like liquid-filled glass thermometers5 or the Seebeck effect, such as in thermocouples,6,7 which is called touch thermography. However, this technique is not suitable for the measurement of surface temperature and has the drawback of only limited temperature points on the surface. Furthermore, it cannot be applied in harsh and corrosive environments, such as in wind tunnels, rocket engines, and gas centrifuge rotors.8,9 Since temperature is the most consequential parameter in the field of industry and society, the development of methods for temperature measurement remains popular.10–19 Among the different methods, the recent emerging method of optical thermometry has drawn world-wide attention due to its unique advantages of contactless, non-invasiveness and wide-angle mapping surface temperature measurements, along with remote detection, high accuracy, high signal yield, cost-effectiveness, and quantitative global temperature/heating information, which readily determines the temperature with competitive accuracy at any given point on a surface, as well as enables the realization of the surface temperature distribution.14,20–27 In addition, this method can be applied to the temperature measurement of both static and dynamic surfaces.28,29
Since this method can be conducted remotely, it is of vital significance in environments that are full of noise, hazards and explosives. Furthermore, the fluorescence thermometry method is immune to extraneous interferences, as well as has a wide temperature range based on the selection of the proper thermophosphor. Among the fluorescence methods, the ratiometric intensity measurement (RIM) shows the most potential compared with the measurement of intensity, lifetimes, and anisotropy.30 The spectroscopic scheme of RIM is straightforward, easy to manipulate and widely used to reference luminescence intensity data. In RIM, the intensity of the second band is related to the temperature-dependent signal. Ideally, the reference intensity of the second band responds to temperature in the opposite direction.31,32 This ratiometric referencing scheme can cancel out variations in indicator concentration, geometry, source intensity, and light field. On the other hand, however, light scattering, background fluorescence and reflection are not compensated for.33 Generally, there are two common approaches in RIMs: one is based on referencing an indicator signal to a second dye,34 the other is dual emission wavelength probes.35 In the first approach, it can be compromised by Förster resonance energy transfer (FRET) and different photo-bleaching rates of the probe and reference dye, whereas the probes applicable for the second approach are rare. Herein, the ratio of intensities of two emission bands represents the intrinsically referenced signal. This method can eliminate most of the aforementioned drawbacks and therefore is preferred.
The indispensable and fundamental component in fluorescence thermometry is the temperature sensor. To date, several dual-emission temperature sensors have been developed, such as ZnS:Mn2+,Eu3+,36 CdSe/ZnS,37 and NaYF4:Er3+,Yb3+.38 A review has summarized the dual-emitting temperature sensors.39 However, the research on thermometric sensors with uncomplicated preparation procedures, such as oxides, is rare.
Sr2CeO4, reported by Danielson et al. in 1998, has an orthorhombic unit cell with Pbam as the space group,40,41 which proves to be a new efficient rare-earth phosphor with 100% activator concentration emitting bright blue white fluorescence under the excitation of UV light, X rays, or cathode rays.42,43 Generally, the blue white emission is derived from the Ce4+–O2− charge transfer state (Ce–O CTS).44 Upon the appearance of Sr2CeO4, substantial studies have been focused on its synthesis, structure, emission mechanism and potential applications. Moreover, Eu3+ due to the characteristic electronic configuration 4f6, can exhibit adequate emission colors, such as blue, green, and red, which plays a significant role in modern lighting and display domains.45–47 These characteristics of Eu3+ have inspired researchers to investigate the optical properties of Eu3+-doped Sr2CeO4, which prove to be substantially influenced by the energy transfer from Ce–O CTS to Eu3+.48–50 When the concentration of Eu3+ becomes higher, the emission from Ce–O CTS reduces until it disappears and eventually the emission originating from Eu3+ predominates owing to the energy transfer from Ce–O CTS to Eu3+, leading to the characteristic emission of Eu3+.50,51 Consequently, the emission color of Sr2CeO4:Eu3+ phosphors changes from blue to red with an increase in the content of Eu3+, which favors potential applications in TV tubes and high (low) pressure mercury vapor lamps. In addition, a thorough investigation of the temperature-dependent emission of Sr2CeO4:Eu3+ has been performed, and the result indicates that Sr2CeO4:Eu3+ has a potential utility in fluorescence thermometry.27
In terms of the narrow excitation and poor thermal stability of Sr2CeO4:Eu3+ phosphors, however, the modified Sr1.7Zn0.3CeO4:Eu3+ phosphors in our previous study have been systematically discussed, which proved their substantially improved excitation wavelengths and thermal stability.52 In addition, based on its effective radius, a favorable preference to substitute Sr2+ ions for Eu3+ ions after the introduction of Eu3+ into Sr2CeO4, gives rise to charge imbalance. Therefore, we investigated the influence of the charge compensation on the optical properties of the Sr2CeO4:Eu3+ phosphors, and verified that charge compensation can boost luminescent properties.46 Hence, the organic combination of the aforementioned modified approaches of phosphors enables us to further investigate the potential application of phosphors in the thermometry domain.
To the best of our knowledge, related research on thermometry in the cerium–strontium–zinc oxyfluoride system is rarely reported, even though Sr2CeO4-based systems have been widely investigated and reported in previous studies. Therefore, in this study, we describe a novel oxyfluoride-based dual emission sensor, Sr1.7Zn0.3CeO4F0.2:0.005Eu3+, which can meet the requirements of near-UV light excitation and dual-emitting temperature sensors. Powder X-ray diffraction and Rietveld refinement are employed to substantiate the crystal structure and phase homogeneity of the pre-synthesized Sr1.7Zn0.3CeO4F0.2:0.005Eu3+. Under the proper doped concentration of Eu3+, the emission of both the Ce4+–O2− charge transfer state and Eu3+ is realized. The photoluminescence behavior of the sample, as a function of temperature, within the range of 298 K to 473 K is thoroughly discussed. The thermal quenching property demonstrates the suitable temperature-dependent fluorescence emission, which is indispensable for emission temperature sensors. Particularly, the dual-emission technique, which is the ratio of the two portions of the emission spectrum divided by 570 nm, is adopted to study the potential application of the sensor for noncontact luminescence thermometry. In addition, the sensitivity and resolution results show that the reported dual-emission temperature sensor is powerful for future application in thermometry. The fundamental underpinning mechanism of the Sr1.7Zn0.3CeO4F0.2:0.005Eu3+ dual-emission sensor is also explored. In short, not only is a specific system reported in this study, but also a methodology that could be generalized to other systems by modifying the original system is described.
2. Experimental
2.1 Materials and synthesis
The novel dual-emitting phosphor, Sr1.7Zn0.3CeO4F0.2:0.005Eu3+ (SZCF:Eu3+), was synthesized via a traditional high-temperature solid-state reaction. The starting materials, SrCO3 (A.R., 99.9%), CeO2 (A.R., 99.9%), Eu2O3 (A.R., 99.99%), SrF2 (A.R., 99.99%), and ZnO (A.R., 99.9%), were weighed at stoichiometric ratios. The raw materials were mixed and ground in an agate mortar thoroughly, and the homogenous mixtures were transferred to an alumina crucible and sintered at 1000 °C for 10 h in air. Then, the precursor was reground and calcined at 1000 °C for 10 h again. After cooling to room temperature (RT) naturally, the as-obtained phosphor was ground into a powder for further measurements.2.2 Characterization
Powder X-ray diffraction (PXRD) profiles for phase identification were collected using a D8 Focus diffractometer operating at 40 kV and 40 mA with graphite-monochromated Cu Kα radiation (λ = 0.15405 nm) at a scanning rate of 10° min−1 with 2θ ranging from 10 to 65°. The photoluminescence excitation (PLE) and photoluminescence spectra (PL) of the phosphor were measured on a Hitachi F-7000 spectrophotometer with a 150 W xenon lamp excitation source. Three-dimension temperature-dependent (3D-TD) spectra were measured using a homemade instrument mainly consisting of a CCD detector and heating apparatus. The samples were placed in a homemade sample holder and heated from RT to 400 K at the speed of 1 K per second, and temperature-dependence (TD) curves were obtained from the 3D-TD emission spectra with a data transferring technique using computer software. Fourier transform infrared spectra (FTIR) were measured on an FTIR spectrometer (VEPTEX 70) in the range of 400 to 4000 cm−1. All measurements were carried out at RT unless otherwise mentioned.3. Results and discussion
3.1 Phase composition
The standard data of the single-phased crystal structure of Sr2CeO4 in the Joint Committee on Powder Diffraction Standards (JCPDS) card no. 50-0115 was used as the initial reference to explore the actual structure of the sample. The synthesized sensor was analyzed via PXRD to verify the phase composition of SZCF:Eu3+, as portrayed in Fig. 1(a), which is associated with SZCF without the dopant Eu3+ and the referential data. It is apparent from Fig. 1(a) that the PXRD pattern can be well indexed with the standard data of Sr2CeO4, which demonstrates the formation of a single octahedral phase, as well as no generation of any notable impurities due to the incorporation of dopants.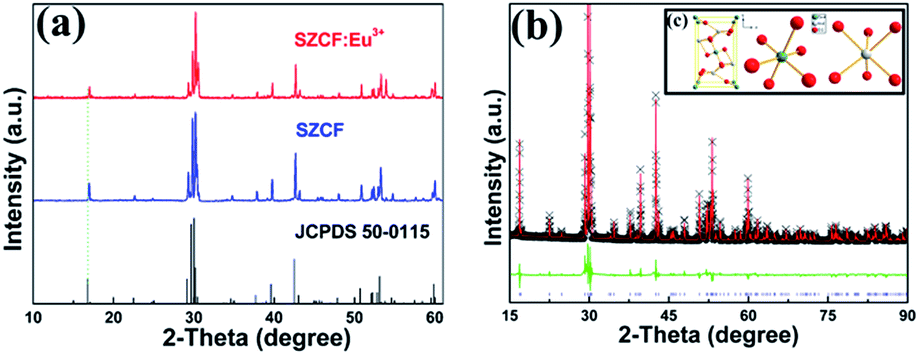 | ||
| Fig. 1 (a) PXRD patterns of SZCF:Eu3+ phosphors associated with the standard reference data of Sr2CeO4 (JCPDS no. 50-0115). (b) Experimental (crosses) and calculated (red solid line) powder PXRD patterns of the Sr1.7Zn0.3CeO4F0.2 matrix. The green solid lines represent the difference between the experimental and calculated data and the blue sticks mark the Bragg reflections. (c) Unit cell structure of Sr2CeO4 and corresponding coordination environments of Ce4+ and Sr2+. | ||
To obtain detailed information about the crystal structure of the sample, the Rietveld refinement of SZCF:Eu3+ was carried out with the single crystal structure data of Sr2CeO4 as the initial model. Fig. 1(b) shows the experimental (black), calculated (red), and difference (green) PXRD profiles for the Rietveld refinement of the SZCF:Eu3+ sample obtained using the general structure analysis system (GSAS) program.53,54 The refinement finally converges to χ = 8.59%, Rwp = 7.75%, and Rp = 5.14%, which illustrates the goodness-of-fit parameter. The detailed result of the refinement is shown in Table 1, which again demonstrates that SZCF:Eu3+ is isotopic with Sr2CeO4 and Eu3+ has been successfully doped into the host lattice Sr1.7Zn0.3CeO4F0.2. The SZCF:Eu3+ phosphor have an orthorhombic unit cell with Pbam as the space group and cell parameters of a = 6.121 Å, b = 10.353 Å, c = 3.598 Å, and cell volume (V) = 228.049 Å3. Fig. 1(c) shows the unit cell structure of Sr2CeO4 and the corresponding coordination environments of the Ce and Sr atoms. In the Sr2CeO4 host, the coordination number (CN) of Ce4+ is 6, which subsequently results in the CeO6 octahedra, whereas the Sr2+ sites are coordinated with six oxygen atoms.41 In addition, the atom positions and thermal parameters of SZCF:Eu3+ attained from the refinement are listed in Table 2.
| Formula | Sr1.7Zn0.3Ce04F0.2:0.005Eu3+ |
| Formula weight | 754.488 |
| Space group | Pbam (no. 55) |
| a (Å) | 6.121 |
| b (Å) | 10.353 |
| c (Å) | 3.598 |
| Units, Z | 2 |
| V (Å3) | 228.049 |
| Crystal density (g cm−3) | 5.561 |
| χ2 | 8.59 |
| Rp (%) | 5.14 |
| Rwp (%) | 7.75 |
| Atom | x | y | z | Uiso × 100 |
|---|---|---|---|---|
| Ce1 | 0 | 0 | 0 | 1.188 |
| Sr1 | 0.06127 | 0.67924 | 0.5 | 1.721 |
| Zn1 | 0.06127 | 0.67924 | 0.5 | 1.721 |
| Eu1 | 0.06127 | 0.67924 | 0.5 | 1.721 |
| O1 | 0.85343(3) | 0.80128(1) | 0 | −1.526 |
| 02 | 0.23893(7) | −0.04378(7) | 0.5 | 2.360 |
| F1 | 0.85343(3) | 0.80128(1) | 0 | −1.526 |
| F2 | 0.23893(7) | −0.04378(7) | 0.5 | 2.360 |
Based on the refinement results and similar effective ionic radii between Eu3+ (1.09 Å for CN = 6), Ce4+ (1.01 Å for CN = 6) and Sr2+ (1.32 Å for CN = 6), O2− (1.26 Å for CN = 6) and F− (1.19 Å for CN = 6),55 we think that Eu3+ would tend to substitute for the Sr2+ site, whereas F− preferably takes the site of O2−. However, due to the difference in the effective radii between Eu3+, Sr2+, F− and O2−, the XRD peaks for SZCF and SZCF:xEu3+ shift to a larger 2θ angle in comparison with that of the original compound, Sr2CeO4, as shown in Fig. 1(a).
3.2 Photoluminescence properties of Sr1.7Zn0.3CeO4F0.2:Eu3+
A prerequisite for the thermometric sensor is that its excitation wavelength is supposed to fall within the wavelength range of commercial near-UV LED chips, which is essential for engineering. Fig. 2(a) shows the PLE spectrum of SZCF:Eu3+ under the monitored wavelength of 475 nm. In addition, it can be proven that the same PLE spectrum could be obtained if the monitored wavelength is at 617 nm. Based on the graph, it is apparent that the range of the wavelength obtained from the PLE spectrum indicates that the sensor is perfectly consistent with the current commercial near-UV LED chips. Even though a large amount of dopants have been introduced into the lattice, the cell structure does not undergo any changes. Based on previous reports, as well as the PXRD measurement, we can index the origin of various peaks. The wide band at 200 to 400 nm together with the apex at 278 nm and bridge peak at 332 nm are derived from Ce–O CTS. In the Sr2CeO4 structure, the equatorial Ce4+–O2− bonds are about 0.1 Å longer than the axial bonds, which leads to the distorted CeO6 octahedron and two excited states. The further study carried out by Nag et al. unraveled that the nature of the PLE spectrum is assigned to the t1g–f CTS and t1u–f CTS, as can be seen from the Gaussian deconvoluted PLE spectrum in Fig. 1(a) on the basis of the energy scale with the peaks at 283 and 346 nm, respectively.56 With respect to the difference in intensity, the t1u–f CTS transition is parity forbidden, which makes the intensity lower compared to that of the allowed t1g–f CTS transition. Apart from this, a weak peak at 395 nm, which is derived from the 7F0–5L6 transition of Eu3+, is also observed, as seen in the inset (c) of Fig. 2(a). Briefly, the fascinatingly wide wavelength of the PLE spectrum of the sensor paves the way for its future commercial application.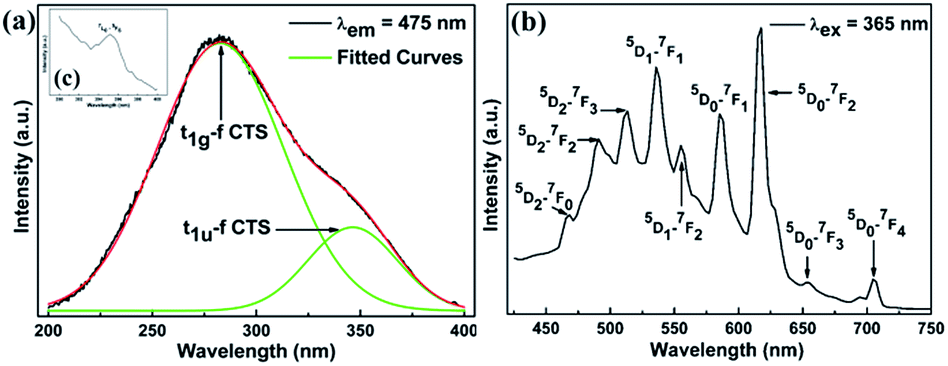 | ||
| Fig. 2 (a) PLE spectra of the SZCF:Eu3+ phosphor monitored at 475 nm. (b) PL spectrum of SZCF:Eu3+ excited at 365 nm. The inset (c) corresponds to the 7F0–5L6 transition of Eu3+. | ||
Based on the proper photoluminescence excitation wavelength, herein, the commercially widely-adopted near ultraviolet (n-UV) LED light enabled us to illuminate the SZCF:Eu3+ thermometric sensor, and subsequently the PL spectrum was obtained as shown in Fig. 2(b). It is remarkable that the spectrum consists of two distinct parts compared with that of SZCF irradiated under the wavelength of 365 nm, as seen in Fig. S1.† The first part stems from Ce–O CTS in the wavelength range of 450 to 600 nm and the other is due to the characteristic transitions of Eu3+. It is clear that the emission from Ce–O CTS overlaps substantially with that of Eu3+. In terms of the various peaks in the second part, they can be indexed to the specific transition of Eu3+. The peaks derived from Eu3+ ions are located at 467, 490, 512, 534, 555, 585, 616, 655 and 707 nm, which are the contributions of the 5D2–7F0, 5D2–7F2, 5D2–7F3, 5D1–7F1, 5D1–7F2, 5D0–7F1, 5D0–7F2, 5D0–7F3 and 5D0–7F4 transitions, respectively. In addition, as observed from the PL spectrum, the appropriately equal intensities of both parts underpin the possibility of dual-emission thermometry.
3.3 Thermal quenching properties of Sr1.7Zn0.3CeO4F0.2:Eu3+
The thermal stability of a phosphor plays a crucial role in its practical application, particularly for thermometric sensors. Fig. 3 shows the evolution of the PL spectra of the sample within the spectral region of 425–750 nm as a function of temperature. Noticeably, the intensity of the spectra decreases with the augmentation of the temperature, which is considerably consistent with the general thermal quenching phenomenon for luminescent materials. As the temperature increases, the energy of the phonon in the phosphor ascends to one point at which the energy is beyond the threshold of quenching. Subsequently, more energy absorbed by the sensor is given off as heat rather than radiation. Thus, we can observe a decreasing intensity with the increase in temperature, which will be further discussed later. On the basis of the abovementioned point, there should be a critical point of the detected temperature beyond which accuracy will not be guaranteed. Therefore, the desperate and challenging issue nowadays is to find proper thermophosphors to substantially lift this critical point.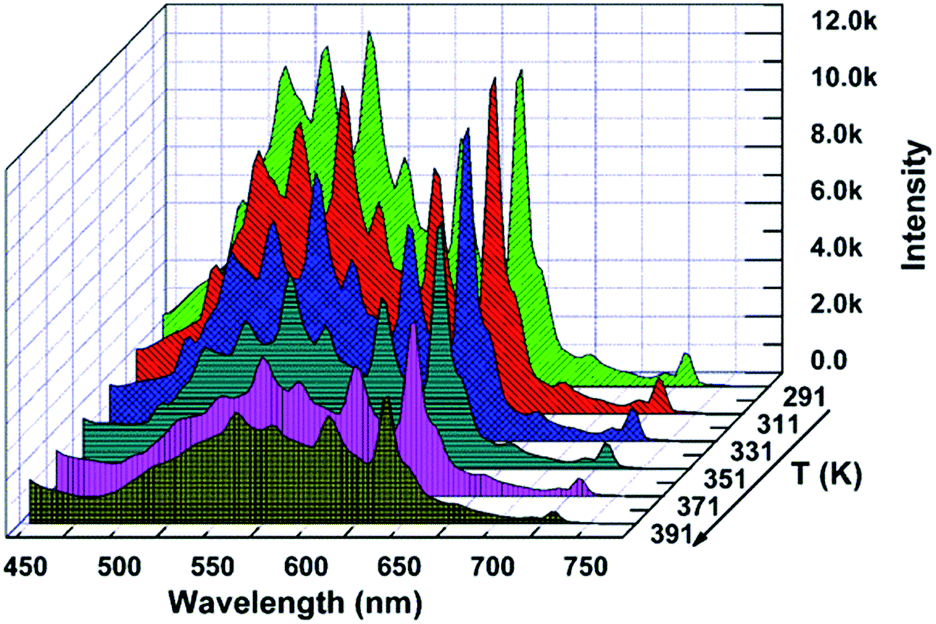 | ||
| Fig. 3 Temperature dependence of the PL spectra of SZOF:Eu3+ under the excitation of 365 nm. | ||
Generally, the color of light has a strong relationship with temperature. Moreover, the color of light could be reflected by the CIE (international commission on illumination) chromaticity coordinates. Therefore, herein, we calculated the coordinates of the light emitted at different temperatures, and the corresponding CIE is plotted in Fig. 4. It is remarkable that the corresponding hues range from light green to yellow. The calculated CIE coordinates are tabulated in Table S1.† The dependence of the color of the light on temperature substantially supports the thermal properties of the SZOF:Eu3+ dual-emission sensor and further reveals its potential in the thermometry field.
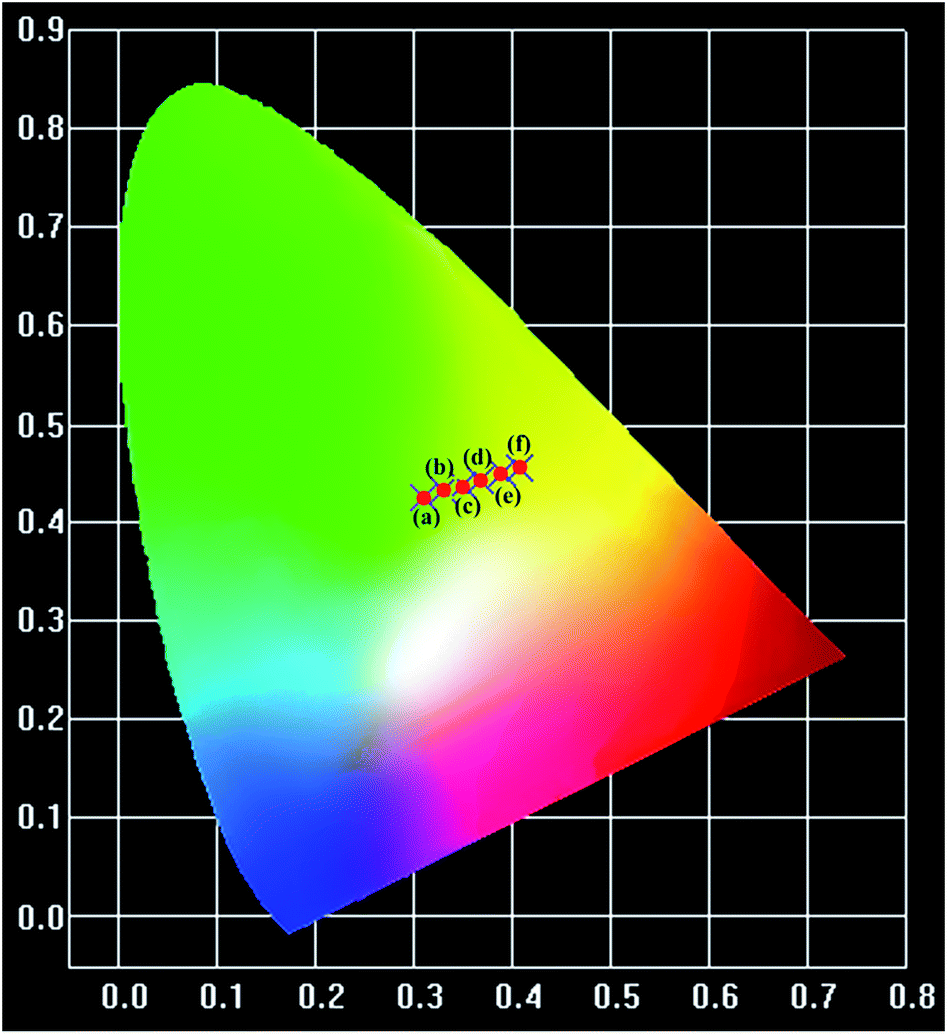 | ||
| Fig. 4 CIE chromaticity diagram of the SZOF:Eu3+ phosphor with temperature (a) T = 291 K, (b) T = 311 K, (c) T = 331 K, (d) T = 351 K, (e) T = 371 K and (f) T = 391 K. | ||
In addition, the temperature dependence of the lifetime of the sensor is capable of being used to investigate the mechanism of the thermal quenching property. We think that the lifetime of the sensor would decrease with an increase in the temperature due to the accelerated rate of the electron to transit from one energy level to another. However, due to limited characterization instruments, we cannot verify our hypothesis via substantial experimental data.
The sensitivity and resolution, as key points of thermometric sensors, determine the degree of precision of the temperature obtained practically. However, the sensitivity of the thermometric sensor, to a large extent, is proportional to the emissive intensity. Generally, the higher the intensity is, the better the sensitivity is. Hence, to obtain the sensitivity of the sensor as well as further verify the feasibility of the sensor in future practical application, we explore the relationship of the integrated intensity (the area under the spectrum) with temperature, as shown in Fig. 5.
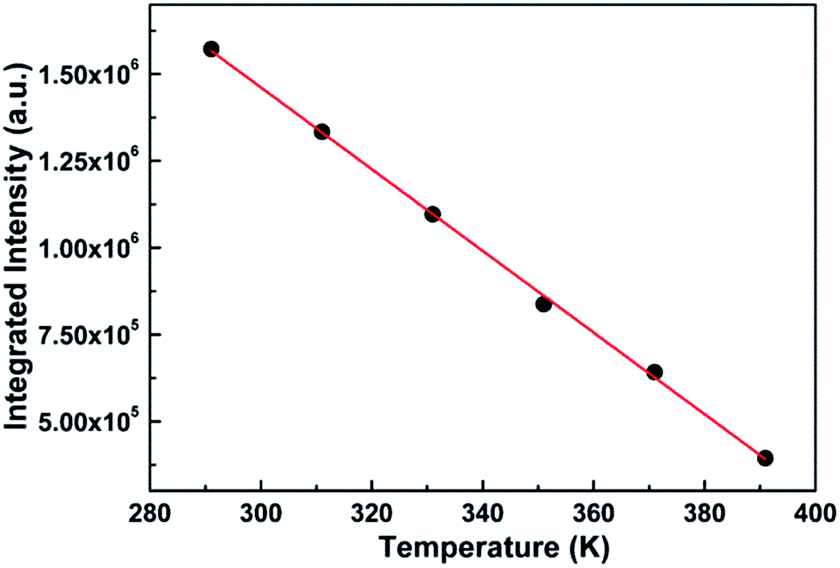 | ||
| Fig. 5 Relationship between the integrated intensity of the PL spectrum of SZOF:Eu3+ and temperature. | ||
It is remarkable from the graph that the integral intensity decreases with an increase in temperature, which is consistent with the trend of the variation of the spectra with temperature, and further verifies the thermal quenching behavior of phosphors.57 On the other hand, the order of magnitude of the integrated intensity is large enough that even the least sensitive photomultiplier is capable of detecting the intensity. In other words, the sensitivity of the dual-emitting phosphor can satisfy the essential requirement of the practical application. In addition to the importance of intensity closely associated with sensitivity, the relationship of the integrated intensity with temperature is also vital to thermometry. If a relation is readily attained, such as linear or quadratic, it is easy to deduce the appropriate temperature based on the measured integral intensity, which may be considered as the calibrated reference temperature compared with that from dual-emission thermometry.58
Fig. 5 displays the dependence of the integrated intensity on temperature. Clearly, the relation of the integrated intensity with temperature is linear within the range of 291 K and 391 K, which can match the fundamental requirement of the practical application. By fitting the data, the linear function can be obtained as follows:
| I = −1.18 × 10⁴T + 4.99 × 10⁶ | (1) |
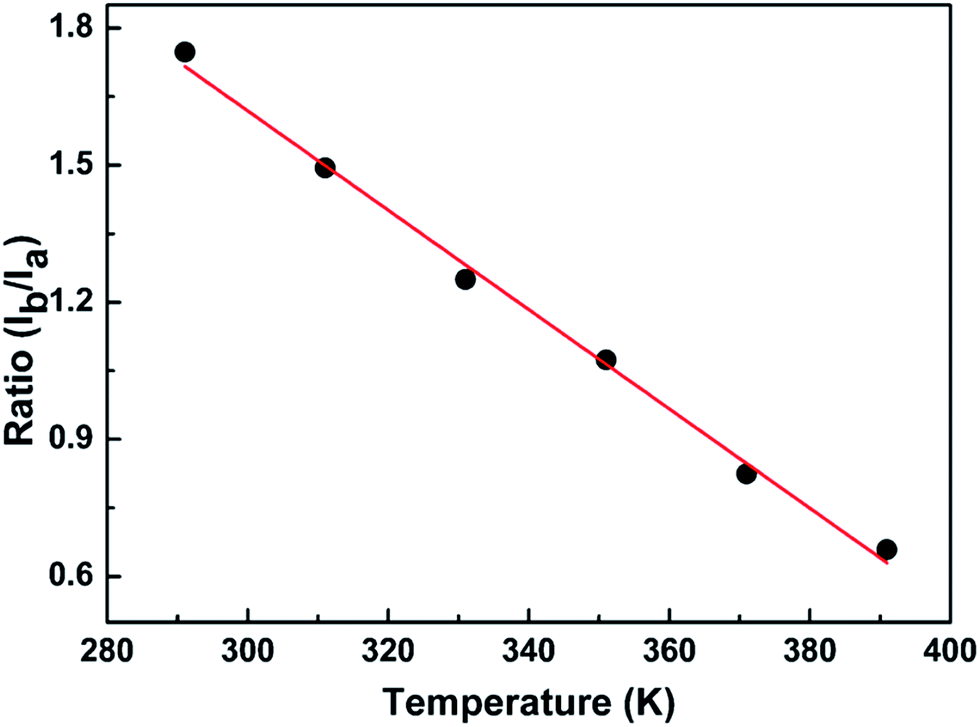
The fundamental basis of the dual-emission thermometry is the simple relationship between the ratio and the temperature through which we can obtain the desired temperature. Hence, we plotted the graph of the integrated intensity ratio versus temperature. Firstly, the best separator wavelength to realize dual emission and higher sensitivity was determined after trial and error, which is 570 nm. In principle, this method is very similar with that adopted for the Eu3+@UiO-bpydc59 sensor and reported by Shi.27 The ratio Ib/Ia was calculated using the integrated intensity Ib, of the spectrum before the wavelength of 570 nm, divided by Ia, of the spectrum after the wavelength of 570 nm. Then, we obtained the plot of the intensity ratio as a function of temperature, as illustrated in Fig. 6.
 | ||
| Fig. 6 Dependence of the ratio Ib/Ia of the integrated intensity on temperature. | ||
Conspicuously, the relation of the ratio with temperature is linear, which satisfies the requirement of the simple relationship of the ratio versus temperature. The linear relation remains perfect in the temperature range between 291 K and 391 K and obeys the following function:
| R = −0.01T + 4.88 | (2) |
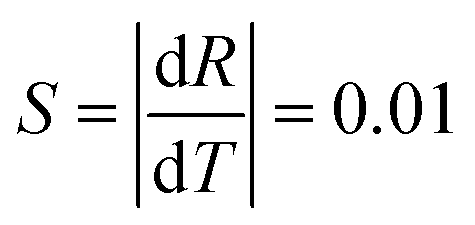 | (3) |
3.4 Mechanism of the dual-emission thermometry of Sr1.7Zn0.3CeO4F0.2:Eu3+
It is known that the temperature-dependent luminescence of a phosphor is attributed to its intrinsic energy level structures.61 We, herein, first provide the interior mechanism that accounts for the thermal quenching properties of the Sr1.7Zn0.3CeO4F0.2:Eu3+ dual-emission sensor. Generally, configuration coordinate models (CCMs) are used to qualitatively interpret temperature-dependent phenomena. The CCMs of Ce4+ and Eu3+ are plotted in Fig. 7. As shown in Fig. 7(a), the Ce4+–O2− (C–O) charge transfer state (CTS) intersects with the ground state of Ce4+ at point A. With an increase in temperature, electrons in the excited C–O CTS are thermally excited to the intersection point A and then non-radiatively return to the ground state (GS), resulting in the thermal quenching of Ce–O CTS. For the Eu3+–O2− (E–O) CTS shown in Fig. 7(b), not only does it cross with the GS of Eu3+ at point B, but it also interacts with the three excited states 5D2, 5D1, and 5D0 at point C, D, and E, respectively. Similar to the motion of electrons in C–O CTS, when the temperature of the sensor augments, electrons in the 5D0 excited state non-radiatively return to the GS via the path “5D0 → E–O CTS → GS”, which contributes to the thermal luminescence quenching of the 5D0 state. However, for electrons in the 5D1 and 5D2 excited states, some of them might experience similar thermal quenching mechanisms, “5D1 → E–O CTS → GS” and “5D2 → E–O CTS → GS”, as that in the excitation state of the 5D0 energy level, whereas some of them might originally cascade to the lowest excited 5D0 state via two approaches, “5D2 → E–O CTS → 5D0” and “5D1 → E–O CTS → 5D0”, and then go through the same route as that in the 5D0 state. The radiative emissions of C–O CTS and Eu3+ are competitive with the corresponding non-radiative thermal quenching. At low temperature, luminescence dominates, whereas at high temperature, thermal quenching is dominant. As the temperature increases, the energy of the phonons increases, which leads to the predominance of thermal quenching. This is why at higher temperatures there is little luminescence emitting from the activator. Nowadays, it is imperative to explore sensors with higher thermal quenching temperatures (Tq). Herein, we provide a definition for Tq, which is the temperature at which the integrated luminescence intensity is 50% of its original value referring to the integrated intensity at RT.62 Hence, in terms of the definition point of view, the Tq value of 367.5 K for the sensor can be deduced from Fig. 5, which needs to be further improved to meet the practical requirement.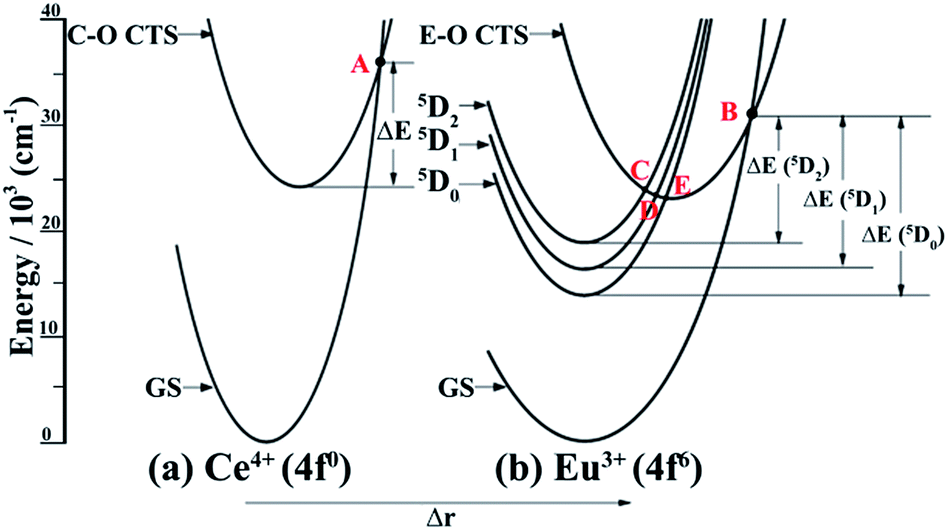 | ||
| Fig. 7 Configuration coordinate models of Sr1.7Zn0.3CeO4F0.2:Eu3+. C–O CTS and E–O CTS represent the Ce4+–O2− and Eu3+–O2− charge transfer states, respectively. ΔE, ΔE(5D0), ΔE(5D1) and ΔE(5D2) represent the thermal activation energy of emissions from the Ce–O CTS and 5D0, 5D1 and 5D2 excited states of Eu3+, respectively. GS indicates the ground state of Ce4+ or Eu3+. A, B, C, D, and E stand for the corresponding intersection points. | ||
Although the above description states the reason leading to the thermal quenching of the luminescence, another essential challenge arises, which is, why should Sr1.7Zn0.3CeO4F0.2:Eu3+ be considered a dual-emitting thermometric sensor. According to previous reports, there are three general scenarios by which dual emission sensors in the broadest sense have been achieved and further categorized by the extent of population transfer between the two luminescent excited states.60 In addition, the reports about the Eu3+-doped Sr2CeO4 phosphors studied before determined that the effective energy transfer is from C–O CTS to Eu3+.50,55 Therefore, the presently reported Sr1.7Zn0.3CeO4F0.2:Eu3+ dual-emitting thermometric sensor can be categorized into the second scenario: the involved two optical centers are coupled electronically such that the energy transfer occurs from one emitter (the donor) to the other (the acceptor) and emission can be observed from both the donor and acceptor due to the same time scaled occurrence of the energy transfer and the donor luminescence. As we reported before, the predominant energy transfer from C–O CTS to Eu3+ is considered to be of the dipole–dipole interaction type, which supports theoretically the rationality of the use of Sr1.7Zn0.3CeO4F0.2:Eu3+ in the dual-emission sensor. However, the difference between the presently reported sensor and previously reported sensors is that there is a slight overlap between the emission from C–O CTS and that of Eu3+. However, due to the same principle, the slight overlap may not influence the measurement of temperature. Overall, the reported Sr1.7Zn0.3CeO4F0.2:Eu3+ phosphor has tremendous potential for use as a dual-emitting thermometric sensor in the practical field.
4. Conclusions
A novel dual-emitting temperature sensor, Sr1.7Zn0.3CeO4F0.2:0.005Eu3+, was successfully synthesized via a traditional solid-state reaction. Powder X-ray diffraction patterns and Rietveld refinement verify the phase purity of the sensor. Its photoluminescence spectrum exhibits a pronounced intrinsic dual emission divided by the wavelength of 570 nm: one stems from Eu3+ and the other is derived from the Ce4+–O2− charge transfer state (CTS). The temperature-dependent luminescence spectra of the thermophosphor demonstrate the superior sensitivity of the sample to the ambient temperature. Further studies illustrate that the integral intensity ratio between the aforementioned two parts, as a function of temperature, is perfectly linear over a broad temperature window with proper temperature sensitivity, yielding a convenient and accurate approach to obtain the ambient temperature measured using the noncontact self-referencing mode. We also investigate the basis of the underlying mechanism of Sr1.7Zn0.3CeO4F0.2:Eu3+ for use as a dual-emission thermometric sensor. The research herein demonstrates that the intrinsic dual-emission sensor, as a new-fashioned thermo-sensor, enables the attraction and potential for ratiometric optical thermometry domains. We hope that this methodology would provide insight for other systems to further improve thermometry.Acknowledgements
The authors are grateful to the financial aid from the National Basic Research Program of China (973 Program, Grant No. 2014CB643801), Key Program of the Frontier Science of the Chinese Academy of Sciences (Grant No. YZDY-SSW-JSC018), and National Natural Science Foundation of China (Grant No. 51402288, 51102229).References
- P. R. N. Childs, J. R. Greenwood and C. A. Long, Rev. Sci. Instrum., 2000, 71, 2959 CrossRef CAS.
- J. B. Weaver, Nat. Nano, 2010, 5, 630 CrossRef CAS PubMed.
- E. F. J. Ring, Infrared Phys. Technol., 2007, 49, 297 Search PubMed.
- S. W. Allison and G. T. Gillies, Rev. Sci. Instrum., 1997, 68, 2615 CrossRef CAS.
- L. Michalski, K. Eckersdorf, J. Kucharski and J. McGhee, Temperature Measurement, Wiley, Chichester, UK, 2nd edn, 2001 Search PubMed.
- N. W. Ashcroft and N. D. Mermin, Solid State Physics, Saunders College, Philadelphia, 1976 Search PubMed.
- S. Maekawa, T. Tohyama, S. E. Barnes, S. Ishihara, W. Koshibae and G. Khaliullin, Physics of transition metal oxides, Springer Verlag, 2004 Search PubMed.
- L. C. Bradley, Rev. Sci. Instrum., 1953, 24, 219 CrossRef CAS.
- K. W. Tobin, S. W. Allison, M. R. Cates, G. J. Capps and D. L. Beshears, AIAA J., 1990, 28, 1485 CrossRef.
- J. Hye Oh, S. Ji Yang and Y. Rag Do, Light: Sci. Appl., 2014, 3, e141 CrossRef.
- X. Li, J. D. Budai, F. Liu, J. Y. Howe, J. Zhang, X.-J. Wang, Z. Gu, C. Sun, R. S. Meltzer and Z. Pan, Light: Sci. Appl., 2013, 2, e50 CrossRef.
- G. Lozano, D. J. Louwers, S. R. K. Rodriguez, S. Murai, O. T. A. Jansen, M. A. Verschuuren and J. Gomez Rivas, Light: Sci. Appl., 2013, 2, e66 CrossRef.
- T. Pulli, T. Donsberg, T. Poikonen, F. Manoocheri, P. Karha and E. Ikonen, Light: Sci. Appl., 2015, 4, e332 CrossRef CAS.
- W. Chaze, O. Caballina, G. Castanet and F. Lemoine, Exp. Fluids, 2016, 57, 1 CrossRef CAS.
- T. Barilero, T. Le Saux, C. Gosse and L. Jullien, Anal. Chem., 2009, 81, 7988 CrossRef CAS PubMed.
- J. Petit, B. Viana and P. Goldner, Opt. Express, 2011, 19, 1138 CrossRef CAS PubMed.
- M. A. R. C. Alencar, G. S. Maciel, C. B. de Araújo and A. Patra, Appl. Phys. Lett., 2004, 84, 4753 CrossRef CAS.
- L. Salmon, G. Molnar, D. Zitouni, C. Quintero, C. Bergaud, J.-C. Micheau and A. Bousseksou, J. Mater. Chem., 2010, 20, 5499 RSC.
- P. Löw, B. Kim, N. Takama and C. Bergaud, Small, 2008, 4, 908 CrossRef PubMed.
- S. W. Allison, W. H. Andrews, D. L. Beshears, M. R. Cates, R. M. Childs, E. B. Grann, W. W. Manges, T. J. McIntyre, M. B. Scudiere and M. L. Simpson, Application of phosphor thermometry to a Galvanneal Temperature Measurement System, Oak Ridge National Laboratory (ORNL), Oak Ridge, TN, 1999 Search PubMed.
- M. D. Chambers, P. A. Rousseve and D. R. Clarke, Surf. Coat. Technol., 2008, 203, 461 CrossRef CAS.
- L. P. Goss, A. A. Smith and M. E. Post, Rev. Sci. Instrum., 1989, 60, 3702 CrossRef CAS.
- S. Wang, S. Zheng, H. Zhou, A. Pan, G. Wu and J.-m. Liu, Appl. Phys. A, 2015, 121, 773 CrossRef CAS.
- G. Beheim, in Integrated Optics, Microstructures, and Sensors, Springer, US, Boston, MA, 1995, pp. 285–313, DOI:10.1007/978-1-4615-2273-7_12.
- P. Wang, G. Rajan, Y. Semenova and G. Farrell, Opt. Lett., 2008, 33, 2470 CrossRef PubMed.
- X.-d. Wang, O. S. Wolfbeis and R. J. Meier, Chem. Soc. Rev., 2013, 42, 7834 RSC.
- L. Shi, H. Zhang, C. Li and Q. Su, RSC Adv., 2011, 1, 298 RSC.
- C. Abram, B. Fond, A. L. Heyes and F. Beyrau, Appl. Phys. B, 2013, 111, 155 CrossRef CAS.
- L. Mannik, S. K. Brown and S. R. Campbell, Appl. Opt., 1987, 26, 4014 CrossRef CAS PubMed.
- L. H. Fischer, G. S. Harms and O. S. Wolfbeis, Angew. Chem., Int. Ed., 2011, 50, 4546 CrossRef CAS PubMed.
- P. R. N. Childs, in Thermometry at the Nanoscale: Techniques and Selected Applications, The Royal Society of Chemistry, 2016, pp. 1–22, 10.1039/9781782622031-00001.
- C. Gosse, C. Bergaud and P. Löw, Thermal Nanosystems and Nanomaterials, ed. S. Volz, Springer, Berlin, Heidelberg, 2009, vol. 118, pp. 301–341 Search PubMed.
- N. Ishiwada, T. Ueda and T. Yokomori, Luminescence, 2011, 26, 381 CrossRef CAS PubMed.
- X.-d. Wang, X.-h. Song, C.-y. He, C. J. Yang, G. Chen and X. Chen, Anal. Chem., 2011, 83, 2434 CrossRef CAS PubMed.
- V. A. Vlaskin, N. Janssen, J. van Rijssel, R. Beaulac and D. R. Gamelin, Nano Lett., 2010, 10, 3670 CrossRef CAS PubMed.
- S. Wang, S. Westcott and W. Chen, J. Phys. Chem. B, 2002, 106, 11203 CrossRef CAS.
- J. S. Guasto and K. S. Breuer, Exp. Fluids, 2008, 45, 157 CrossRef CAS.
- F. Vetrone, R. Naccache, A. Zamarrón, A. Juarranz de la Fuente, F. Sanz-Rodríguez, L. Martinez Maestro, E. Martín Rodriguez, D. Jaque, J. García Solé and J. A. Capobianco, ACS Nano, 2010, 4, 3254 CrossRef CAS PubMed.
- E. J. McLaurin, L. R. Bradshaw and D. R. Gamelin, Chem. Mater., 2013, 25, 1283 CrossRef CAS.
- E. Danielson, M. Devenney, D. M. Giaquinta, J. H. Golden, R. C. Haushalter, E. W. McFarland, D. M. Poojary, C. M. Reaves, W. H. Weinberg and X. D. Wu, Science, 1998, 279, 837 CrossRef CAS PubMed.
- E. Danielson, M. Devenney, D. M. Giaquinta, J. H. Golden, R. C. Haushalter, E. W. McFarland, D. M. Poojary, C. M. Reaves, W. H. Weinberg and X. D. Wu, J. Mol. Struct., 1998, 470, 229 CrossRef CAS.
- S. K. Gupta, M. Sahu, K. Krishnan, M. K. Saxena, V. Natarajan and S. V. Godbole, J. Mater. Chem. C, 2013, 1, 7054 RSC.
- T. Hirai and Y. Kawamura, J. Phys. Chem. B, 2004, 108, 12763 CrossRef CAS.
- L. van Pieterson, S. Soverna and A. Meijerink, J. Electrochem. Soc., 2000, 147, 4688 CrossRef CAS.
- S. H. Park, K. H. Lee, S. Unithrattil, H. S. Yoon, H. G. Jang and W. B. Im, J. Phys. Chem. C, 2012, 116, 26850 CAS.
- H. Li, Y. Jia, W. Sun, J. Fu, R. Pang and C. Li, Mater. Lett., 2015, 139, 258 CrossRef CAS.
- W. Sun, Y. Jia, T. Ma, D. Li, H. Li, L. Jiang, S. Zhang, J. Fu, R. Pang and C. Li, ChemistrySelect, 2016, 1, 462 CrossRef CAS.
- R. Sankara and G. V. Subba Rao, J. Electrochem. Soc., 2000, 147, 2773 CrossRef.
- O. Viagin, A. Masalov, I. Ganina and Y. Malyukin, Opt. Mater., 2009, 31, 1808 CrossRef CAS.
- H. Li, Y. Jia, W. Sun, R. Zhao, J. Fu, L. Jiang, S. Zhang, R. Pang and C. Li, Opt. Mater., 2014, 36, 1883 CrossRef CAS.
- L.-L. Shi, C.-Y. Li and Q. Su, J. Fluoresc., 2011, 21, 1461 CrossRef CAS PubMed.
- H. Li, R. Zhao, Y. Jia, W. Sun, J. Fu, L. Jiang, S. Zhang, R. Pang and C. Li, ACS Appl. Mater. Interfaces, 2014, 6, 3163 CAS.
- A. C. Larson and R. B. V. Dreele, Los Alamos National Laboratory Report, 1994, LAUR 86-748 Search PubMed.
- H. Rietveld, J. Appl. Crystallogr., 1969, 2, 65–71 CrossRef CAS.
- R. Shannon, Acta Crystallogr., Sect. A: Cryst. Phys., Diffr., Theor. Gen. Crystallogr., 1976, 32, 751 CrossRef.
- A. Nag and T. R. Narayanan Kutty, J. Mater. Chem., 2003, 13, 370 RSC.
- D. T. Palumbo and J. J. Brown, J. Electrochem. Soc., 1970, 117, 1184 CrossRef CAS.
- Ž. Antić, M. D. Dramićanin, K. Prashanthi, D. Jovanović, S. Kuzman and T. Thundat, Adv. Mater., 2016, 28, 7745 CrossRef PubMed.
- Y. Zhou and B. Yan, J. Mater. Chem., 2015, 3, 9353 RSC.
- A. K. Singh, P. K. Shahi, S. B. Rai and B. Ullrich, RSC Adv., 2015, 5, 16067 RSC.
- W. H. Fonger and C. W. Struck, J. Chem. Phys., 1970, 52, 6364 CrossRef CAS.
- C. C. Lin, R. S. Liu, Y. S. Tang and S. F. Hu, J. Electrochem. Soc., 2008, 155, J248 CrossRef CAS.
Footnote |
| † Electronic supplementary information (ESI) available. See DOI: 10.1039/c6ra25092k |
| This journal is © The Royal Society of Chemistry 2017 |