DOI:
10.1039/C6RA24959K
(Paper)
RSC Adv., 2017,
7, 10353-10360
Integration of pharmacophore mapping and molecular docking in sequential virtual screening: towards the discovery of novel JAK2 inhibitors†
Received
9th October 2016
, Accepted 24th January 2017
First published on 7th February 2017
Abstract
An integrated virtual screening protocol by combining molecular docking and pharmacophore mapping was established to identify novel inhibitors of JAK2 from a commercial compound database. Twelve novel and structurally diverse hits were selected and subjected to in vitro biological tests, and three compounds (A5, A6 and A9) with remarkable JAK2 inhibitory activity were identified. Then, the obtained structures were further used as the template for a subsequent similarity search, leading to the identification of another two promising compounds (B2 and B4). Selectivity profiles of JAK subtype and in vitro anti-cancer activity of the promising compounds were studied, revealing the promising compound B2 was of interest for further study because of its JAK2 selective profile, novelty of skeleton and significantly anti-proliferative effect against cancer cells. Finally, binding patterns of the compounds A5 and B2 were explored to provide a deeper insight for further structural optimization.
Introduction
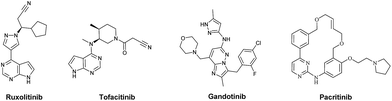
The Janus kinase family (JAK1, JAK2, JAK3 and TYK2) plays a crucial role in the cytokine and growth factor mediated JAK-STAT signal transduction.1 JAK autophosphorylation leads to dimerization of phosphorylated STAT proteins and their translocation into the nucleus, thereby increasing cellular proliferation and resistance to apoptosis.2 Among the Janus kinase family, JAK2 is proved to be associated with the pathogenesis of myeloproliferative disorders (MPDs), primarily including polycythemia vera (PV), essential thrombocytemia (ET), and primary myelofibrosis (PMF).3–5 In particular, the essential role in cell growth and survival makes JAK2 an important target for cancer treatment.6 Until now, numerous JAK2 inhibitors with different scaffolds have been discovered, including AZD1480, Ruxolitinib, Tofacitinib, Lestaurtinib, CYT387, Pacritinib, etc.7–10 But unfortunately, only Ruxolitinib and Tofacitinib have been pushed into clinical use (Fig. 1). Therefore, the JAK2 inhibitors with better drug-like properties and novel structural skeleton are still highly in demand.
 |
| | Fig. 1 JAK2 inhibitors currently in clinical use or trials. | |
As an excellent computational tool for structurally skeleton hoping in drug design, pharmacophore model has been rapidly developed by medicinal chemists in searching for novel hit/lead compounds in various disease areas.11–14 Recently, a combined screening strategy of pharmacophore mapping and molecular docking show synergetic effect in virtual screening.15,16 As such, the integrally globally and partially essential pharmacophoric features for both of ligand and receptor can be simultaneously characterized, thereby showing more preferable performance (e.g. efficiency and accuracy) than the individually used method. Thus, we envisioned that an integration of ligand-based pharmacophore model and structure-based molecular docking can be conducted with respect to JAK2 inhibitors, and the development of JAK2 inhibitors with new scaffolds can be assisted and accelerated by such strategy. In connection with our previous work on computational medicinal chemistry,17 herein, we reported the establishment of pharmacophore and molecular docking models of structurally diverse JAK2 inhibitors, and further sequential virtual screening on commercial SPECS database. To our delight, multiple-substituted aminothiazole derivative B2 bearing the novel scaffolds, the skeleton of which is remarkably different from the existing JAK2 inhibitors. Furthermore, selectivity profiles of JAK subtype and in vitro anti-cancer activity of the promising compounds were studied to demonstrate the further application value. Finally, molecular docking and dynamics were implemented to explore the potential binding mode of the promising compounds with JAK2 protein.
Methods
Docking-based virtual screening by LigandFit
The crystal structure of JAK2 (PDB entry: 4AQC) was employed as the template for molecular docking with the LigandFit protocol.18 All crystallographic water molecules were removed, and the missing hydrogen atoms were added using CHARMm forcefield using “Prepare Protein module”. The resulting target protein structure was subsequently utilized to define the docking site by the bound inhibitor using “Find Sites as Volume of Selected Ligand” tool. For the conformer generation of different ligands in the virtual library, variable numbers of Monte Carlo simulations was implemented. All the ligand–receptor interaction energies during the docking steps were calculated based on the Piecewise Linear Potential 1 (PLP1) forcefield. A short rigid body minimization was then performed and the top one pose for each ligand was saved. Scoring was performed with a set of scoring functions employed in LigandFit module, including LigScore1_Dreiding, LigScore2_Dreiding, -PLP1, -PLP2, Jain, -PMF, DOCK_SCORE.
Pharmacophore hypothesis generation
The training set, which consisted of 15 compounds, was selected by considering the structural diversity and the wide variety of activity ranges presented in Fig. S1 in the ESI.†19–27 Inhibitory activities against JAK2 in the training set were reported as IC50 values ranging from 0.0004 μM to 7.218 μM, covering 5 orders of magnitude (see Table 1). All structures were built and minimized to the closest local minimum by using a modified CHARMm forcefield in the Catalyst program implemented in Discovery Studio 2.5 (Accelrys Software, Inc., San Diego, CA, USA), and the CAESAR algorithm28 was used for conformational analysis of each molecule. In this study, the maximum value of the setting number of the conformer was limited to 250 by using the “best conformers generation” method with a 20 kcal mol−1 energy cutoff, and the default setting was used for the rest of the parameters. Four features (hydrogen bond acceptor, hydrogen bond donor, excluded volumes, and hydrophobic features) were selected to generate the pharmacophore hypothesis; the 3D-QSAR Pharmacophore Generation (HypoGen) module in Discovery Studio 2.5 was used. In addition, the HypoGen program with the default uncertainty value of 2 was used to find pharmacophore models that contain a maximum of five features.
Table 1 Actual and estimated IC50 (μM) for the training set based on the best pharmacophore hypothesis Hypo 1
| No. |
Estimated IC50 (μM) |
Actual IC50 (μM) |
Error ratio |
Ref. |
| 1 |
0.0007 |
0.0004 |
−0.7500 |
19 |
| 2 |
0.0097 |
0.0590 |
0.8356 |
19 |
| 3 |
0.0103 |
0.0120 |
0.1417 |
20 |
| 4 |
0.0105 |
0.0030 |
−2.5000 |
21 |
| 5 |
0.0280 |
0.0510 |
0.4510 |
20 |
| 6 |
0.0711 |
0.0580 |
−0.2259 |
22 |
| 7 |
0.2967 |
0.1550 |
−0.9142 |
22 |
| 8 |
0.4060 |
0.1060 |
−2.8302 |
23 |
| 9 |
0.5145 |
0.2310 |
−1.2273 |
23 |
| 10 |
0.5257 |
0.2020 |
−1.6025 |
21 |
| 11 |
0.8173 |
0.5330 |
−0.5334 |
21 |
| 12 |
0.8281 |
1.4200 |
0.4168 |
23 |
| 13 |
1.5023 |
2.8900 |
0.4802 |
22 |
| 14 |
1.9519 |
7.2180 |
0.7296 |
20 |
| 15 |
2.1109 |
2.7000 |
0.2182 |
19 |
Hit-to-lead (H2L) screening
A second in silico screening of the constructed drug-like database was performed with “Find Similar Molecules by Fingerprints” protocol using the core structures of potent hits (A5, A6 and A9) as queries. 2D molecular fingerprint FCFC_6 method was applied to virtually screen the drug-like database. The minimum similarity was set as 0.3, and other parameters were maintained as default configuration. Following the similarity search, the obtained compounds were further screened using molecular docking and pharmacophore mapping, as described above.
In vitro JAK inhibition assays
The inhibitory activity of compounds against JAK1/2/3 enzyme was evaluated according to published procedure.29 The incubation mixtures contained the following components: 1.1 nM JAK1/2/3, 1.5 μM peptide substrate (5-FAM-KKKKEEIYFFFG-OH for JAK2) and 30 μM ATP. After the incubation for 180 min, the reaction mixture was analyzed on a Caliper LabChip 3000 (Caliper LifeSciences, Hopinkton, MA, USA) by electrophoretic separation of the fluorescent substrate and phosphorylated product. The virtual screening hits were firstly evaluated at the concentration of 20 μg mL−1, and further tested for seven concentrations prepared from 3- or 4-fold serial dilution if the preliminary activity was more than 60%. The IC50 values were generated by the analytical software Prism 5.0 (GraphPad Software Pte Ltd.).
Cell viability assay
Cancer cells were counted in logarithmic phase and 5000 cells were placed in 96-well plates. After treatment with compound B2 for 48 hours, cells were incubated for an additional 2 h with CCK-8 reagent (100 μL mL−1 medium) and the absorbance was read at 450 nm using a microplate reader (Sunnyvale, CA, USA). Cell proliferation inhibition rates were calculated according to the following formula: the proliferation inhibition ratio (%) = 1 − [(A1 − A3)/(A2 − A3)] × 100, where, A1 is the OD value of drug experimental group, A2 is the OD value of blank control group, A3 is the OD value of the RPMI1640 medium without cells. The IC50 (50% inhibitory concentration) value, which represents the concentration of the drug that demonstrates 50% of cell growth inhibition, was calculated by nonlinear regression analysis using GraphPad Prism software (San Diego, CA, USA). Assays were performed on three independent experiments. Cancer cells (H1975, PANC-1, PC-9) were was purchased from Shanghai Institutes for Biological Sciences, CAS (Shanghai, China). RPMI-1640 medium and fetal bovine serum (FBS) were purchased from Gibco, BRL (Grand Island, NY, USA). Cells were cultured with RPMI-1640 medium containing 10% fetal bovine serum (FBS) and 1% penicillin/streptomycin at 37 °C, 5% CO2 humidified atmosphere.
Molecular dynamics (MD) simulations
The docked structures of the potent inhibitor in complex with JAK2 were used as the initial structures for MD calculations. CHARMm forcefield was applied to the complex, and the resulting system was then immersed into an “Explicit Periodic Boundary” water box with sodium cation neutralizing. After that, the solvated system was subjected to double-fold minimization (10![[thin space (1/6-em)]](https://www.rsc.org/images/entities/char_2009.gif) 000 cycles of steepest descent minimization and 100000 cycles of conjugate gradient minimizations). The system was gradually heated to 300 K from 50 K over a period of 100 ps, and subsequently equilibrated for 200 ps. Starting from the last frame of the equilibration, production simulation was performed for 200 ps using the NPT ensemble under a constant temperature of 300 K and pressure of 1 atm. Other parameters of MD simulation are maintained at their Discovery Studio default configuration.
000 cycles of steepest descent minimization and 100000 cycles of conjugate gradient minimizations). The system was gradually heated to 300 K from 50 K over a period of 100 ps, and subsequently equilibrated for 200 ps. Starting from the last frame of the equilibration, production simulation was performed for 200 ps using the NPT ensemble under a constant temperature of 300 K and pressure of 1 atm. Other parameters of MD simulation are maintained at their Discovery Studio default configuration.
Interaction energy decomposition analysis
In order to explore the inhibitor–protein interaction mode and highlight the key residues responsible for the binding affinity, interaction energies for each inhibitor were further decomposed into individual residue contributions using the “Calculate Interaction Energy” protocol. The stable coordinates extracted in the last 50 ps MD simulation were employed here for the interaction energy decomposition analysis.
Results and discussion
Construction of drug-like database
The in silico screening consisted of two steps in the present study, i.e., molecular docking (structure-based method) and pharmacophore modeling (ligand-based method). A total of 217190 compounds were retrieved from the chemical SPECS database (http://www.specs.net). To prepare compounds for in silico screening, all the compounds were processed by “Prepare Ligands” protocol in Accelrys Discovery Studio 2.5 program using the following steps: (1) two-dimensional (2D) structures were converted into three-dimensional (3D) structures, (2) charges were calculated, and (3) H atoms were added, (4) to eliminate compounds with toxic, reactive, or otherwise undesirable moieties, compounds in the Specs database were subjected to “Lipinski's rule of five” filter. After the above preparation, the final drug-like virtual library includes 153691 compounds.
Evaluation of the scoring functions in LigandFit
Before the chemical libraries were screened, the accuracy of scoring functions in LigandFit for identifying the known JAK2 inhibitors was evaluated using distribution analysis and receiver operating characteristic (ROC) curve study. Therefore, 239 known JAK2 inhibitors were retrieved from the BindingDB database,30 while 10000 inactive compounds were randomly chosen from the Maybridge database using the “Find Diverse Molecules” protocol in Discovery Studio 2.5; and they had the maximum diversity evaluated by the 2D similarities (Tanimoto coefficient) based on the FCFP_6 fingerprints. Then the JAK2 inhibitors and inactive compounds were processed with the “Prepare Ligands” protocol, and subsequently docked into the active site of JAK2 and evaluated by different scoring functions of LigandFit module. As shown in Fig. 2(a)–(g), all of the distributions analysis of seven docking scores (LigScore1_Dreiding, LigScore2_Dreiding, -PLP1, -PLP2, Jain, -PMF, DOCK_SCORE) for the JAK2 inhibitors and inactive compounds can distinguish them in different extent. Accordingly, the differentiating capacity of Ligscore1_Dreding is the most promising one, owing to the minimal overlaying area of the JAK2 inhibitors and inactive compounds. Furthermore, discrimination ability of these docking scores (LigScore1_Dreiding, LigScore2_Dreiding, -PLP1, -PLP2, Jain, -PMF, DOCK_SCORE) were examined by ROC curve studies (Fig. 2(h)), in similar, the Ligscore1_Dreiding is the best, with a preferable AUC (area under ROC curve) value of 0.964, when comparing with that of Ligscore2_Dreiding (0.859), -PLP1 (0.924), -PLP2 (0.901), Jain (0.924), -PMF (0.940), DOCK_SCORE (0.924).
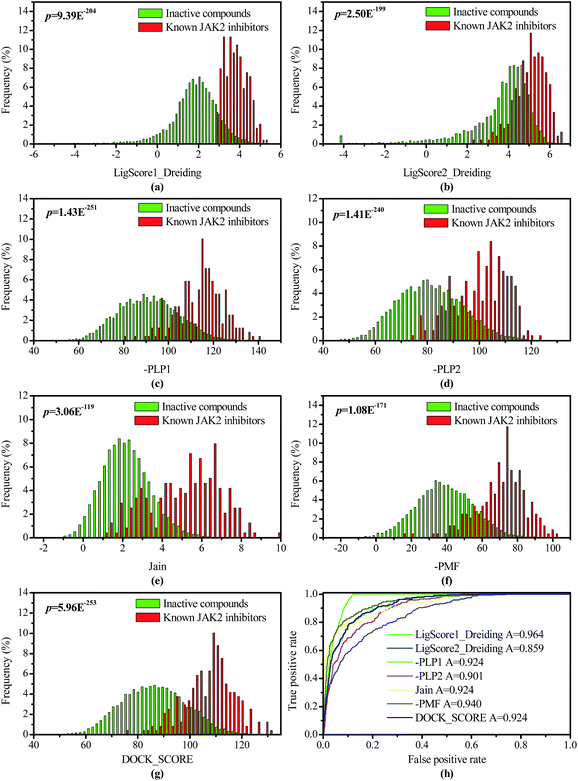 |
| | Fig. 2 The distributions and ROC curve of LigandFit docking scores to distinguish the JAK2 inhibitors from inactive compounds: (a) LigScore1_Dreiding, (b) LigScore2_Dreiding, (c) -PLP1, (d) -PLP2, (e) Jain, (f) -PMF, (g) DOCK_SCORE, (h) ROC curve of above docking scores. | |
Pharmacophore model generation and validation
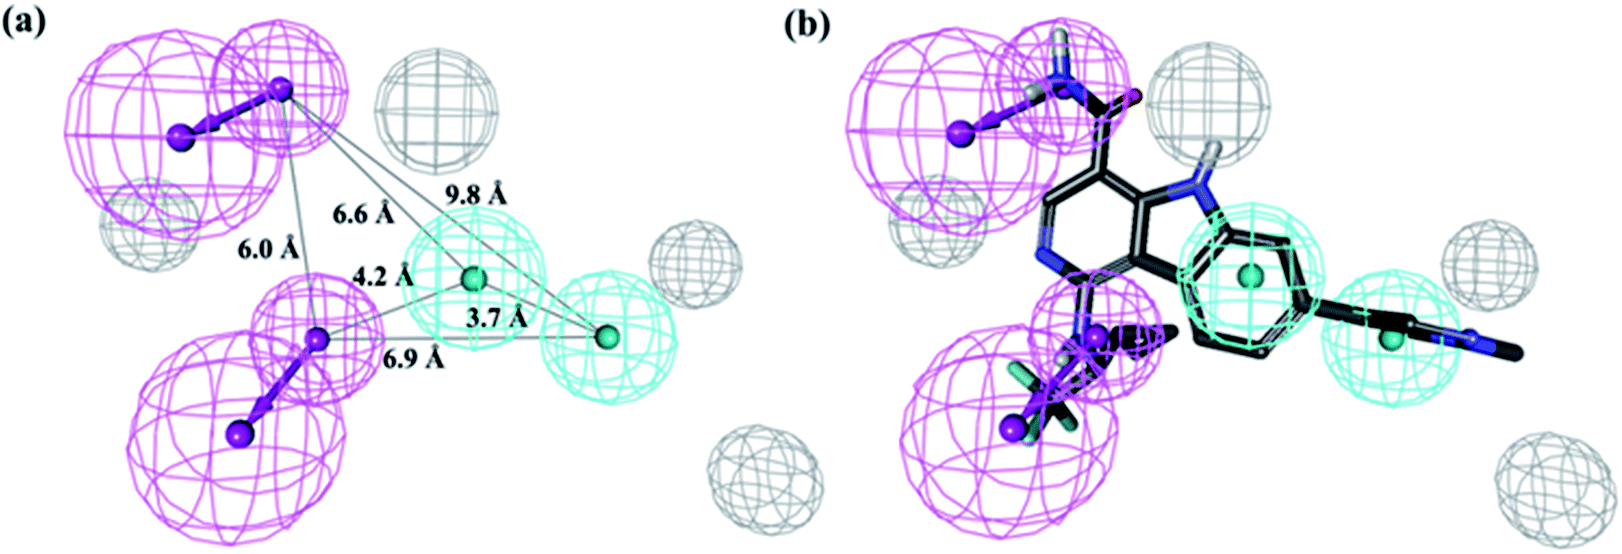
The top 10 hypotheses describing the activity of JAK2 inhibitors in training set were generated by the HypoGen algorithm. The pharmacophore composition and parameters of significance, such as cost value, correlation coefficient (r), and root mean square (RMS) deviations, can be found in the ESI Table S1.† The fixed cost (59.69 bits) of the ten best hypotheses was well separated from the null hypothesis cost (146.29 bits), indicating an over 90% statistical significance of the resultant model. The configuration cost of 15.02 bits represents the acceptable complexity of the hypotheses space. The top-ranked pharmacophore model (Hypo 1) consists of two hydrogen-bond donor (HBD), two hydrophobic groups (HY) and four excluded volumes (EV), and the geometric parameters is shown in Fig. 3(a). The developed Hypo 1 had the optimal predictive capability and statistical significance, indicated by the high correlation coefficient (r = 0.94), low RMS deviation (1.25) and cost deviation of 73.08. As shown in Fig. 3(b), the most active compound 1 (IC50 = 0.0007 μM, see Table 2) can perfectly mapped to Hypo 1.
 |
| | Fig. 3 The best pharmacophore model (Hypo 1) generated by the 3D-QSAR pharmacophore module: (a) features at a specific distance. (Features are color-coded as follows: blue, hydrophobic; magenta, hydrogen-bond donor; and dark gray, excluded volume.); (b) mapping of the most active inhibitor compound 1 (ball and stick) onto the Hypo 1 hypothesis. | |
Table 2 Actual and estimated IC50 (μM) for the test set based on the best pharmacophore hypothesis Hypo 1
| No. |
Estimated IC50 (μM) |
Actual IC50 (μM) |
Error ratio |
Ref. |
| 16 |
0.0027 |
0.0030 |
0.1000 |
19 |
| 17 |
0.0195 |
0.0230 |
0.1522 |
19 |
| 18 |
0.0427 |
0.1500 |
0.7153 |
25 |
| 19 |
0.0400 |
0.0440 |
0.0909 |
24 |
| 20 |
0.1074 |
0.0720 |
−0.4917 |
22 |
| 21 |
4.0691 |
3.9400 |
−0.0328 |
22 |
| 22 |
0.1123 |
0.3220 |
0.6512 |
21 |
| 23 |
11.4614 |
16.6000 |
0.3096 |
26 |
| 24 |
22.0345 |
16.9000 |
−0.3038 |
27 |
To validate the predictive quality of Hypo 1, we used it to estimate the activities of training set molecules. The experimental IC50 values along with predicted ones of the training set compounds are reported in Table 1. The error ratio represents the ratio of the difference value between actual and predicted activity and the actual activity. The developed Hypo 1 hypothesis mapped very well to the training set molecules, indicating the high capability of Hypo 1 to correctly predict activities. To further verify the accuracy of Hypo 1, a test set of 9 structurally diverse JAK2 inhibitors (see Fig. S2 in the ESI†) were predicted by Hypo 1 pharmacophore. According to Table 2, all the test set molecules were predicted correctly. Thus, the validated Hypo 1 pharmacophore could be applied for virtual screening to discriminate the JAK2 inhibitors from inactive compounds.
Sequential virtual screening using molecular docking and pharmacophore mapping
All the pre-treated structures in chemical SPECS database were docked and scored using LigScore1_Dreiding, the top ranked 3000 compounds were selected for further study. Then, Hypo 1 was employed to further map the key pharmacophoric features onto the structures of initially screened compounds, compounds were picked up via globally and partially pharmacophoric features for both of ligand and receptor. Then, further visual inspection was performed with respect to chemical stability, toxicity and molecular diversity. For example, the compounds with a hydrolyzable group (e.g. ester moiety) as well as electrophilic warheads (e.g. hydrazones) were excluded due to the hepatotoxicity. Finally, twelve compounds A1–A12 (see Table S2 in the ESI†) with preferable docking scores, pharmacophore mapping fit value and well drug-like properties were purchased for further studies.
In vitro biological assay for JAK2 inhibitory activities
The screened compounds A1–A12 were further evaluated for their JAK2 inhibitory activities, to our delight, three compounds showed significantly JAK2 inhibitory activities (inhibitory rate of A5: 67.67%, A6: 28.00%, A9: 31.26%) at a concentration of 20 μg mL−1 (Fig. 4). Among them, compound A5 bearing diaminopyrimidine moiety showed the best JAK2 inhibitory activities with IC50 value of 4.64 μg mL−1. As a result, the hit rate in our sequential virtual screening process for identification of JAK2 inhibitors is 33.33%, showing significantly superior performance in the identification of novel JAK2 inhibitors when comparing with that of conventional high throughput screening (HTS) strategy.31 Moreover, A6 bearing aminothiazole moiety is significantly different from the reported JAK2 inhibitors in literatures, which is very interesting for us in further development of novel JAK2 inhibitors.
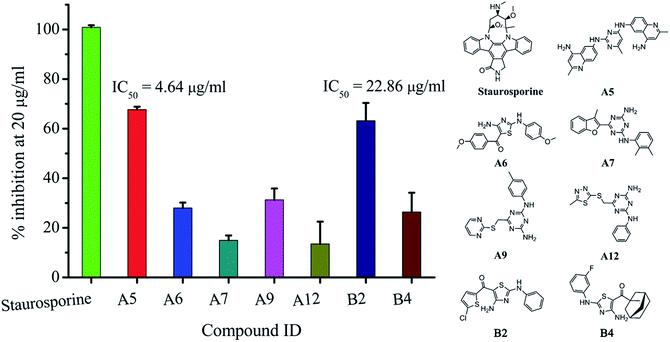 |
| | Fig. 4 Comparison of JAK2 inhibitory abilities of hits (A5, A6, A7, A9, A12, B2 and B4) and staurosporine at the concentration of 20 μg mL−1. | |
Similarity search for other structurally analogical JAK2 inhibitors
To detect analogues of the sequential VS hits, similarity search using the core structures of potent hits (A5, A6 and A9) as queries through the drug-like dataset was performed. As a result, 158 analogues were enriched and further evaluated in combination of molecular docking and pharmacophore mapping, finally, five compounds B1–B5 (see Table S2 in the ESI†) were identified and subjected to the JAK2 inhibition test. To be of interest, two compounds showed moderate JAK2 inhibitory activities (inhibitory rate of B2: 63.18%, B4: 26.40%) at a concentration of 20 μg mL−1. To be of interest, we identified another compound B2 with the promising skeleton (aminothiazole), which exhibited potent JAK2 inhibitory activity (IC50: 22.86 μg mL−1) (Fig. 4).
Selectivity profiles of JAK kinase inhibitory activities
Then, two compounds A5 and B2 were sent to analyze their selectivity profiles of JAK kinase inhibitory activities, including JAK1, JAK2, and JAK3 (Table 3). To be of interest, compound A5 also shows good inhibitory activities against JAK1 and JAK3 with IC50 value of 1.18 and 0.293 μg mL−1, respectively, which were even better than that of JAK2 (4.64 μg mL−1). Thus, compound A5 would be a promising lead compound in structural optimization as a novel selective JAK3 inhibitor. In addition, compound B2 showed more selective inhibitory activity against JAK2, which showed no activity against JAK1 and JAK3 at even very high concentration (100 μg mL−1).
Table 3 The inhibitory activities of compounds A5 and B2 against JAKs
| Compd. |
IC50 (μg mL−1) |
| JAK1 |
JAK2 |
JAK3 |
| A5 |
1.18 |
4.64 |
0.293 |
| B2 |
>100 |
22.86 |
>100 |
In vitro antiproliferative assay against cancer cells
Considering the novelty of the skeleton and the selective profiles (JAK2) of compound B2, it was further biologically evaluated for its further anticancer activities, involving with antiproliferative effect against acquired gefitinib-resistant human lung cancer cell (H1975), human pancreatic carcinoma (PANC-1) and human lung cancer cell line (PC-9). As shown in Fig. 5, compound B2 exhibited significantly antiproliferative activity against all of these cancer cell lines, with IC50 value of 18.1, 58.3, 40.6 μg mL−1 against PC-9, H1975 and PANC-1, respectively.
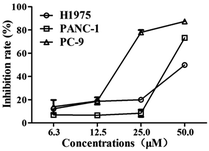 |
| | Fig. 5 Anti-proliferative activities of compound B2 against cancer cell H1975, PANC-1 and PC-9. | |
Insight into the binding of A5 and B2 to JAK2
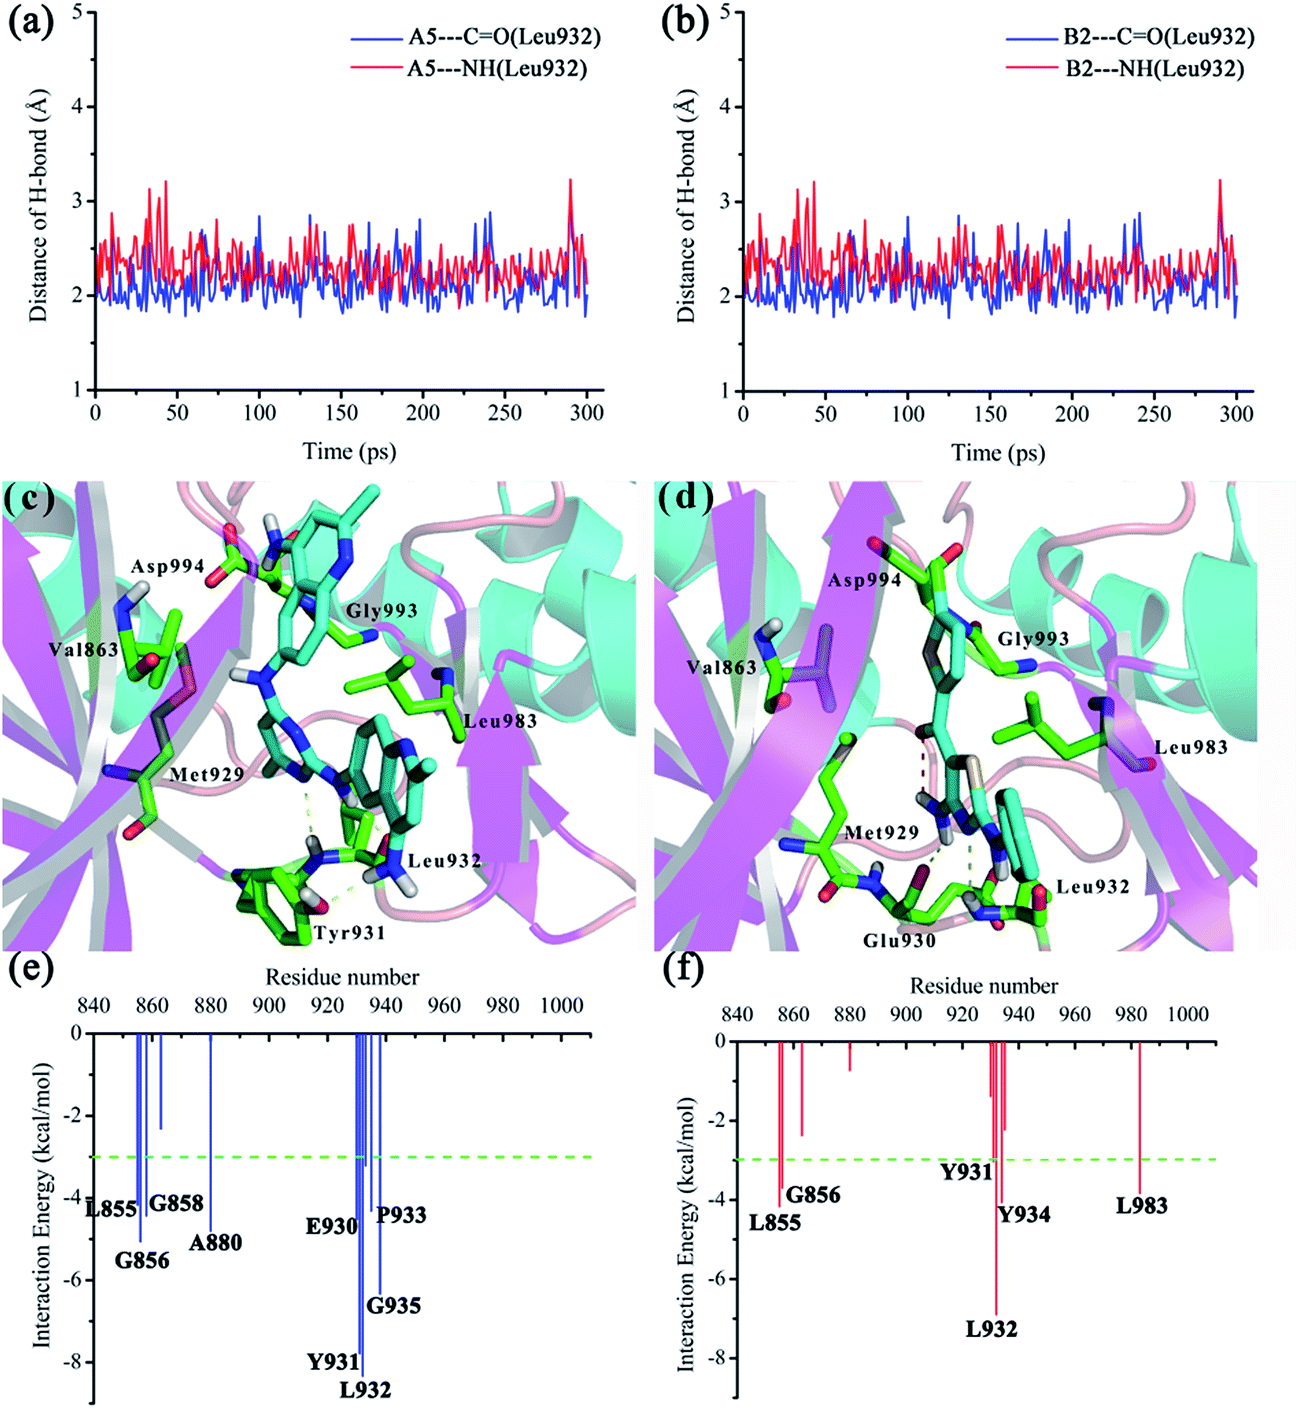
In order to investigate the interaction mode between the preferable compounds A5 and B2 and JAK2 protein, molecular dynamics (MD) simulations and interaction decomposition analysis were carried out to explore the quantitative energy contributions per-residue to the binding affinity of two promising inhibitors (A5 and B2). After 200 ps production simulation, distance between inhibitors (A5 and B2) and key amino acid Leu932 of JAK2 trends to converge, indicating that the system reached equilibrium conditions (see Fig. 6(a) and (b)). Based on the stable conformation obtained from MD simulation, interactions involved in the protein/ligand complex were analyzed. As shown in Fig. 6(c) and (d), the ![[double bond, length as m-dash]](https://www.rsc.org/images/entities/char_e001.gif) NH and N moieties of aminopyrimidine (A5) aminothiazole (B2) core could form two H-bonds with hinge residue Leu932 of ATP-binding pocket, which accounts for a significant proportion of their potency. In accordance with the interaction energy decomposition, the contribution of Leu932 for A5 and B2 is −8.33 and −6.89 kcal mol−1, respectively (see Fig. 6(e) and (f)). Besides, the NH2 bearing on the right 2-methylquinolin moiety of A5 also forms H-bond with the Tyr931, while the NH2 group bearing on the thiazole core of B2 forms an additional H-bond with Glu930. The C5-methyl of pyrimidine core (A5) and the C5-amino of thiazole skeleton (B2) were stacked against the gatekeeper residue Met929. For the selective JAK2 inhibitor B2, an intramolecular hydrogen bond was formed, holding the chlorothiophene substituent coplanar with the aminothiazole core. Thus, the chlorothiophene moiety was found to be located in the binding pocket adjacent to Val863 and Leu983, and extended towards the Asp994 of activation loop and the Gly993 of glycine-rich loop. This orientation may confer to the high selectivity of B2 over the other JAK family kinases.32 Therefore, according to the binding pattern and chemical structure of A5 and B2, we speculate that an aromatic scaffold containing hydrogen-donors and receptors, and a substituent extending towards the activation loop and glycine-rich loop may be an important pharmacophore feature of JAK2 inhibitors.
NH and N moieties of aminopyrimidine (A5) aminothiazole (B2) core could form two H-bonds with hinge residue Leu932 of ATP-binding pocket, which accounts for a significant proportion of their potency. In accordance with the interaction energy decomposition, the contribution of Leu932 for A5 and B2 is −8.33 and −6.89 kcal mol−1, respectively (see Fig. 6(e) and (f)). Besides, the NH2 bearing on the right 2-methylquinolin moiety of A5 also forms H-bond with the Tyr931, while the NH2 group bearing on the thiazole core of B2 forms an additional H-bond with Glu930. The C5-methyl of pyrimidine core (A5) and the C5-amino of thiazole skeleton (B2) were stacked against the gatekeeper residue Met929. For the selective JAK2 inhibitor B2, an intramolecular hydrogen bond was formed, holding the chlorothiophene substituent coplanar with the aminothiazole core. Thus, the chlorothiophene moiety was found to be located in the binding pocket adjacent to Val863 and Leu983, and extended towards the Asp994 of activation loop and the Gly993 of glycine-rich loop. This orientation may confer to the high selectivity of B2 over the other JAK family kinases.32 Therefore, according to the binding pattern and chemical structure of A5 and B2, we speculate that an aromatic scaffold containing hydrogen-donors and receptors, and a substituent extending towards the activation loop and glycine-rich loop may be an important pharmacophore feature of JAK2 inhibitors.
 |
| | Fig. 6 MD simulations and interaction mechanism analysis for the most potent inhibitors: (a) and (b) plot the distances of H-bond between Leu932 and A5 and B2 during 200 ps of MD simulation; (c) and (d) plot the binding pattern of A5 and B2; (e) and (f) plot the inhibitor–residue interaction spectrum for A5 and B2, respectively. | |
Conclusions
Herein, a reasonable and reliable sequential VS protocol by integrating the prediction results of structure-based molecular docking and ligand-based pharmacophore model was successfully constructed to identify potent JAK2 inhibitors. With the sequential virtual screen workflow in hand, twelve novel and structurally diverse hits were obtained and subjected to in vitro biological test, and three compounds (A5, A6 and A9) with potent JAK2 inhibitory activity were discovered. In pursuit of more JAK2 inhibitors efficiently, the obtained structures were further used as the template for subsequent similarity search, leading to the identification of another two promising compounds (B2 and B4). Moreover, selectivity profiles of two compounds A5 and B2 against JAK kinase was studied, revealing that these compounds bearing two different skeletons show different JAK subtype inhibitory activities. The compound B2 with a novel aminothiazole skeleton and better JAK2 inhibitory selectivity was further demonstrated for its anti-proliferative effect against cancer cells with micromolar IC50, suggesting that it would be a good lead to do further structure-activity research to find more high potent JAK2 selective inhibitors. Finally, binding patterns of the two most potent JAK2 inhibitors (A5 and B2) were explored by molecular docking, MD simulations, and interaction energy decomposition analysis. The novel intramolecular hydrogen bond of B2 and its favourable orientation towards the activation loop and glycine-rich loop of JAK2 may confer to its high specificity over the other JAK family kinases, providing computational clue for structurally optimization of the lead compounds.
Acknowledgements
This study was financially supported by Natural Science Foundation of Zhejiang Province, China (LY15C140002, LY13H300002) and Science and Technology Planning Project of Zhejiang Province (2015C32061).
Notes and references
- K. Yamaoka, P. Saharinen, M. Pesu, V. E. T. Holt, O. Silvennoinen and J. J. O'Shea, Genome Biol., 2004, 5, 253 CrossRef PubMed.
- L. L. C. Marotta, V. Almendro, A. Marusyk, M. Shipitsin, J. Schemme, S. R. Walker, N. Bloushtain-Qimron, J. J. Kim, S. A. Choudhury, R. Maruyama, Z. Wu, M. Gonen, L. A. Mulvey, M. O. Bessarabova, S. J. Huh, S. J. Silver, S. Y. Kim, S. Y. Park, H. E. Lee, K. S. Anderson, A. L. Richardson, T. Nikolskaya, Y. Nikolsky, X. S. Liu, D. E. Root, W. C. Hahn, D. A. Frank and K. Polyak, J. Clin. Invest., 2011, 121, 2723–2735 CAS.
- R. L. Levine, M. Wadleigh, J. Cools, B. L. Ebert, G. Wernig, B. J. P. Huntly, T. J. Boggon, L. Wlodarska, J. J. Clark, S. Moore, J. Adelsperger, S. Koo, J. C. Lee, S. Gabriel, T. Mercher, A. D'Andrea, S. Frohling, K. Dohner, P. Marynen, P. Vandenberghe, R. A. Mesa, A. Tefferi, J. D. Griffin, M. J. Eck, W. R. Sellers, M. Meyerson, T. R. Golub, S. J. Lee and D. G. Gilliland, Cancer Cell, 2005, 7, 387–397 CrossRef CAS PubMed.
- C. James, V. Ugo, J. P. Le Couedic, J. Staerk, F. Delhommeau, C. Lacout, L. Garcon, H. Raslova, R. Berger, A. Bennaceur-Griscelli, J. L. Villeval, S. N. Constantinescu, N. Casadevall and W. Vainchenker, Nature, 2005, 434, 1144–1148 CrossRef CAS PubMed.
- E. J. Baxter, L. M. Scott and P. J. Campbell, Lancet, 2005, 366, 122 Search PubMed.
- A. Verma, S. Kambhampati, S. Parmar and L. C. Platanias, Cancer Metastasis Rev., 2003, 22, 423–434 CrossRef CAS PubMed.
- S. W. Lane and A. Mullally, Blood, 2014, 124, 2898–2900 CrossRef CAS PubMed.
- F. P. S. Santos, H. M. Kantarjian, N. Jain, T. Manshouri, D. A. Thomas, G. Garcia-Manero, D. Kennedy, Z. Estrov, J. Cortes and S. Verstovsek, Blood, 2010, 115, 1131–1136 CrossRef CAS PubMed.
- T. Manshouri, A. Quintas-Cardama, R. H. Nussenzveig, A. Gaikwad, Z. Estrov, J. Prchal, J. E. Cortes, H. M. Kantarjian and S. Verstovsek, Cancer Sci., 2008, 99, 1265–1273 CrossRef CAS PubMed.
- J. W. Tyner, T. G. Bumm, J. Deininger, L. Wood, K. J. Aichberger, M. M. Loriaux, B. J. Druker, C. J. Burns, E. Fantino and M. W. Deininger, Blood, 2010, 115, 5232–5240 CrossRef CAS PubMed.
- H. Ha, B. Debnath, S. Odde, T. Bensman, H. Ho, P. M. Beringer and N. Neamati, J. Chem. Inf. Model., 2015, 55, 1720–1738 CrossRef CAS PubMed.
- A. Vuorinen, R. Engeli, A. Meyer, F. Bachmann, U. J. Griesser, D. Schuster and A. Odermatt, J. Med. Chem., 2014, 57, 5995–6007 CrossRef CAS PubMed.
- Y. Xu, X. Liu, Y. L. Wang, N. N. Zhou, J. L. Peng, L. K. Gong, J. Ren, C. Luo, X. M. Luo, H. L. Jiang, K. X. Chen and M. Y. Zheng, Sci. Rep., 2015, 5, 13684–13696 CrossRef PubMed.
- A. Agarwal, S. Paliwal, R. Mishra, S. Sharma, A. K. Dwivedi, R. Tripathi and S. Gunjan, Sci. Rep., 2015, 5, 13838–13845 CrossRef PubMed.
- S. Saxena, S. S. Chaudhaery, K. Varshney and A. K. Saxena, SAR QSAR Environ. Res., 2010, 21, 445–462 CrossRef CAS PubMed.
- S. Sakkiah, S. Thangapandian, S. John and K. W. Lee, Eur. J. Med. Chem., 2011, 46, 2937–2947 CrossRef CAS PubMed.
- T. T. Yao, J. L. Cheng, B. R. Xu, M. Z. Zhang, Y. Z. Hu, J. H. Zhao and X. W. Dong, RSC Adv., 2015, 5, 49195–49203 RSC.
- C. M. Venkatachalam, X. Jiang, T. Oldfield and M. Waldman, J. Mol. Graphics Modell., 2003, 21, 289–307 CrossRef CAS PubMed.
- J. Lim, B. Taoka, R. D. Otte, K. Spencer, C. J. Dinsmore, M. D. Altman, G. Chan, C. Rosenstein, S. Sharma, H. P. Su, A. A. Szewczak, L. Xu, H. Yin, J. Zugay-Murphy, C. G. Marshall and J. R. Young, J. Med. Chem., 2011, 54, 7334–7349 CrossRef CAS PubMed.
- J. J. Chen, K. D. Thakur, M. P. Clark, S. K. Laughlin, K. M. George, R. G. Bookland, J. R. Davis, E. J. Cabrera, V. Easwaran, B. De and Y. G. Zhang, Bioorg. Med. Chem. Lett., 2006, 16, 5633–5638 CrossRef CAS PubMed.
- C. J. Burns, D. G. Bourke, L. Andrau, X. Y. Bu, S. A. Charman, A. C. Donohue, E. Fantino, M. Farrugia, J. T. Feutrill, M. Joffe, M. R. Kling, M. Kurek, T. L. Nero, T. Nguyen, J. T. Palmer, I. Phillips, D. M. Shackleford, H. Sikanyika, M. Styles, S. Su, H. Treutlein, J. Zeng and A. F. Wilks, Bioorg. Med. Chem. Lett., 2009, 19, 5887–5892 CrossRef CAS PubMed.
- L. B. Schenkel, X. Huang, A. Cheng, H. L. Deak, E. Doherty, R. Emkey, Y. Gu, H. Gunaydin, J. L. Kim, J. Lee, R. Loberg, P. Olivieri, J. Pistillo, J. Tang, Q. Wan, H. L. Wang, S. W. Wang, M. C. Wells, B. Wu, V. Yu, L. Q. Liu and S. Geuns-Meyer, J. Med. Chem., 2011, 54, 8440–8450 CrossRef CAS PubMed.
- M. Soth, J. C. Hermann, C. Yee, M. Alam, J. W. Barnett, P. Berry, M. F. Browner, K. Frank, S. Frauchiger, S. Harris, Y. He, M. Hekmat-Nejad, T. Hendricks, R. Henningsen, R. Hilgenkamp, H. Ho, A. Hoffman, P. Y. Hsu, D. Q. Hu, A. Itano, S. Jaime-Figueroa, A. Jahangir, S. Jin, A. Kuglstatter, A. K. Kutach, C. Liao, S. Lynch, J. Menke, L. H. Niu, V. Patel, A. Railkar, D. Roy, A. Shao, D. Shaw, S. Steiner, Y. L. Sun, S. L. Tan, S. Wang and M. D. Vu, J. Med. Chem., 2013, 56, 345–356 CrossRef CAS PubMed.
- A. D. William, A. C. H. Lee, S. Blanchard, A. Poulsen, E. L. Teo, H. Nagaraj, E. Tan, D. Z. Chen, M. Williams, E. T. Sun, K. C. Goh, W. C. Ong, S. K. Goh, S. Hart, R. Jayaraman, M. K. Pasha, K. Ethirajulu, J. M. Wood and B. W. Dymock, J. Med. Chem., 2011, 54, 4638–4658 CrossRef CAS PubMed.
- M. Gerspacher, P. Furet, C. Pissot-Soldermann, C. Gaul, P. Holzer, E. Vangrevelinghe, M. Lang, D. Erdmann, T. Radimerski, C. H. Regnier, P. Chene, A. De Pover, F. Hofmann, F. Baffert, T. Buhl, R. Aichholz, F. Blasco, R. Endres, J. Trappe and P. Drueckes, Bioorg. Med. Chem. Lett., 2010, 20, 1724–1727 CrossRef CAS PubMed.
- V. M. Shahani, D. P. Ball, A. V. Ramos, Z. H. Li, P. A. Spagnuolo, S. Haftchenary, A. D. Schimmer, S. Trudel and P. T. Gunning, Bioorg. Med. Chem., 2013, 21, 5618–5628 CrossRef CAS PubMed.
- P. J. Slavish, Q. Jiang, X. L. Cui, S. W. Morris and T. R. Webb, Bioorg. Med. Chem., 2009, 17, 3308–3316 CrossRef PubMed.
- J. Li, T. Ehlers, J. Sutter, S. Varma-O'Brien and J. Kirchmair, J. Chem. Inf. Model., 2007, 47, 1923–1932 CrossRef CAS PubMed.
- H. H. Wan, G. M. Schroeder, A. C. Hart, J. Inghrim, J. Grebinski, J. S. Tokarski, M. V. Lorenz, D. You, T. McDevie, B. Penhallow, R. Vuppugalla, Y. P. Zhang, X. M. Gu, R. Iyer, L. J. Lombardo, G. L. Trainor, S. Ruepp, J. Lippy, Y. Blat, J. S. Sack, J. A. Khan, K. Stefanski, B. Sleczka, A. Mathur, J. H. Sun, M. K. Wong, D. R. Wu, P. Li, A. Gupta, P. N. Arunachalam, B. Pragalathan, S. Narayanan, K. C. Nanjundaswamy, P. Kuppusamy and A. V. Purandare, ACS Med. Chem. Lett., 2015, 6, 850–855 CrossRef CAS PubMed.
- T. Q. Liu, Y. M. Lin, X. Wen, R. N. Jorissen and M. K. Gilson, Nucleic Acids Res., 2007, 35, 198–201 CrossRef PubMed.
- M. A. Blaskovich, J. Z. Sun, A. Cantor, J. Turkson, R. Jove and S. M. Sebti, Cancer Res., 2003, 63, 1270–1279 CAS.
- M. W. Ledeboer, A. C. Pierce, J. P. Duffy, H. Gao, D. Messersmith, F. G. Salituro, S. Nanthakumar, J. Come, H. J. Zuccola, L. Swenson, D. Shlyakter, S. Mahajan, T. Hoock, B. Fan, W.-J. Tsai, E. Kolaczkowski, S. Carrier, J. K. Hogan, R. Zessis, S. Pazhanisamy and Y. L. Bennani, Bioorg. Med. Chem. Lett., 2009, 19, 6529–6533 CrossRef CAS PubMed.
Footnotes |
| † Electronic supplementary information (ESI) available: Fig. S1, S2 and Tables S1–S3. See DOI: 10.1039/c6ra24959k |
| ‡ These authors contributed equally to this work. |
|
| This journal is © The Royal Society of Chemistry 2017 |
Click here to see how this site uses Cookies. View our privacy policy here. 
 Open Access Article
 This Open Access Article is licensed under a
  *a
*a