 Open Access Article
Nanostructured biogel templated synthesis of Fe3O4 nanoparticles and its application for catalytic degradation of xylenol orange
Ya-Nan Chen,
Tianqi Liu,
Qin Zhang,
Cong Shang and
Huiliang Wang *
*
Beijing Key Laboratory of Energy Conversion and Storage Materials, College of Chemistry, Beijing Normal University, Beijing, 100875, P. R. China. E-mail: wanghl@bnu.edu.cn
First published on 3rd January 2017
Abstract
Easy preparation of well-dispersed inorganic nanoparticles is critical for their practical applications. By using jellyfish mesoglea, a biological hydrogel mainly composed of nanofibers, as a template, nanocomposite hydrogels with well-dispersed Fe3O4 nanoparticles are successfully synthesized through the co-precipitation method. Fe3O4 nanoparticles, mostly less than 20 nm, are uniformly formed and distributed on the nanofibers. With the increase of Fe2+/Fe3+ concentration, more nanoparticles are formed and hence the size of the nanofibers increases, and only very less significant aggregation of Fe3O4 nanoparticles is observed at a high Fe2+/Fe3+ concentration of 1 M. The JF/Fe3O4 nanocomposite hydrogels have very high Fe3O4 content, which can achieve about 79%. The nanocomposite hydrogels display nearly superparamagnetism, and show smaller saturation magnetizations (Ms) than that of bulk Fe3O4. Moreover, introduction of Fe3O4 nanoparticles increases the BET surface areas of the gels. The JF/Fe3O4 nanocomposite hydrogels exhibit high activity in catalyzing the oxidative degradation of xylenol orange and excellent reusability.
Introduction
Magnetic nanomaterials have widespread applications in drug release, hyperthermia, sensors, supercapacitors, adsorption, and catalysis.1–6 The application of magnetic nanoparticles in catalysis has drawn rapidly growing attention due to their easy preparation, high catalytic efficiency, excellent reusability, and convenient separation from the reaction solutions by an external magnetic field.7 Various kinds of magnetic nanoparticles, such as MgCr2O4, MnxFe1−xO and Fe3O4 nanoparticles, have been applied to catalyze the oxidative or photo degradation of pollutants in water, such as dyes, phenols, and bacteria.6,8–10Fe3O4 nanoparticles are the most commonly used magnetic nanomaterials, and they are usually prepared through thermal decomposition, solvothermal reaction, co-precipitation and so on.11–14 However, due to their inherent magnetic interactions and high surface energies, the aggregation of Fe3O4 nanoparticles is inevitable in many cases, which leads to their wide size distributions, small surface areas, and hence low catalytic efficiencies.15,16 To prevent the aggregation of Fe3O4 nanoparticles, inorganic porous materials (e.g. alumina, silica and activated carbon) and macromolecular microspheres are commonly employed as the templates for the formation of Fe3O4 nanoparticles.17–20 In addition, surfactants, capping agents, and chelating agents are also widely applied to increase the stability and activity.21–23
Hydrogels are three-dimensional polymeric networks containing a large portion of water. The polymeric networks can serve as ideal matrices for the formation of uniformly distributed Fe3O4 nanoparticles.24 The incorporation of Fe3O4 nanoparticles into the hydrophilic gel network also facilitates the application of Fe3O4 nanoparticles in catalyzing the degradation of water pollutants.6 Till now, several types of hydrogels with Fe3O4 nanoparticles have been reported. Fe3O4 nanoparticles can be introduced into the hydrogels before or after the gelation process25–31 or simultaneously.6,32
However, most synthetic hydrogels are structurally inhomogeneous, and they generally show porous structures with continuous and dense pore walls (in the freeze-dried state), which impede the fast diffusion and exchange of masses between the hydrogels and the environment. The continuous and dense pore walls also lead to the low specific surface areas of the hydrogels, and hence severe aggregation of Fe3O4 nanoparticles is also observed in the hydrogels when the content of Fe3O4 nanoparticles is sufficiently high. Moreover, if the Fe3O4 nanoparticles are incorporated before or in the gelation process, then a large portion of them might be imbedded in the dense pore walls, and hence their performance is strongly impeded.
Hydrogels constructed of nanofibers and/or nanosheets should have very high specific surface areas, and hence provide more active sites for forming Fe3O4 nanoparticles. Unfortunately, the fabrication of nanostructured hydrogels remains a challenge. Only very few such hydrogels have been reported, and the nanowires are usually made with template polymerization,33,34 electrospinning,35 and self-assembly.36 Our group recently reported a novel directional freezing and γ-radiation initiated polymerization method for synthesizing hydrogels with aligned nanowires.37 These methods are commonly very complex and time-consuming.
Thanks to their well-developed structures, biological hydrogels exhibit superior properties than synthetic hydrogels. Jellyfish mesoglea (hereafter shortened as JF gel) is a biological hydrogel mainly composed of nanofibers and nanosheets.38,39 Macropores in micrometers and meshes in submicrons are constructed by the nanofibers and nanosheets. The unique nanostructured microstructure endows JF gel with good mechanical properties even at an extremely high water content of 97–99%.40,41 Taking advantage of the JF gel's nanostructured porous structure, extremely high-content dendritic silver nanoparticles have been prepared by our group.42 This novel biogel templated metal nanoparticle production method is very simple, cheap and high efficient, and it should be applicable for preparing other types of nanoparticles.
In this work, we used JF gel as a template to prepare Fe3O4 nanoparticles through co-precipitation. In addition, the application of the JF/Fe3O4 nanocomposite hydrogels in catalysis was demonstrated by catalyzing the oxidative degradation of xylenol orange. The Fe3O4 nanoparticles in the composite hydrogels exhibited high catalytic activity and excellent reusability.
Experimental
Materials
The edible jellyfish umbrella was purchased from seafood market, which was preserved with a mixture of table salt and alum. The inner part of the jellyfish mesoglea was cut from the jellyfish umbrella, and then it was firstly washed with tap-water and then washed with deionized water for 72 h to thoroughly remove the salts. Ferric chloride hexahydrate (FeCl3·6H2O, analytical grade) and ferrous sulfate heptahydrate (FeSO4·7H2O, 98%) were purchased from Shanghai Macklin Biochemical Co. Ltd. (Shanghai, China) and Alfa Aesar (Shanghai, China) chemicals Co. Ltd., respectively. Hydrochloric acid (HCl), ammonia water (NH3·H2O), nitric acid (HNO3) and hydrogen peroxide (H2O2) were analytical grade from Beijing Chemical Works (Beijing, China), and xylenol orange tetrasodium salt (C31H28N2O13SNa4, analytical grade) was from Tianjin Jinke Fine Chemical Institute (Tianjin, China). All chemicals were used without further purification.Preparation of JF/Fe3O4 nanocomposite hydrogels
The swollen jellyfish mesoglea was cut into specimens with a size of 20 mm × 20 mm × 5 mm. The samples were dipped in a mixture of 25 mL FeSO4 and 50 mL FeCl3 (0.03 mol HCl added to prevent hydrolysis) with different original Fe2+ or Fe3+ concentrations (0.05, 0.1, 0.5 and 1.0 M) for 6 h (the Fe2+/Fe3+ solution was changed after 3 h). Then the samples were put into a NH3·H2O solution for 12 h to ensure the full reaction. The dipping process and the reactions were carried out in a nitrogen atmosphere. Finally, the samples were thoroughly washed with deionized water to remove unreacted chemicals.Characterization
X-ray diffraction patterns were recorded using a PANalytical-X' Pert PRO diffractometer (Cu radiation, λ = 1.5418 Å) running at 40 kV and 40 mA (PANalytical, Holland). X-ray photoelectron spectroscopy (XPS) was carried out on a LabRAM Aramis instrument (Horiba Jobin Yvon, France). Raman spectroscopy was performed on an ESCALAB 250Xi spectrometer (Thermofisher, UK) at room temperature.ICP-AES analysis
The Fe3O4 nanoparticles in the composite hydrogels were reacted with concentrated HNO3 to form water-soluble Fe(NO3)3, and then the diluted aqueous Fe(NO3)3 solutions were measured by inductively coupled plasma atomic emission spectroscopy (ICP-AES) on a SPECTRO ARCOS EOP instrument (SPECTRO Analytical Instruments GmbH, Germany). The contents of Fe3O4 in the solutions after the catalytic reactions were also measured with ICP-AES.Superparamagnetism measurement
Magnetic properties of the products were investigated using a Superconducting Quantum Interference Device (SQUID, MPMS XL7, Quantum Design, USA) at room temperature.Scanning electron microscopy (SEM) investigation
The samples were firstly frozen by rapidly plunging into liquid nitrogen for about 5 min, and then the frozen samples were freeze-dried in a LGJ-10C vacuum freeze dryer (Beijing Sihuan Scientific Instrument Factory, China) for about 24 h to remove water thoroughly. The freshly cracked surfaces of the freeze-dried samples were analyzed with a Hitachi S-4800 scanning electron microscope (Tokyo, Japan) with an accelerating voltage of 10 kV.BET surface area analysis
The Brunauer–Emmett–Teller (BET) specific surface areas of the gel samples cracked into small lumps were evaluated on the basis of nitrogen adsorption isotherms using a Quantachrome NOVA 2000e sorption analyzer (Quantachrome, USA) at liquid nitrogen temperature.Catalysis degradation of xylenol orange tetrasodium salt (XO)
For the catalysis degradation of XO, XO aqueous solution (1 × 10⁻⁴ M) was freshly prepared. In 10 mL XO solution, 10 mL H2O2 aqueous solution (30%) was added. One JF/Fe3O4 nanocomposite hydrogel sample, cut into eight pieces, was used for the catalysis degradation reaction carried out at ambient temperature under magnetic agitation. A Shimadzu UV-2450 spectrophotometer (Shimadzu, Japan) was employed to monitor the progress in a scanning range of 300–600 nm. With a time gradient of every 5 min, a series of UV spectra were obtained.Results and discussion
Preparation of JF/Fe3O4 nanocomposite hydrogels
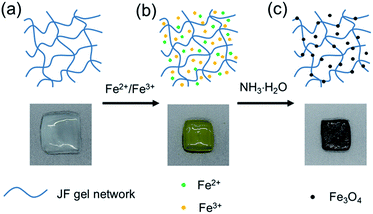
JF/Fe3O4 nanocomposite hydrogels were prepared with the co-precipitation method. Firstly, JF gels (Fig. 1a) were dipped in the aqueous solutions containing both Fe2+ and Fe3+, and in which the molar ratio of Fe2+ to Fe3+ is 1/2. After then, the JF gels with Fe2+ and Fe3+ (Fig. 1b) were soaked into a NH3·H2O solution. The semitransparent JF gels became black in about 20 min (Fig. 1c), indicating the formation of Fe3O4 in the gels, and hence JF/Fe3O4 nanocomposite hydrogels were obtained.Morphologies of Fe3O4 nanoparticles
The morphologies of an original JF gel and the JF/Fe3O4 nanocomposite hydrogels are displayed in Fig. 2. The original JF gel is mainly composed of smooth nanofibers with an average diameter of about 35 nm (Fig. 2a). When Fe3O4 is introduced into the JF gels, the surface of the nanofibers becomes rough and is covered with many nanoparticles (Fig. 2b–d). With the increase of Fe2+/Fe3+ concentration, more nanoparticles are formed on the fibers and hence the size of the nanofibers increases. When the Fe2+/Fe3+ concentration is increased to 1.0 M, adjacent fibers can even be merged to form larger fibers or sheets with a diameter or width up to several hundred nanometers due to the aggregation of the nanoparticles (Fig. 2d). The sizes of the nanoparticles are quite uniform, and they are mostly less than 20 nm, though very less significant aggregation of the nanoparticles is observed at a high Fe2+/Fe3+ concentration. In short, the nanofibers in JF gel act as templates for the formation of nanoparticles.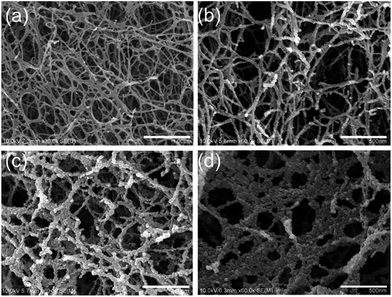 | ||
| Fig. 2 SEM images of an original JF gel (a) and the JF/Fe3O4 nanocomposite hydrogels prepared at the Fe2+/Fe3+ concentrations of 0.1 M (b), 0.5 M (c) and 1.0 M (d). | ||
Characterization of Fe3O4 nanoparticles
To confirm that the nanoparticles formed in the JF gels are Fe3O4, the dried composite hydrogels were firstly measured with XRD. As shown in Fig. 3, the (220) (311) (400) (422) (511) and (440) planes of Fe3O4 were observed at 2θ = 30.20°, 35.51°, 43.13°, 53.66°, 57.16° and 62.90°, respectively, which are consistent with JCPDS 19-629 (JCPDS: Joint Committee on Powder Diffraction Standards).43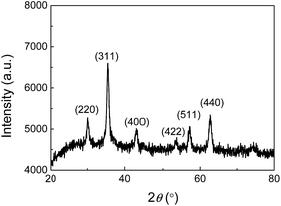 | ||
| Fig. 3 X-ray diffraction pattern of the JF/Fe3O4 nanocomposite hydrogel prepared at a Fe2+/Fe3+ concentration of 0.5 M. | ||
It is well-known that the XRD patterns of Fe3O4 and γ-Fe2O3 are very similar, so the XRD pattern cannot provide enough evidence to rule out γ-Fe2O3.44 Therefore, XPS and Raman spectra were both recorded to distinguish Fe3O4 from γ-Fe2O3. XPS is very sensitive to Fe2+ and Fe3+ ions. Fig. 4a shows the core-level XPS patterns of a JF/Fe3O4 nanocomposite hydrogel in the Fe 2p region. The peaks at binding energies of 710.3 and 724.1 eV are the characteristic doublet of Fe 2p3/2 and Fe 2p1/2 core-level spectra of Fe3O4, respectively. While the typical satellite peak at around 719.2 eV attributed to γ-Fe2O3 does not appear, excluding the presence of γ-Fe2O3 in the JF/Fe3O4 nanocomposite hydrogel.45 Fig. 4b shows the Raman spectrum of the JF/Fe3O4 nanocomposite hydrogel. Four main peaks at the wavenumbers of 276, 390, 587 and 1288 cm−1 are almost identical to those reported for Fe3O4 powder, and no peaks at around 1430 and 1580 cm−1 attributed to γ-Fe2O3 are observed.7 These characterizations substantially prove that the nanoparticles formed are Fe3O4.
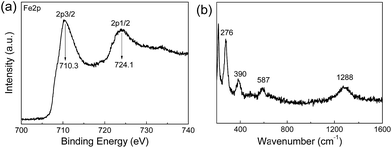 | ||
| Fig. 4 Fe 2p core-level XPS spectrum (a) and Raman spectrum (b) of a JF/Fe3O4 nanocomposite hydrogel prepared at a Fe2+/Fe3+ concentration of 0.5 M. | ||
The contents of Fe3O4 nanoparticles in the composite gels measured with ICP-AES are shown in Fig. 5. The composite gels generally have very high Fe3O4 contents, from 32% at a very low Fe2+/Fe3+ concentration of 0.05 M to the highest value of 79% at 1.0 M Fe2+/Fe3+ concentration. The high Fe3O4 content in the composite gels is attributed to the extremely low solid content of JF gel (1–3 wt%) and the nanostructured macroporous structures that facilitate the migration of Fe2+/Fe3+ ions and the formation of Fe3O4 nanoparticles. It is noticeable that the increase of Fe3O4 content with increasing Fe2+/Fe3+ concentration becomes much slower at a higher concentration. The possible reason is the decrease of active sites on the nanofibers after the formation of some nanoparticles.
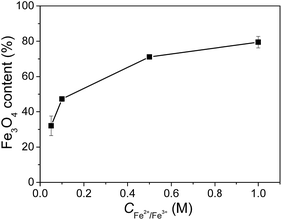 | ||
| Fig. 5 Fe3O4 contents in the JF/Fe3O4 nanocomposite hydrogels prepared at different Fe2+/Fe3+ concentrations. | ||
Magnetic properties
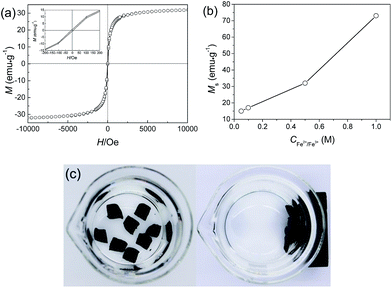
Magnetic hysteresis (M–H) loops of the JF/Fe3O4 nanocomposite hydrogel were measured by SQUID at 300 K. Fig. 6a shows the magnetization curve of the JF/Fe3O4 nanocomposite hydrogel prepared at a Fe2+/Fe3+ concentration of 0.5 M. The coercivity (Hc) and remanence (Br) observed in its enlargement tend to zero (see the inset), indicating that there is nearly not any remaining magnetization after removing external magnetic field. So it is reasonable to conclude that the Fe3O4 nanoparticles in the composite hydrogels exhibit superparamagnetic behavior.46 The saturation magnetization (Ms) of the gel is about 32 emu g−1, which is much smaller than that of bulk Fe3O4 (92 emu g−1).47 The small values of Hc, Br and Ms could be all attributed to the rather small size of the Fe3O4 nanoparticles prepared at a Fe2+/Fe3+ concentration of 0.5 M.7,48 Fig. 6b shows that Ms increases with the increase of Fe2+/Fe3+ concentration, in consistent with the increase of Fe3O4 content and the aggregation of nanoparticles.47The magnetic properties of the JF/Fe3O4 nanocomposite hydrogels endow them with easy collection and separation from solutions. As demonstrated in Fig. 6c, the hydrogel blocks placed in water in a beaker can be easily attracted with a magnet.
Brunauer–Emmett–Teller (BET) surface areas
The Brunauer–Emmett–Teller (BET) surface areas of the gels are shown in Fig. 7. The original JF gel has a relatively low surface area of 5.9 m2 g−1, possibly due to the low solid content and the smooth surface of the nanofibers. The surface areas of the JF/Fe3O4 nanocomposite hydrogels gradually increase with increasing Fe2+/Fe3+ concentration, and the highest for the gel prepared at a Fe2+/Fe3+ concentration of 1.0 M is 85 m2 g−1. The increase of BET surface area should be ascribed to the introduction of Fe3O4 nanoparticles.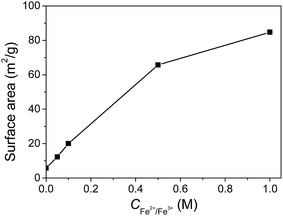 | ||
| Fig. 7 Surface areas of the JF/Fe3O4 nanocomposite hydrogels as a function of Fe2+/Fe3+ concentration. | ||
Catalytic properties
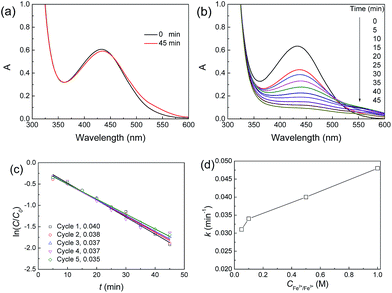
Using the strong oxidizer ˙OH produced through the decomposition of H2O2 catalyzed by Fe3O4 nanoparticles, organic pollutants can be degraded.49 Here, we used the JF/Fe3O4 nanocomposite hydrogels as a heterogeneous catalyst to catalyze the degradation of xylenol orange tetrasodium salt (XO). The reaction process was monitored with UV-Vis spectroscopy, and the typical UV-Vis spectra are shown in Fig. 8a and b. In the absence of a JF/Fe3O4 nanocomposite hydrogel, the strong absorption peak at 434 nm attributed to XO keeps almost no change even after 45 min (Fig. 8a), suggesting that the degradation of XO does not occur, due to the difficulty in producing ˙OH. On the contrary, with the addition of a JF/Fe3O4 nanocomposite hydrogel, the absorbance at 434 nm gradually decreases with reaction time, and the peak vanishes in about 45 min (Fig. 8b). These results indicate that the JF/Fe3O4 nanocomposite hydrogel is very effective in catalyzing the decomposition of H2O2, which produces the strong oxidizer ˙OH for the degradation of XO.The degradation of XO in the presence of H2O2 follows a pseudo first-order kinetics, and the apparent first-order rate constant k can be calculated through the following equation:
| ln(A/A0) = ln(C/C0) = −kt |
The ln(C/C0)–t curves of the reactions performed in the presence of a JF/Fe3O4 nanocomposite hydrogel for five successive cycles are shown in Fig. 8c. A linear ln(C/C0)–t relationship is found for all cycles. The corresponding slopes (k) of the fitted linear lines are 0.040, 0.038, 0.037, 0.037 and 0.035 min−1, respectively (Fig. 8c), indicating the excellent recyclability of the JF/Fe3O4 nanocomposite hydrogel.
The k values of the JF/Fe3O4 nanocomposite hydrogels prepared at different Fe2+/Fe3+ concentrations are shown in Fig. 8d. Obviously, the k value increases with Fe2+/Fe3+ concentration. The apparent reason is the increase of Fe3O4 content in the hydrogels prepared with a higher Fe2+/Fe3+ concentration. The k values obtained in this work are much higher than the values reported for palladium-modified TiO2 nanoparticles (0.013 min−1)50 and ZnS nanoparticles (0.0155 min−1),51 and they are comparable to the highest reported values for porous Fe3O4 nanospheres (0.056 min−1).7
The Fe3O4 nanoparticles in the composite hydrogels are very stable in the catalysis process. We measured the contents of Fe3O4 in the reacted solutions with ICP-AES analysis and found that they are negligible. For example, in the XO and H2O2 solution after being catalyzed for 45 min by a JF/Fe3O4 nanocomposite hydrogel prepared at a Fe2+/Fe3+ concentration of 1.0 M, there is only 7.37 μg Fe (or 30.53 μg Fe3O4), which is less than 0.04% of the amount of Fe3O4 nanoparticles in the nanocomposite hydrogel (ca. 80 mg).
Conclusions
In summary, we have successfully prepared well-dispersed Fe3O4 nanoparticles in the nanostructured jellyfish mesoglea which acts as a natural template for the formation of Fe3O4 nanoparticles. Thanks to the nanostructured macroporous structures of jellyfish mesoglea, Fe3O4 nanoparticles are formed and distributed on the nanofibers, avoiding their severe aggregation even at very high contents of Fe3O4. The introduction of Fe3O4 nanoparticles endows the hydrogels with good superparamagnetic properties and high BET surface areas. The JF/Fe3O4 nanocomposite hydrogels exhibit high catalytic activity as well as excellent reusability in the catalytic degradation of xylenol orange. The idea of using nanostructured biogels as templates to prepare inorganic nanoparticles can be further expanded to other biomaterials for producing other types of metal or metal oxide nanoparticles. The biogel/nanoparticle composite hydrogels may also find practical applications in many other fields.Acknowledgements
This work was financially supported by the National Natural Science Foundation of China (Grant No. 21274013), the Fundamental Research Funds for the Central Universities and the Program for Changjiang Scholars and Innovative Research Team in University (PCSIRT).References
- D. Zhang, P. Sun, P. Li, A. Xue, X. Zhang, H. Zhang and X. Jin, Biomaterials, 2013, 34, 10258–10266 CrossRef CAS PubMed.
- S. A. Meenach, C. G. Otu, K. W. Anderson and J. Z. Hilt, Int. J. Pharm., 2012, 427, 177–184 CrossRef CAS PubMed.
- F. Lu, H. Li, M. Sun, L. Fan, H. Qiu, X. Li and C. Luo, Anal. Chim. Acta, 2012, 718, 84–91 CrossRef CAS PubMed.
- T. Liu, X. Zhang, B. Li, J. Ding, Y. Liu, G. Li, X. Meng, Q. Cai and J. Zhang, RSC Adv., 2014, 4, 50765–50770 RSC.
- X. Zheng, D. Wu, T. Su, S. Bao, C. Liao and Q. Wang, ACS Appl. Mater. Interfaces, 2014, 6, 19840–19849 CAS.
- W. Wang, Y. Liu, T. Li and M. Zhou, Chem. Eng. J., 2014, 242, 1–9 CrossRef CAS.
- M. Zhu and G. Diao, J. Phys. Chem. C, 2011, 115, 18923–18934 CAS.
- V. K. Tripathi and R. Nagarajan, J. Am. Ceram. Soc., 2016, 99, 814–818 CrossRef CAS.
- P.-Y. Lee, H.-S. Teng and C.-S. Yeh, Nanoscale, 2013, 5, 7558–7563 RSC.
- M. Biswal, K. Bhardwaj, P. K. Singh, P. Singh, P. Yadav, A. Prabhune, C. Rode and S. Ogale, RSC Adv., 2013, 3, 2288–2295 RSC.
- J. I. Kim, B. S. Lee, C. Chun, J.-K. Cho, S.-Y. Kim and S.-C. Song, Biomaterials, 2012, 33, 2251–2259 CrossRef CAS PubMed.
- Y. Zhou, S. Fu, L. Zhang, H. Zhan and M. V. Levit, Carbohydr. Polym., 2014, 101, 75–82 CrossRef CAS PubMed.
- Y.-M. Liu, W. Wang, W.-C. Zheng, X.-J. Ju, R. Xie, D. Zerrouki, N.-N. Deng and L.-Y. Chu, ACS Appl. Mater. Interfaces, 2013, 5, 7219–7226 CAS.
- G. Magnacca, A. Allera, E. Montoneri, L. Celi, D. E. Benito, L. G. Gagliardi, M. C. Gonzalez, D. O. Mártire and L. Carlos, ACS Sustainable Chem. Eng., 2014, 2, 1518–1524 CrossRef CAS.
- S. Shin, H. Yoon and J. Jang, Catal. Commun., 2008, 10, 178–182 CrossRef CAS.
- S. Shylesh, V. Schuenemann and W. R. Thiel, Angew. Chem., 2010, 49, 3428–3459 CrossRef CAS PubMed.
- M. M. Moghaddam, B. Pieber, T. Glasnov and C. O. Kappe, ChemSusChem, 2014, 7, 3122–3131 CrossRef CAS PubMed.
- Y. Moliner-Martinez, Y. Vitta, H. Prima-Garcia, R. A. Gonzalez-Fuenzalida, A. Ribera, P. Campins-Falco and E. Coronado, Anal. Bioanal. Chem., 2014, 406, 2211–2215 CrossRef CAS PubMed.
- J.-S. Chen, Y.-M. Zhang and X.-W. Lou, ACS Appl. Mater. Interfaces, 2011, 3, 3276–3279 CAS.
- F. Wang, X. Zhang, L. Shao, Z. Cui and T. Nie, RSC Adv., 2015, 5, 22188–22198 RSC.
- G. Zou, K. Xiong, C. Jiang, H. Li, Y. Wang, S. Zhang and Y. Qian, Nanotechnology, 2005, 16, 1584–1588 CrossRef CAS.
- H. Woo, K. Lee and K. H. Park, ChemCatChem, 2014, 6, 1635–1640 CrossRef CAS.
- X. Xue, K. Hanna, C. Despas, F. Wu and N. Deng, J. Mol. Catal. A: Chem., 2009, 311, 29–35 CrossRef CAS.
- Z.-S. Wu, S. Yang, Y. Sun, K. Parvez, X. Feng and K. Muellen, J. Am. Chem. Soc., 2012, 134, 9082–9085 CrossRef CAS PubMed.
- T.-Y. Liu, S.-H. Hu, T.-Y. Liu, D.-M. Liu and S.-Y. Chen, Langmuir, 2006, 22, 5974–5978 CrossRef CAS PubMed.
- L. Yu, B. J. Scherlag, K. Dormer, K. T. Nguyen, C. Pope, K.-M. Fung and S. S. Po, Circulation, 2010, 122, 2653–2659 CrossRef CAS PubMed.
- P. Das, S. Yuran, J. Yan, P. S. Lee and M. Reches, Chem. Commun., 2015, 51, 5432–5435 RSC.
- Y. Gao, Z. Wei, F. Li, Z. M. Yang, Y. M. Chen, M. Zrinyi and Y. Osada, Green Chem., 2014, 16, 1255–1261 RSC.
- C.-H. Zhu, Y. Lu, J.-F. Chen and S.-H. Yu, Small, 2014, 10, 2796–2800 CrossRef CAS PubMed.
- Y. Gao, C. Hu, W. J. Zheng, S. Yang, F. Li, S. D. Sun, M. Zrinyi, Y. Osada, Z. M. Yang and Y. M. Chen, ChemPhysChem, 2016, 17, 1–10 CrossRef PubMed.
- Z. Li, Z. Zheng, Y. Yang, G. Fang, J. Yao, Z. Shao and X. Chen, ACS Sustainable Chem. Eng., 2016, 4, 1500–1506 CrossRef CAS.
- G. R. Mahdavinia, S. Mousanezhad, H. Hosseinzadeh, F. Darvishi and M. Sabzi, Carbohydr. Polym., 2016, 147, 379–391 CrossRef CAS PubMed.
- Z. Yang and Z. Niu, Chem. Commun., 2002, 1972–1973 RSC.
- L. Ji, Z. Wang, Z. Li and J. Liang, Mater. Lett., 2008, 62, 1979–1982 CrossRef CAS.
- J. S. Im, B. C. Bai, S. J. In and Y.-S. Lee, J. Colloid Interface Sci., 2010, 346, 216–221 CrossRef CAS PubMed.
- B. F. Lin, K. A. Megley, N. Viswanathan, D. V. Krogstad, L. B. Drews, M. J. Kade, Y. Qian and M. V. Tirrell, J. Mater. Chem., 2012, 22, 19447–19454 RSC.
- Q. Mao, S. Shi and H. Wang, ACS Sustainable Chem. Eng., 2015, 3, 1915–1924 CrossRef CAS.
- R. H. White and L. P. Hager, Biochemistry, 1977, 16, 4944–4948 CrossRef CAS PubMed.
- T. Nagai, T. Ogawa, T. Nakamura, T. Ito, H. Nakagawa, K. Fujiki, M. Nakao and T. Yano, J. Sci. Food Agric., 1999, 79, 855–858 CrossRef CAS.
- J. Zhu, X. Wang, C. He and H. Wang, J. Mech. Behav. Biomed. Mater., 2012, 6, 63–73 CrossRef CAS PubMed.
- X. Wang, H. Wang and H. R. Brown, Soft Matter, 2011, 7, 211–219 RSC.
- Y.-N. Chen and H. Wang, J. Colloid Interface Sci., 2015, 454, 14–19 CrossRef CAS PubMed.
- Y.-X. Ma, Y.-F. Li, G.-H. Zhao, L.-Q. Yang, J.-Z. Wang, X. Shan and X. Yan, Carbon, 2012, 50, 2976–2986 CrossRef CAS.
- C.-J. Jia, L.-D. Sun, F. Luo, X.-D. Han, L. J. Heyderman, Z.-G. Yan, C.-H. Yan, K. Zheng, Z. Zhang, M. Takano, N. Hayashi, M. Eltschka, M. Klaui, U. Rudiger, T. Kasama, L. Cervera-Gontard, R. E. Dunin-Borkowski, G. Tzvetkov and J. Raabe, J. Am. Chem. Soc., 2008, 130, 16968–16977 CrossRef CAS PubMed.
- G. Sun, B. Dong, M. Cao, B. Wei and C. Hu, Chem. Mater., 2011, 23, 1587–1593 CrossRef CAS.
- Y. Deng, D. Qi, C. Deng, X. Zhang and D. Zhao, J. Am. Chem. Soc., 2008, 130, 28–29 CrossRef CAS PubMed.
- X. Yang, X. Zhang, Y. Ma, Y. Huang, Y. Wang and Y. Chen, J. Mater. Chem., 2009, 19, 2710–2714 RSC.
- J. Zhang, S. Xu and E. Kumacheva, J. Am. Chem. Soc., 2004, 126, 7908–7914 CrossRef CAS PubMed.
- M. Wang, N. Wang, H. Tang, M. Cao, Y. She and L. Zhu, Catal. Sci. Technol., 2012, 2, 187–194 CAS.
- V. Iliev, D. Tomova, L. Bilyarska and L. Petrov, Catal. Commun., 2004, 5, 759–763 CrossRef CAS.
- D. Ayodhya, V. Maragoni, S. K. Amrutham, G. M. Kotu and V. Guttena, IOSR J. Appl. Chem., 2013, 6, 1–9 CrossRef.
| This journal is © The Royal Society of Chemistry 2017 |

