 Open Access Article
A colorimetric and fluorescent pH probe for imaging in E. coli cells†
Jianbin Chao*a,
Kailun Songab,
Huijuan Wangab,
Zhiqing Liab,
Yongbin Zhangd,
Caixia Yinc,
Fangjun Huod,
Juanjuan Wanga and
Ting Zhanga
aScientific Instrument Center, Shanxi University, Taiyuan 030006, China. E-mail: chao@sxu.edu.cn; Fax: +86-351-721-2621; Tel: +86-351-721-2621
bSchool of Chemistry and Chemical Engineering, Shanxi University, Taiyuan 030006, China
cInstitute of Molecular Science, Shanxi University, Taiyuan 030006, China
dResearch Institute of Applied Chemistry, Shanxi University, Taiyuan 030006, China
First published on 4th January 2017
Abstract
A colorimetric and fluorescent pH probe 1-(4-methylphenyl)-3-(4-dimethylaminophenyl) acrylketone (MDAK) was facilely prepared. The probe exhibited strong pH-dependent behavior and responded linearly and rapidly to minor pH fluctuations within the range of 1.53–3.96. In addition, MDAK displayed a notably large Stokes shift of 121 nm. MDAK possessed a highly selective response to H+ over other metal ions, amion acids and displayed good photostability and excellent reversibility. Furthermore, it can be applied to visualize extreme acidity in E. coli cells.
1. Introduction
Intracellular pH plays a significant role in a mass of cellular events, including cell proliferation and apoptosis,1–3 enzymatic activity,4,5 endocytosis,6 ion transport and homeostasis,7,8 muscle contraction9 and other cellular processes. The H+ concentration is maintained within very narrow limits under normal physiological conditions. The normal value is about 40 nmol L−1 (pH 7.40) and varies by about 5 nmol L−1 (pH 7.35–7.45).10 As an important indication of cellular health, slight changes of intracellular pH have a traumatizing effect on the progress of distinct pathophysiologic states and even cause cellular dysfunction which is closely related to many serious diseases, such as cancer, cardiopulmonary and Alzheimer's disease11–13 (one of the neurodegenerative disorders). Hence, sensing and monitoring pH fluctuations in living cells is crucial for investigating cellular functions and further providing insight into physiological and pathological processes.A range of analytical methods has been reported for the measurement of pH, such as microelectrodes,14 nuclear magnetic resonance (NMR)15 and molecular spectroscopy.16–18 Among these methods, fluorescence spectroscopy has attracted much more attention due to its noninvasiveness, excellent sensitivity, fast response time, simple operation, high signal-to-noise ratio and the ability to continuously monitor the rapid kinetic pH changes.19,20 Fluorescent probes, as the most important area of fluorescence spectroscopy, have been extensively used due to their high selectivity and sensitivity, unrivaled spatiotemporal resolution, convenient operation and possibility of real time monitoring.21 Moreover, with the combination of fluorescent probes and confocal laser scanning microscopy, fluorescence imaging becomes one of the most powerful techniques for the continuous observation of dynamic biochemical and cellular processes of living systems.22 Therefore, fluorescent probes with different design strategies continue to be developed.
In the past few years, a great deal of pH probes reported in literature can be broadly divided into two main classes: one type for cytosol that works in a pH region 6.8–7.4 (ref. 10, 19 and 23–26) and the other type for acidic organelles such as lysosomes and endosomes21,27–35 which function at pH 4.5–6.0. However, the fluorescent probes for extreme acidity (pH < 4)36–41 were paid relatively less attention. In some eukaryotic cells, acidic pH has important effect on organelles along the secretory and endocytic pathways.42 Stomach, which contains gastric acid with acidity pH 2.0–3.0, is the strongly acidic organ of human beings.41 Gastric acid plays an important role in the physiological processes. In the stomach, gastric acid can activate pepsinogen into pepsin which decompose the protein of food,43–45 and provide a suitable acid condition for the activity of pepsin. Also, the extreme acidic environment can kill bacteria in the water and food. In addition, as the gastric acid into the small intestine, it will indirectly promote the secretion of bile and pancreatic juice, and accelerate the absorption of iron and calcium. Abnormal pH values of gastric acid influences the function of stomach, which will cause stomach disorders. In highly acidic conditions (pH < 4), most of the living species could hardly live, but a great number of microorganisms such as acidophiles and Helicobacter pylori can live under such extreme conditions.46,47 Furthermore, enteric bacteria such as Escherichia coli and Salmonella species survive through the highly acidic mammalian stomach.47,48 Thus, there is a great need in designing pH probes with high sensitivity, large Stokes shift, good photostability for extreme acidity.
In this paper, we reported a colorimetric and fluorescent pH probe 1-(4-methylphenyl)-3-(4-dimethylaminophenyl) acrylketone MDAK. MDAK not only showed high sensitivity, reversible response, and excellent stability, but also displayed a notably large Stokes shift of 121 nm which could reduce the excitation interference. The pH titration indicated that MDAK exhibited remarkable pH-dependent behavior in the fluorescence (λex = 440 nm) with a pKa value of 2.71. Furthermore, MDAK responded to pH fluctuations within a wider pH range (1.53–3.96). More importantly, the probe had been successfully used for fluorescence imaging in E. coli cells under extreme acidity conditions.
2. Experimental section
2.1. Materials and apparatus
Unless otherwise stated, all other reagents were purchased from commercial suppliers and applied directly without purification. Twice-distilled water was used in all the experiments. Fluorescence measurements were obtained with a Hitachi F-7000 fluorescence spectrophotometer. Photomultiplier (PMT) voltage was set at 600 V for the fluorescence spectra. Absorption spectra were measured with a UV-2450 spectrophotometer in a 4.5 mL (1 cm in diameter) cuvette with 2 mL solution. NMR spectra were recorded on a Bruker instrument (AVANCE|||HD) with TMS as the internal standard in DMSO-d6 of 600 MHz for 1H NMR and 150 MHz for 13C NMR, respectively. Mass spectra were taken on a Thermo Scientific Q Exactive mass spectrometer. Fluorescent images were performed on a ZEISS LSM-880 confocal laser scanning microscope.2.2. Synthesis and characterization of fluorescent probe
4-Dimethylaminobenzaldehyde (1.94 g, 13 mmol), 1-(4-methylphenyl)-ethanone (1.79 g, 13 mmol), 10% NaOH solution (3 mL), anhydrous ethanol (100 mL) were added in turn to a 250 mL flask. The reaction was stirred at room temperature for 4 h. The progress of reaction was monitored by thin-layer chromatography (trichloromethane![[thin space (1/6-em)]](https://www.rsc.org/images/entities/char_2009.gif) :
:![[thin space (1/6-em)]](https://www.rsc.org/images/entities/char_2009.gif) petroleum ether = 1
petroleum ether = 1![[thin space (1/6-em)]](https://www.rsc.org/images/entities/char_2009.gif) :
:![[thin space (1/6-em)]](https://www.rsc.org/images/entities/char_2009.gif) 3). The mixture was subsequently filtered under reduced pressure. The crude product was recrystallized with anhydrous ethanol and dried overnight under a vacuum to obtain yellow solid (2.77 g, 85%). The synthesis route of MDAK was shown in Scheme 1. 1H NMR δ/ppm (600 MHz, DMSO-d6): 8.03 (d, J = 7.8 Hz, 2H), 7.71 (d, J = 8.4 Hz, 2H), 7.65 (t, J = 10.8 Hz, J = 15.6 Hz, 2H), 7.36 (d, J = 7.8 Hz, 2H), 6.75 (d, J = 8.4 Hz, 2H), 3.01 (s, 6H), 2.40 (s, 3H); 13C NMR (150 MHz, DMSO-d6): 188.58, 152.40, 145.27, 143.27, 136.26, 131.18, 129.68, 128.81, 122.52, 116.57, 112.21, 40.17, 21.62 (Fig. S1†). HRMS (ESI) calcd for [M + H]+ 266.15394, found 266.15403 (Fig. S2†).
3). The mixture was subsequently filtered under reduced pressure. The crude product was recrystallized with anhydrous ethanol and dried overnight under a vacuum to obtain yellow solid (2.77 g, 85%). The synthesis route of MDAK was shown in Scheme 1. 1H NMR δ/ppm (600 MHz, DMSO-d6): 8.03 (d, J = 7.8 Hz, 2H), 7.71 (d, J = 8.4 Hz, 2H), 7.65 (t, J = 10.8 Hz, J = 15.6 Hz, 2H), 7.36 (d, J = 7.8 Hz, 2H), 6.75 (d, J = 8.4 Hz, 2H), 3.01 (s, 6H), 2.40 (s, 3H); 13C NMR (150 MHz, DMSO-d6): 188.58, 152.40, 145.27, 143.27, 136.26, 131.18, 129.68, 128.81, 122.52, 116.57, 112.21, 40.17, 21.62 (Fig. S1†). HRMS (ESI) calcd for [M + H]+ 266.15394, found 266.15403 (Fig. S2†).
2.3. General UV-vis and fluorescence spectra measurement
Stock solution of probe (1.0 mM) was prepared in DMSO. The solution for spectroscopic determination was obtained by diluting the stock solution to 10 μM in DMSO/water (1/3 v/v) medium. The pH variations of the solution were adjusted by adding the different volumes of HCl (1.0 M, 0.1 M). Spectral data were recorded after each addition. The excitation and emission slit widths were 5 nm and 10 nm, respectively. All spectroscopic experiments were carried out at room temperature.2.4. E. coli cells culture and imaging
According to the method reported in literature,37 E. coli cells were incubated at 37 °C in Luria–Bertani (LB) culture medium (tryptone 10 g L−1, yeast extract 5 g L−1, and NaCl 10 g L−1) for 17 h in a table concentrator at 180 rpm. Then the culture was centrifuged at 5000 rpm for 5 min to collect E. coli cells. The sediment was washed with sterile water and then resuspended in solutions of different pH (6.81, 2.70 and 1.22). Five minutes after resuspension, the probe dissolved in DMSO was added into every tube to a final probe concentration of 30 μM. E. coli cells with the probe were incubated in a table concentrator for 2 h and then smeared on slides and observed by confocal laser scanning microscope.3. Results and discussion
3.1. UV-vis spectrum study
Fig. 1 showed the UV-vis absorption spectral change of MDAK at different pH values. As the pH decreased from 6.81 to 1.07, the absorbance at 437 nm reduced dramatically. Upon decreasing the pH from 6.81 to 3.40, the absorbance at 280 nm reduced gradually. When pH was less than 3.40, the absorption spectra exhibit a red shift from 280 to 300 nm and increased clearly. The observed absorption enhancement might be caused by experimental instrument. On this account, the absorption signals showed a sharp increase at about 360 nm for the systems with low pH values. At this wavelength, the spectrophotometer changed its light sources, which resulting in the increment of absorption signals at 300 nm. According to Fig. 1, the molar extinction coefficient of probe could be obtained by using Lambert–Beer's law: ε = 3.31 × 10⁴ L mol−1 cm−1 (λ = 437 nm, pH 6.81). In addition, a notable color change from yellow to colourless can be observed with pH decreasing, which proved that MDAK could serve as a visual probe for the determination of pH fluctuations.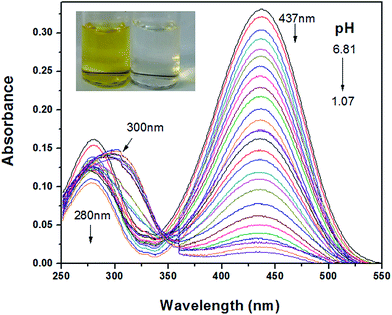 | ||
| Fig. 1 The absorption spectra of MDAK as pH decreased from 6.81 to 1.07. Inset: the photograph of probe solution (10 μM) as pH increased from 6.81 to 1.07. | ||
3.2. Fluorescence spectrum study
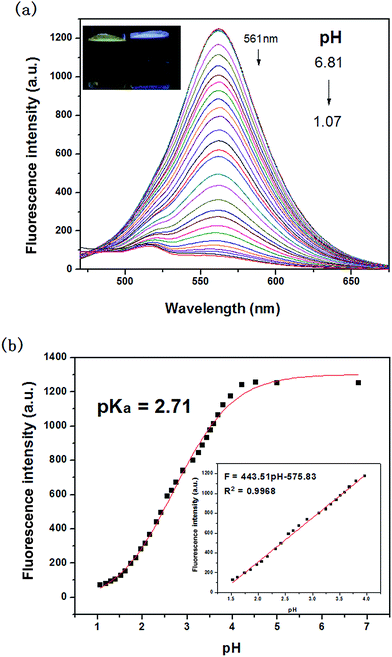
Fluorescence pH titrations were performed in DMSO/water (1/3, v/v) at a probe concentration of 10 μM. As shown in Fig. 2a, in the absence of H+, the probe solution exhibited an intense emission band centered at 561 nm (λex = 440 nm) with a large Stokes shift of 121 nm. The large Stokes shift could help to reduce the excitation interference. With the variation of pH from 6.81 to 1.07, the probe showed turn-off fluorescence. Meanwhile, we could observed that the probe undergone distinct color change from bright yellow to nonfluorescence under UV lamp. Fig. 2b displayed the results of sigmoidal fitting of the pH-dependent emission at 561 nm, affording a pKa value of 2.71. The emission intensity also showed good linearity with pH in the range 1.53–3.96, according to the linear regression equation F = 443.51 pH–575.83, with a linear coefficient of 0.9968 (inset of Fig. 2b). The data indicated that the probe could be used to detect pH quantitatively in extreme acidity.3.3. Selectivity study
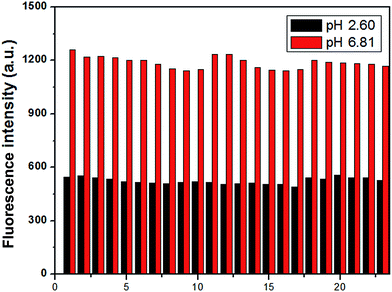
To examine whether the probe could detect H+ efficiently, the selectivity of MDAK (10 μM) to acidic pH over metal ions was investigated at pH 6.81 and 2.60 by competition experiments, respectively. Fig. 3 exhibited that in the presence of physiologically ubiquitous metal ions (K+, Na+, Ca2+ and Mg2+) do not give any obvious emission change at the two pH values. Similarly, the addition of other metal cations, such as Zn2+, Al3+, Pb2+, Mn2+, Co2+, Cr3+, Hg2+, Bi3+, Ni2+, Cu2+, Fe2+, Fe3+ caused no appreciable spectroscopic changes under the testing conditions. Furthermore, some amion acids (cysteine, alanine, leucine, glycine, glutamate and histidine) exhibited negligible effect. The results suggested that the probe showed excellent selectivity toward H+ over metal cations and some amion acids.3.4. Photostability and reversibility study
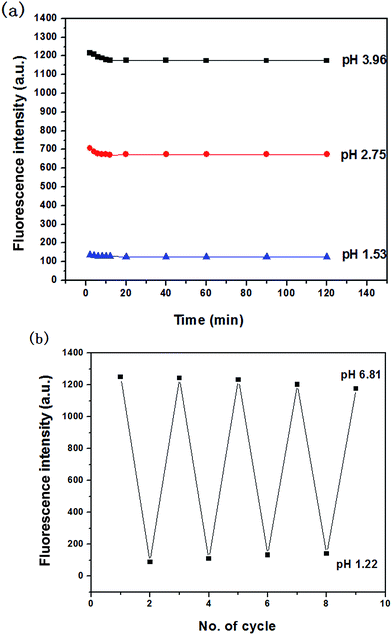
The stability of the probe was tested by measuring the fluorescent response during 2 h. Fig. 4a showed the time course of fluorescence intensity of MDAK (10 μM) at pH 3.96, 2.75, and 1.53 at room temperature, which proved that the probe could instantly respond to the change of H+ concentration. The experimental results proved that the probe possessed good photostability.It is well-known that the reversibility of pH probe is highly required. Therefore, we explored the reversibility of MDAK. The pH value of the solution was switched back and forth between 6.81 and 1.22 by using concentrated hydrochloric acid and aqueous sodium hydroxide. Fig. 4b clearly revealed that the probe exhibited a highly reversible response to pH and the response times in different pH values were less than 1 s. Switching between the fluorescence on/off states could thus be repeated accompanied with the color change repeatedly between yellow (pH 6.81) and colorless (pH 1.22), which enabled us to propose a mechanism for the equilibrium of probe with variations of pH (Scheme 2).
3.5. 1H NMR analysis
1H NMR experiments were carried out to explore the changes of protons. As shown in Fig. 5, the chemical shift values of H-a, H-b, H-c shifted downfield, whereas the other protons experienced only a small shift. At acidic condition, the N atom of MDAK was protonated to generated N+. The N+ possessed stronger electro-withdrawing ability than N, so the proton signals (H-a, at δ 3.01) of the methyl group connected with N were significantly shifted downfield to δ 3.08 under acidic condition. The similar results were obtained for the proton signals (H-b, H-c) of the phenyl group connected with N. Therefore, H was added to the N atom of MDAK.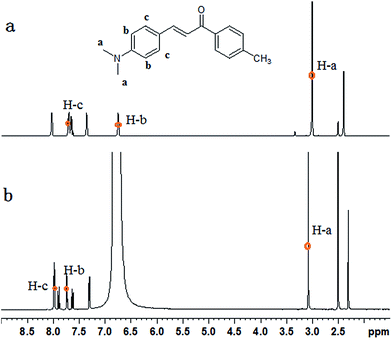 | ||
| Fig. 5 1H NMR spectra of MDAK in DMSO-d6 before (a) and after (b) the addition of hydrochloric acid. | ||
3.6. Theoretical calculations
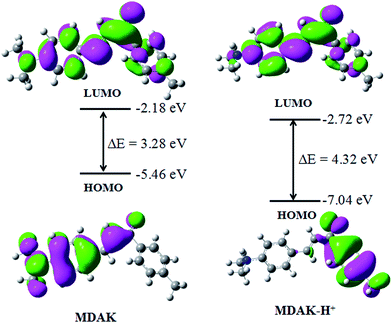
To better understand the optical responses of MDAK upon binding with H+, time-dependent density functional theory (TD-DFT) calculations were performed using Gaussian 09 program. The ground state geometries were optimized by using B3LYP functional with 6-31+G (d) basis set. Fig. 6 displayed the optimized structures, the lowest unoccupied, the highest occupied molecular orbital (LUMO and HOMO) plots of MDAK and its protonated forms in ground state. From Fig. 6 we could see that the HOMO of MDAK located on the p orbits of N and C at the left side of the molecule, and the LUMO of MDAK located on the p orbits of N and C of the molecule. However, the HOMO of MDAK-H+ located on the p orbits of C at the right side, which are far away from the N atoms, and the LUMO of MDAK-H+ located on the p orbits of C of the molecule. To sum up, the protonation affected the distribution of the frontier molecular orbitals.3.7. Imaging for E. coli cells
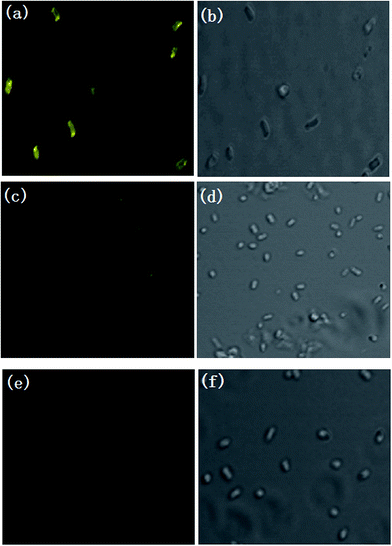
Encouraged by the above results, we next investigated whether the probe could be used to monitor pH changes in living samples. We used E. coli cells as a model to study the fluorescence change of E. coli cells incubated with probe (30 μM) under different pH conditions using confocal laser scanning microscope (Fig. 7). The yellow fluorescence (485–600 nm) was captured by 458 nm laser. It can be seen that the E. coli cells displayed bright yellow fluorescence (Fig. 7a) at pH 6.81. The yellow fluorescence intensity dropped sharply with the pH decreasing to 2.70 (Fig. 7c), and almost no fluorescence was observed as the pH decreased to 1.22 (Fig. 7e). The results confirmed that the probe was able to image pH changes under extreme acidity in E. coli cells and we believed that it may be applied to other biological systems with extreme acidity conditions.4. Conclusion
In summary, a pH probe MDAK was easily synthesized in a one-step reaction. As the pH decreased from 6.81 to 1.07, the fluorescence intensity at 561 nm reduced dramatically. A pKa value of 2.71 and a good linearity relation in the pH range of 1.53–3.96 indicated that the probe could be used in quantitative measuring pH under extreme acidity. The fluorescence imaging confirmed that the probe could monitor pH fluctuations in E. coli cells under extreme acidity. The large Stokes shift, highly selectivity, good photostability and excellent reversibility of the probe demonstrated that it may act as an effective intracellular pH imaging agent under extreme acidity conditions in the biomedical and biological fields.Acknowledgements
The work was supported by the National Natural Science Foundation of China (No. 21472118), the Shanxi Province Science Foundation for Youths (No. 2012021009-4 and 2013011011-1), the Shanxi Province Foundation for Returnee (No. 2012-007), the Taiyuan Technology Star Special (No. 12024703), the Program for the Top Young and Middle-aged Innovative Talents of Higher Learning Institutions of Shanxi (TYMIT, No. 2013802), Talents Support Program of Shanxi Province (No. 2014401) and Shanxi Province Outstanding Youth Fund (No. 2014021002), the Scientific and Technological Innovation Programs of Higher Education Institutions in Shanxi (20111001), and the Shanxi Province Foundation for College Students of Science and Technology Innovation projects (No. 2013328).Notes and references
- S. Humez, M. Monet, F. Coppenolle, P. Delcourt and N. Prevarskaya, Am. J. Physiol.: Cell Physiol., 2004, 287, 1733 CrossRef PubMed.
- D. Pérez-Sala, D. Collado-Escobar and F. Mollinedo, J. Biol. Chem., 1995, 270, 6235 CrossRef.
- R. A. Gottlieb, J. Nordberg, E. Skowronski and B. M. Babior, Proc. Natl. Acad. Sci. U. S. A., 1996, 93, 654 CrossRef CAS.
- R. Tsuboi, I. Ko, K. Takamori and H. Ogawa, Infect. Immun., 1989, 57, 3479 CAS.
- R. T. Kennedy, L. Huang and C. A. Aspenwall, J. Am. Chem. Soc., 1996, 118, 1795 CrossRef CAS.
- M. Lakadamyali, M. J. Rust, H. P. Babcock and X. Zhuang, Proc. Natl. Acad. Sci. U. S. A., 2003, 100, 9280 CrossRef CAS PubMed.
- P. Donoso, M. Beltrán and C. Hidalgo, Biochemistry, 1996, 35, 13419 CrossRef CAS PubMed.
- C. Hunte, E. Screpanti, M. Venturi, A. Rimon, E. Padan and H. Michel, Nature, 2005, 435, 1197 CrossRef CAS PubMed.
- E. R. Chin and D. G. Alllen, J. Physiol., 1998, 512, 831 CrossRef CAS.
- B. Tang, F. Yu, P. Li, L. Tong, X. Duan, T. Xie and X. Wang, J. Am. Chem. Soc., 2009, 131, 3016 CrossRef CAS PubMed.
- H. Izumi, T. Torigoe, H. Ishiguchi, H. Uramoto, Y. Yoshida, M. Tanabe, T. Ise, T. Murakami, T. Yoshida, M. Nomoto and K. Kohno, Cancer Treat. Rev., 2003, 29, 541 CrossRef CAS PubMed.
- T. A. Davies, R. E. Fine, R. J. Johnson, C. A. Levesque, W. H. Rathbun, K. F. Seetoo, S. J. Smith, G. Strohmeier, L. Volicer, L. Delva and E. R. Simons, Biochem. Biophys. Res. Commun., 1993, 194, 537 CrossRef CAS PubMed.
- A. Kogot-Levin, M. Zeigler, A. Ornoy and G. Bach, Pediatr. Res., 2009, 65, 686 CrossRef CAS PubMed.
- D. Ellis and R. C. Thomas, Nature, 1976, 262, 224 CrossRef CAS PubMed.
- S. J. A. Hesse, G. J. G. Ruijter, C. Dijkema and J. Visser, J. Biotechnol., 2000, 77, 5 CrossRef CAS PubMed.
- R. G. Zhang, S. G. Kelsen and J. C. LaManna, J. Appl. Physiol., 1990, 68, 1101 CAS.
- F. Han, Y. Xu, D. Jiang, Y. Qin and H. Chen, Anal. Biochem., 2013, 435, 106 CrossRef CAS PubMed.
- J. Hu, F. Wu, S. Feng, J. Xu, Z. Xu, Y. Chen, T. Tang, X. Weng and X. Zhou, Sens. Actuators, B, 2014, 196, 194 CrossRef CAS.
- L. Fan, Q. Liu, D. Lu, H. Shi, Y. Yang, Y. Li, C. Dong and S. Shuang, J. Mater. Chem. B, 2013, 1, 4281 RSC.
- Y.-Y. Liu, M. Wu, L.-N. Zhu, X.-Z. Feng and D.-M. Kong, Chem.–Asian J., 2015, 10, 1304 CrossRef CAS PubMed.
- X.-F. Zhang, T. Zhang, S.-L. Shen, J.-Y. Miao and B.-X. Zhao, J. Mater. Chem. B, 2015, 3, 3260 RSC.
- E. Nakata, Y. Yukimachi, Y. Nazumi, M. Uwate, H. Maseda, Y. Uto, T. Hashimoto, Y. Okamoto, H. Horib and T. Moriia, RSC Adv., 2014, 4, 348 RSC.
- H. Yu, G. Li, B. Zhang, X. Zhang, Y. Xiao, J. Wang and Y. Song, Dyes Pigm., 2016, 133, 93 CrossRef CAS.
- U. C. Saha, K. Dhara, B. Chattopadhyay, S. K. Mandal, S. Mondal, S. Sen, M. Mukherjee, S. V. Smaalen and P. Chattopadhyay, Org. Lett., 2011, 13, 4510 CrossRef CAS PubMed.
- S. Yao, K. J. Schafer-Hales and K. D. Belfield, Org. Lett., 2007, 9, 5645 CrossRef CAS PubMed.
- G. Ke, Z. Zhu, W. Wang, Y. Zou, Z. Guan, S. Jia, H. Zhang, X. Wu and C. J. Yang, ACS Appl. Mater. Interfaces, 2014, 6, 15329 CAS.
- S. L. Shen, X. P. Chen, X. F. Zhang, J. Y. Miao, B. X. Zhao, S. Shen, X. Chen, X. Zhang, J. Miao and B. Zhao, J. Mater. Chem. B, 2015, 3, 919 RSC.
- H.-S. Lv, S.-Y. Huang, B.-X. Zhao and J.-Y. Miao, Anal. Chim. Acta, 2013, 788, 177 CrossRef CAS PubMed.
- X.-F. Zhang, T. Zhang, S.-L. Shen, J.-Y. Miao and B.-X. Zhao, RSC. Adv., 2015, 5, 49115 RSC.
- J. Zhang, M. Yang, C. Li, N. Dorh, F. Xie and F.-T. Luo, J. Mater. Chem. B, 2015, 3, 2173 RSC.
- A. Wallabregue, D. Moreau, P. Sherin, P. M. Lorente, Z. Jarolímová, E. Bakker, E. Vauthey, J. Gruenberg and J. Lacour, J. Am. Chem. Soc., 2016, 138, 1752 CrossRef CAS PubMed.
- B. Dong, X. Song, C. Wang, X. Kong, Y. Tang and W. Lin, Anal. Chem., 2016, 88, 4085 CrossRef CAS PubMed.
- X.-L. Shi, G.-J. Mao, X.-B. Zhang, H.-W. Liu, Y.-J. Gong, Y.-X. Wu, L.-Y. Zhou, J. Zhang and W. Tan, Talanta, 2014, 130, 356 CrossRef CAS PubMed.
- Y. Fu, J. Zhang, H. Wang, J.-L. Chen, P. Zhao, G.-R. Chen and X.-P. He, Dyes Pigm., 2016, 133, 372 CrossRef CAS.
- G.-J. Song, S.-Y. Bai, X. Dai, X.-Q. Cao and B.-X. Zhao, RSC Adv., 2016, 6, 41317 RSC.
- L. Fan, S.-Q. Gao, Z.-B. Li, W.-F. Niu, W.-J. Zhang, S.-M. Shuang and C. Dong, Sens. Actuators, B, 2015, 221, 1069 CrossRef CAS.
- W. Niu, L. Fan, M. Nan, M. S. Wong, S. Shuang and C. Dong, Sens. Actuators, B, 2016, 234, 534 CrossRef CAS.
- Y. Xu, Z. Jiang, Y. Xiao, F. Z. Bi, J. Y. Miao and B. X. Zhao, Anal. Chim. Acta, 2014, 820, 146 CrossRef CAS PubMed.
- S.-L. Shen, X.-F. Zhang, S.-Y. Bai, J.-Y. Miao and B.-X. Zhao, RSC Adv., 2015, 5, 13341 RSC.
- W. Niu, L. Fan, M. Nan, Z. Li, D. Lu, M. S. Wong, S. Shuang and C. Dong, Anal. Chem., 2015, 87, 2788 CrossRef CAS PubMed.
- W.-J. Zhang, L. Fan, Z.-B. Li, T. Ou, H.-J. Zhai, J. Yang, C. Dong and S.-M. Shuang, Sens. Actuators, B, 2016, 233, 566 CrossRef CAS.
- G. Loving and B. Imperiali, J. Am. Chem. Soc., 2008, 130, 13630 CrossRef CAS PubMed.
- T. Tanaka and R. Y. Yada, Arch. Biochem. Biophys., 1997, 340, 355 CrossRef CAS PubMed.
- X. Lin, G. Koelsch, J. A. Loy and J. Tang, Protein Sci., 1995, 4, 159 CrossRef CAS PubMed.
- X. L. Lin, R. N. Wong and J. Tang, J. Biol. Chem., 1989, 264, 4482 CAS.
- D. S. Merrell and A. Camilli, Curr. Opin. Microbiol., 2002, 5, 51 CrossRef CAS PubMed.
- T. A. Krulwich, G. Sachs and E. Padan, Nat. Rev. Microbiol., 2011, 9, 330 CrossRef CAS PubMed.
- J. W. Foster, Nat. Rev. Microbiol., 2004, 2, 898 CrossRef CAS PubMed.
Footnote |
| † Electronic supplementary information (ESI) available. See DOI: 10.1039/c6ra24885c |
| This journal is © The Royal Society of Chemistry 2017 |


