 Open Access Article
Fluorescence sensor for detecting protamines based on competitive interactions of polyacrylic acid modified with sodium 4-amino-1-naphthalenesulfonate with protamines and aminated graphene oxide†
Jinshui Liu*,
Meijiao Xu,
Bin Wang,
Zihan Zhou and
Lizhen Wang
College of Chemistry and Materials Science, The Key Laboratory of Functional Molecular Solids, Ministry of Education, Anhui Key Laboratory of Chemo/Biosensing, Anhui Laboratory of Molecule-Based Materials, Anhui Normal University, Wuhu 241000, PR China. E-mail: jsliu@sina.com
First published on 5th January 2017
Abstract
An easy-to-use fluorescent probe for detecting protamines was developed. Protamines are detected using the probe because of competitive interactions of polyacrylic acid modified with sodium 4-amino-1-naphthalenesulfonate (ANS-PAA) with protamines and aminated graphene oxide (GO-NH2). The ANS-PAA fluorescence was effectively quenched by the GO-NH2, the high quenching efficiency being caused by the ANS-PAA becoming non-covalently bound to the GO-NH2 surface through electrostatic interactions, forming a ANS-PAA/GO-NH2 complex. Adding protamines recovered the fluorescence of the ANS-PAA/GO-NH2 complex. This recovery was due to the positively charged protamines removing ANS-PAA from the GO-NH2 surfaces and forming ANS-PAA/protamine complexes. Displacement of GO-NH2 by protamines gave a high fluorescence recovery efficiency. Under optimal conditions, the fluorescence intensity when protamines were added was proportional to the protamine concentration over the range 0 to 6.0 μg mL−1. The detection limit was 0.4 μg mL−1. This approach offers a new quantitative method for determining protamines.
Introduction
Protamines are strongly cationic peptides with molecular masses of approximately 6000 Da that are found in the spermatic cells of vertebrates and cephalopods.1 The primary polypeptide sequence of a protamine can have an arginine content of up to 67%, so protamines are highly positively charged.2 Protamines have been separated from the sperm of salmon and other fish species. Protamines are now able to be produced using recombinant biotechnology. Protamines are important pharmaceuticals that are used in cardiac surgery, vascular surgery, and interventional radiology procedures as an antidote for heparin (used to treat and prevent blood clots) overdose.3 Protamines can also prolong insulin release in diabetes mellitus therapies. However, overusing protamines can lead to adverse effects such as hypotension and idiosyncratic fatal cardiac arrest.4 Detecting and quantifying protamines is therefore crucial to clinical procedures. A number of approaches have been developed for detecting protamines, including electrochemical methods,5 chromatographic methods,6 and colorimetric methods.7,8 These methods offer reasonable sensitivities and specificities, but some are inaccurate, complicated, time-consuming, or have poor reproducibilities. It is therefore highly desirable to develop a simple, rapid, and sensitive method for detecting protamines. Fluorescence methods are the most promising alternative methods for detecting protamines because they offer advantages over other techniques, including their speed, ease of use, and sensitivities.9–13 A large number of fluorescence probes have been developed for sensitively detecting protamine, but, to the best of our knowledge, only a few methods have been developed in which protamine is detected using fluorescence turn-on sensors.11,12 Fluorescence turn-on sensors offer advantages over fluorescence quenching sensors in that there is less chance of false positive signals being obtained and sensitivities and selectivities are better using fluorescence turn-on sensors than using fluorescence quenching sensors, as has been demonstrated in numerous studies.14 The development of an environmentally friendly turn-on probe for detecting protamine is still a challenge.Graphene oxide (GO), which is a two-dimensional nanosheet, has effective electron transfer properties that allow it to strongly quench fluorescence, and these properties have been used creatively in GO-quenched optical sensors for various analytes.15–17 However, to the best of our knowledge, all GO-complex fluorescence sensors that have previously been developed have used pristine GO, the surfaces of which always have negative charges (on the intrinsic carboxyl groups). These negative charges keep GO well dispersed in aqueous solutions but weaken interactions between anionic dyes and GO because of electrostatic repulsion, meaning the quenching efficiencies of the anionic dyes will not be as high as might be desirable. GO modified with amine groups (GO-NH2) are new materials that possess the properties of both GO and the amine groups. The amine groups become protonated (and therefore positively charged) in acidic solutions.
Poly(acrylic acid) (PAA) is a hydrophilic polymer that has abundant carboxyl groups, making it soluble in water and giving it a high negative charge density.18 PAA is therefore strongly electrostatically attracted to positively charged molecules. Sodium 4-amino-1-naphthalenesulfonate (ANS) is a fluorescent dye that can be used to modify PAA, giving ANS-PAA. The modification, which improves the negative charge density of the ANS, can be achieved using the 1-ethyl-3-(3-dimethylaminopropyl)carbodiimide/N-hydroxysuccinimide coupling method. ANS-PAA has a high negative charge density, and it will have a strong binding affinity for protonated GO-NH2 or protamines.
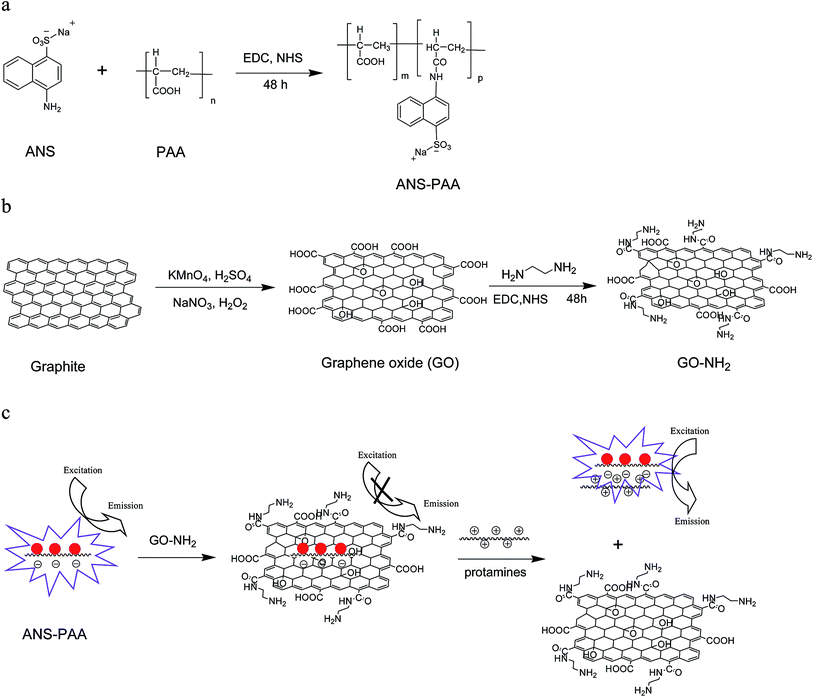
In the study described here we synthesized a new ANS-PAA/GO-NH2 complex probe for determining protamines. The ANS-PAA is used as an indicator, and protamines are sensitively detected because of competition between the GO-NH2 and protamine to bind with the indicator (as shown in Scheme 1). The fluorescence of ANS-PAA added to a solution containing the GO-NH2 is quenched because the negative ANS-PAA adsorbs to the positively charged GO-NH2 surfaces through electrostatic attraction. Förster resonance energy transfer and electron transfer occur because of the proximity of the ANS-PAA and GO-NH2. However, cationic protamines will form stable inter-polyelectrolyte complexes with the anionic ANS-PAA through strong electrostatic interactions, causing the ANS-PAA to desorb from the GO-NH2 surfaces and the fluorescence of the ANS-PAA to be recovered. We found that the displacement of ANS-PAA by protamines gave a high fluorescence recovery efficiency. Protamines are detected using the GO-NH2 complex through the fluorescence turn-on process.
Experimental
Materials and chemicals
Graphite and N-hydroxysuccinimide were purchased from Sinopharm Chemical Reagent Co. (Shanghai, China). ANS and PAA (MW 450![[thin space (1/6-em)]](https://www.rsc.org/images/entities/char_2009.gif) 000) were obtained from Aladdin (Shanghai, China). Anhydrous ethylenediamine, KMnO4, and NaNO3 were purchased from Shanghai Lingfeng Chemical Reagent Co. (Shanghai, China). 1-Ethyl-3-(3-dimethylaminopropyl)-carbodiimide hydrochloride was purchased from Shanghai Medpep Co. (Shanghai, China). All of the reagents were of analytical reagent grade and were used without further purification. All solutions were prepared under ambient conditions using deionized water.
000) were obtained from Aladdin (Shanghai, China). Anhydrous ethylenediamine, KMnO4, and NaNO3 were purchased from Shanghai Lingfeng Chemical Reagent Co. (Shanghai, China). 1-Ethyl-3-(3-dimethylaminopropyl)-carbodiimide hydrochloride was purchased from Shanghai Medpep Co. (Shanghai, China). All of the reagents were of analytical reagent grade and were used without further purification. All solutions were prepared under ambient conditions using deionized water.
Apparatus
Scanning electron microscopy (SEM) images were obtained using a Hitachi-S4800 field emission scanning electron microscope (Hitachi High-Technologies, Tokyo, Japan). Fourier transform infrared (FTIR) spectra from 400 to 4000 cm−1 were acquired using an FTIR S-8400 instrument (Shimadzu, Kyoto, Japan) using KBr disks. Powder X-ray diffraction patterns were recorded using an XRD-6000 instrument (Shimadzu) using a Cu Kα target and a scanning rate of 8° 2θ min−1, from 10° to 80°. Fluorescence spectra of all of the samples were acquired using an F-4500 instrument (Hitachi High-Technologies), using a 1.0 cm × 1.0 cm quartz cell. All of the experiments were carried out at room temperature.Preparation of GO-NH2 and ANS-PAA
The method used to synthesize GO has been described in our previous publications. The GO was prepared from purified natural graphite using a modified Hummers method.18,19 Briefly, concentrated H2SO4 (23 mL) was added to a 250 mL flask containing graphite (1.0 g), and the mixture was kept at 0 °C in an ice bath. NaNO3 (0.5 g) was added to the mixture, then KMnO4 (3.0 g) was gradually added, with stirring, and the temperature of the mixture was kept below 10 °C. The mixture was then stirred with a mechanical stirrer for 2 h. The temperature was increased to 35 °C, and that temperature was maintained for 12 h. Deionized water (140 mL) was then added to the mixture, and the mixture was continuously stirred for 30 min while the temperature was increased to 90 °C. A 30% H2O2 solution (50 mL) was then added and the mixture was cooled to room temperature. The mixture was then filtered and the product washed three times with 5% HCl(aq) then with deionized water until the final product reached neutral pH. The resulting filter cake was dried in a vacuum oven. To aminate the GO complex to give GO-NH2, GO (20 mg) was added to phosphate-buffered saline (20 mL) and the mixture was ultrasonicated for 1 h to give a homogeneous GO dispersion. A 500 mM 1-ethyl-3-(3-dimethylaminopropyl)-carbodiimide hydrochloride and N-hydroxysuccinimide solution (1.0 mL) was then added to the dispersion, and the mixture was incubated for 30 min. Ethylenediamine (0.2 mL) was then added,20,21 and the mixture was incubated for another 2 h. The mixture was then kept overnight at 4 °C, then centrifuged at 8000 rpm for 10 min. The solid phase was then washed with deionized water. The final product, GO-NH2 nanocomposites, was obtained and dried under vacuum for 48 h.Synthesis of ANS-PAA
In a 20 mL brown bottle, purified PAA (15 mg) was dissolved in phosphate-buffered saline (5 mL) at pH 7.4. The PAA solution was then placed in an ice bath, and 1-ethyl-3-(3-dimethylaminopropyl)-carbodiimide hydrochloride (20 mg) and sulfo-N-hydroxysuccinimide (10 mg) were added while the mixture was stirred using a magnetic stirrer. The mixture was stirred for 1.0 h, then ANS (20 mg) was added, and the reaction mixture was kept in the ice bath for another 2 h and then at room temperature for 22 h. Once the reaction was complete, the mixture was dialyzed (with a molecular weight cutoff of 14![[thin space (1/6-em)]](https://www.rsc.org/images/entities/char_2009.gif) 000 g mol−1) against deionized water for three days until the conductivity of the water outside the tube remained constant. The ANS-PAA was then dried under vacuum and dissolved in water to give an ANS-PAA concentration of 1.0 g L−1.
000 g mol−1) against deionized water for three days until the conductivity of the water outside the tube remained constant. The ANS-PAA was then dried under vacuum and dissolved in water to give an ANS-PAA concentration of 1.0 g L−1.
Fluorescence titration experiments
Fluorescence measurements were made using a Hitachi F-4500 fluorescence spectrophotometer. A stock solution of ANS-PAA (1.0 g L−1) and a stock solution of GO-NH2 (1.0 g L−1) and protamines (1.0 g L−1) in water were prepared, then the ANS-PAA stock solution was diluted with HEPES buffer solution to give a final concentration of 1.0 mg L−1. GO-NH2 was gradually added to the diluted ANS-PAA solution until the ANS-PAA fluorescence was quenched, then the required amount of protamines was added. The sample was gently stirred for 5 min before the fluorescence was recorded. Each experiment was performed at the optimal pH. The fluorescence intensity of the mixture in each tube (different tubes contained different amounts of protamine) was measured using an excitation wavelength of 327 nm, and the excitation and emission slits were both set to 5.0 nm.Results and discussion
Characterization of the GO, GO-NH2, and ANS-PAA
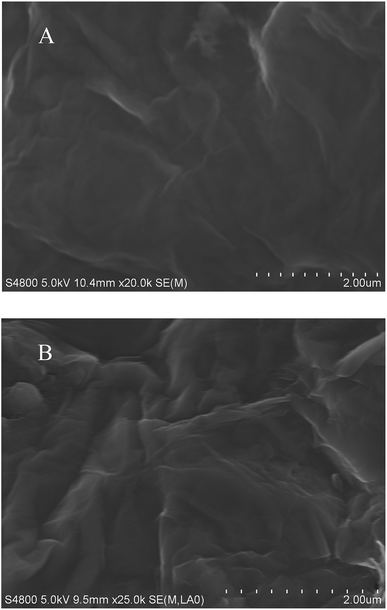
SEM images of the GO and GO-NH2 surfaces are shown in Fig. 1. It can clearly be seen that the GO sheets have typical ripples and paper-like structures. The GO-NH2 sheets, in contrast, have much rougher surfaces.The natural graphite, GO, and GO-NH2 X-ray diffraction patterns, shown in the ESI (Fig. S1†), supported our conclusion that the GO-NH2 complex have been prepared successfully.
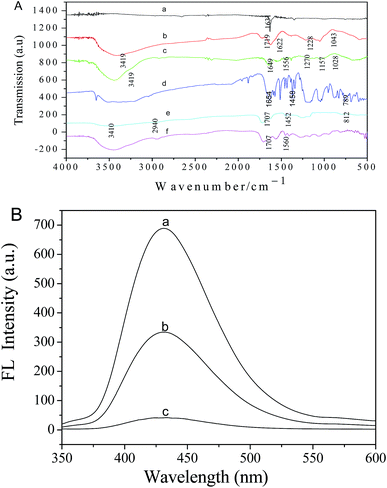
The structures of the natural graphite, GO, GO-NH2, ANS, PAA, and ANS-PAA samples are characterized using FTIR spectroscopy. As can be seen from Fig. 2, no significant bands were found in the FTIR spectrum of natural graphite. A large number of oxygen-containing functional groups are introduced when graphite is chemically treated to give GO. The strong absorption peak at 3419 cm−1 is assigned to O–H stretching vibrations, and the peak at 1719 cm−1 is assigned to carbonyl and carboxylic group C![[double bond, length as m-dash]](https://www.rsc.org/images/entities/char_e001.gif) O stretching vibrations. The peak at 1622 cm−1 is attributed to aromatic C
O stretching vibrations. The peak at 1622 cm−1 is attributed to aromatic C![[double bond, length as m-dash]](https://www.rsc.org/images/entities/char_e001.gif) C stretching vibrations, and the signals at 1228 and 1043 cm−1 are attributed to epoxy and alkoxy C–O vibrations. The differences between the natural graphite and GO spectra indicated that GO have been prepared successfully.22,23 As is shown in Fig. 2A spectrum c, the FTIR spectrum of GO-NH2 confirmed that the GO carboxyl groups and ethylenediamine amino groups are successfully conjugated. The peaks at 1649, 1556, and 1270 cm−1 are assigned to amide (–NHCO) group stretching vibrations. The carboxylic group bands found at 1719 cm−1 in the pristine GO spectrum are not present in the GO-NH2 spectrum, supporting our conclusion that amide linkages have formed. Other peaks at 3419 cm−1 (O–H stretching vibrations), 1157 cm−1 (epoxy C–O), and 1028 cm−1 (alkoxy C–O) are also found in the GO-NH2 spectrum, indicating that the expected chemical reaction have occurred and that the expected product GO-NH2 have been successfully prepared.20,21 The FTIR spectrum of ANS is shown in Fig. 2A spectrum d. The peaks at 1458 and 789 cm−1 are assigned to C–H bending vibrations, and the peak at 1654 cm−1 is attributed to N–H bending vibrations in the ANS amino groups. The peaks at 3410 and 1707 cm−1 in the FTIR spectrum of PAA (Fig. 2A spectrum e) are attributed to O–H and –C
C stretching vibrations, and the signals at 1228 and 1043 cm−1 are attributed to epoxy and alkoxy C–O vibrations. The differences between the natural graphite and GO spectra indicated that GO have been prepared successfully.22,23 As is shown in Fig. 2A spectrum c, the FTIR spectrum of GO-NH2 confirmed that the GO carboxyl groups and ethylenediamine amino groups are successfully conjugated. The peaks at 1649, 1556, and 1270 cm−1 are assigned to amide (–NHCO) group stretching vibrations. The carboxylic group bands found at 1719 cm−1 in the pristine GO spectrum are not present in the GO-NH2 spectrum, supporting our conclusion that amide linkages have formed. Other peaks at 3419 cm−1 (O–H stretching vibrations), 1157 cm−1 (epoxy C–O), and 1028 cm−1 (alkoxy C–O) are also found in the GO-NH2 spectrum, indicating that the expected chemical reaction have occurred and that the expected product GO-NH2 have been successfully prepared.20,21 The FTIR spectrum of ANS is shown in Fig. 2A spectrum d. The peaks at 1458 and 789 cm−1 are assigned to C–H bending vibrations, and the peak at 1654 cm−1 is attributed to N–H bending vibrations in the ANS amino groups. The peaks at 3410 and 1707 cm−1 in the FTIR spectrum of PAA (Fig. 2A spectrum e) are attributed to O–H and –C![[double bond, length as m-dash]](https://www.rsc.org/images/entities/char_e001.gif) O stretching vibrations, respectively. The peak at 2940 cm−1 is attributed to symmetrical stretching of –CH2– groups in the PAA chains, and the peaks at 1452 and 812 cm−1 are attributed to out-of-plane bending vibrations of the C–H bonds in the PAA. The FTIR spectra of ANS and PAA are used as reference spectra. We found a peak at 1560 cm−1 in the FTIR spectrum of ANS-PAA that is not found in the ANS or PAA spectra, and this new peak indicated that the –COOH groups in PAA have reacted with the –NH2 groups in ANS to form amide bonds.
O stretching vibrations, respectively. The peak at 2940 cm−1 is attributed to symmetrical stretching of –CH2– groups in the PAA chains, and the peaks at 1452 and 812 cm−1 are attributed to out-of-plane bending vibrations of the C–H bonds in the PAA. The FTIR spectra of ANS and PAA are used as reference spectra. We found a peak at 1560 cm−1 in the FTIR spectrum of ANS-PAA that is not found in the ANS or PAA spectra, and this new peak indicated that the –COOH groups in PAA have reacted with the –NH2 groups in ANS to form amide bonds.
Fluorescence recovery in the ANS-PAA/GO-NH2 system caused by interactions between protamine and ANS-PAA
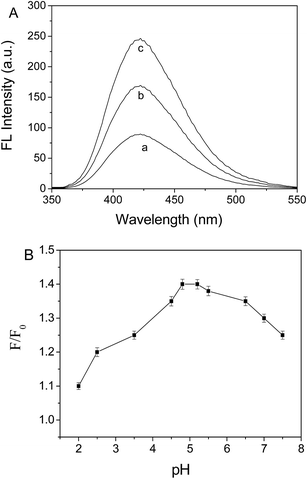
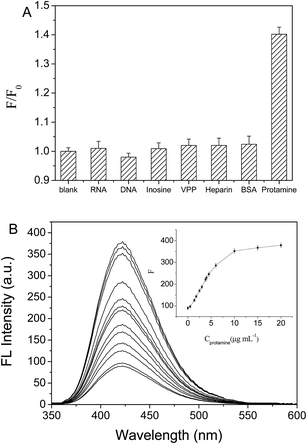
The ANS-PAA fluorescence spectra in the absence and presence of GO-NH2 are shown in Fig. 2B. ANS-PAA fluoresced strongly in the absence of GO-NH2 (Fig. 2B curve a), and the fluorescence was quenched to a remarkable degree in the presence of GO-NH2 (Fig. 2B curves b and c). However, the wavelength at which the maximum emission occurred and the spectral shape do not change markedly. The high quenching efficiency of GO-NH2 is caused by the ANS-PAA non-covalently binding to the GO-NH2 surfaces and Förster resonance energy transfer and electron transfer from the ANS-PAA to the GO-NH2 occurring. One reason for this would have been that the ANS-PAA, which has a high negative charge density, will have a strong binding affinity for the positively charged GO-NH2. The high quenching efficiency meant that a good signal-to-noise ratio would be achieved when a target analyte is detected using the system and, therefore, that the system would be sensitive and have a good dynamic range for the target analyte.24–26The ANS-PAA/GO-NH2 fluorescence sensor is tested using protamines at different concentrations in HEPES (at pH 5.2) at room temperature. As is shown in Fig. 3A, the ANS-PAA/GO-NH2 system fluoresced weakly, but adding protamines increased the fluorescence intensity, and the increase is related to the increase in the protamine concentration. This indicated that the protamines became bound to ANS-PAA in competition with the binding of ANS-PAA to the GO-NH2, causing ANS-PAA to become desorbed from the GO-NH2 surfaces. Protamines have more abundant negative charges than does GO-NH2, so protamines will interact more strongly with ANS-PAA than will GO-NH2. This allows protamines to remove ANS-PAA from the GO-NH2 surfaces, ANS-PAA/protamine complexes to form, and the ANS-PAA fluorescence to be recovered. We investigated the effect of the presence of protamines on the fluorescence of ANS-PAA (Fig. S2 in the ESI†), and we found that the fluorescence of ANS-PAA is not influenced by the presence of protamine. Therefore, the increase in the fluorescence of the system is attributed only to the ANS-PAA being removed from the GO-NH2 surfaces.
Optimization of the conditions for detecting protamines
The pH is one of the most important variables that affected the sensor system.27 The relative fluorescence intensity F/F0 (where F0 and F are the fluorescence intensities of the ANS-PAA/GO-NH2 system in the absence and presence of protamine, respectively) is determined at different pH values by performing fluorescence titration experiments using different initial pH values (between pH 2 and 7.5) with the sensor prepared in HEPES. It can clearly be seen from Fig. 3B that the fluorescence recovery efficiency decreased gradually as the pH increased from pH 5.2 to 7.5. This is probably because the protamine surfaces would have become less charged at higher pH values because the –NH3+ groups would have been deprotonated. This means that fewer and weaker electrostatic interactions would occur between the protamines and the ANS-PAA at higher pH values. Subsequent experiments were therefore performed at pH 5.2.Interference study
An excellent chemosensor needs to be highly selective.28,29 The selectivity of the sensor we developed for protamines was determined by using the sensor in the presence of various substances that could cause interference. We measured the fluorescence intensity of the probe in the presence of RNA, DNA, inosine, vitamin PP, heparin, or bovine serum albumin at 20 μg mL−1 using the same conditions. The effect of each potentially interfering substance on the fluorescence intensity of the probe is shown in Fig. 4A. Protamines very efficiently quenched the fluorescence, and the presence of the other substances hardly changed the efficiency at which the fluorescence was quenched. We therefore concluded that the probe is outstandingly specific and selective for protamines.Analytical parameters and analyses of samples
A plot of F, measured using the optimum conditions, against the protamine concentration (C, in micrograms per liter) had a linear range of 0–6 μg mL−1. The equation of the line was F = 83.1 + 34.97C, and the correlation coefficient (R2) is 0.994, as is shown in Fig. S3 in the ESI.† The limit of detection (Clim) is determined using the equation Clim = 3δ/k, where δ is the standard deviation of the concentrations found in the blanks (n = 10) and k is the slope of the calibration line. We investigated the practicality of using the system by using a standard addition method to determine the protamine concentrations in two samples. As is shown in Table 1, the concentrations found in the two samples were 103.6% and 104.2%, respectively, of the expected concentrations. These results indicated that the method can be used to determine protamine concentrations in samples accurately and reliably.| Sample | Added (μg mL−1) | Found (μg mL−1) | Recovery (%) | RSD (%) |
|---|---|---|---|---|
| Bovine serum samples (5%) | 0.0 | Not detected | — | — |
| 2.0 | 2.072 | 103.6 | 1.56 | |
| Human serum samples (5%) | 0.0 | Not detected | — | — |
| 4.0 | 4.168 | 104.2 | 1.85 |
Conclusions
We developed a new type of fluorescent probe, an ANS-PAA/GO-NH2 complex, for selectively and sensitively detecting protamines in aqueous solutions. The ANS-PAA fluorescence was effectively quenched by GO-NH2. The high quenching efficiency was caused by the ANS-PAA non-covalently binding to the GO-NH2 surfaces through electrostatic interactions, forming ANS-PAA/GO-NH2 complexes. The fluorescence of the system was recovered when protamines were added, and this was caused by the positively charged protamines removing ANS-PAA from the GO-NH2 surfaces to form ANS-PAA/protamine complexes. Under optimal conditions, the change in the fluorescence intensity was proportional to the protamine concentration. The linear range of the probe was 0 to 6.0 μg mL−1, and the detection limit was 0.4 μg mL−1. The novel fluorescent probe has a number of attractive analytical features, being environmentally friendly, very sensitive, very selective, and simple to use and giving very reproducible results. More importantly, the proposed method will provide a basis for the development of other GO-quenched fluorescent sensors.Acknowledgements
This work was supported by the National Natural Science Foundation of China (21205002) and the Innovation Funds of Anhui Normal University (No. 2014cxjj09).References
- D. Lochmann, S. Stadlhofer, J. Weyermann and A. Zimmer, Int. J. Pharm., 2004, 283, 11 CrossRef CAS PubMed.
- K. Suzuki and T. Ando, J. Biochem., 1972, 72, 1419 CAS.
- J. A. Carr and N. Silverman, J. Cardiovasc. Surg., 1999, 40, 659 CAS.
- B. K. Jena and C. R. Raj, Biosens. Bioelectron., 2008, 23, 1285 CrossRef CAS PubMed.
- G. A. Crespo, M. G. Afshar and E. Bakker, Angew. Chem., Int. Ed., 2012, 51, 12575 CrossRef CAS PubMed.
- A. Hvass and B. Skelbaek-Pedersen, J. Pharm. Biomed. Anal., 2005, 37, 551 CrossRef CAS PubMed.
- R. Cao and B. Li, Chem. Commun., 2011, 47, 2865 RSC.
- Z. Yao, W. Ma, Y. Yang, X. Chen, L. Zhang, C. Lin and H. Wu, Org. Biomol. Chem., 2013, 11, 6466 CAS.
- A. A. Ensafi, N. Kazemifard and B. Rezaei, Biosens. Bioelectron., 2015, 71, 243 CrossRef CAS PubMed.
- S. Pang, S. Y. Liu and X. G. Su, RSC Adv., 2014, 4, 25857 RSC.
- X. Chen, Y. Xiang, N. Li, P. Song and A. Tong, Analyst, 2010, 135, 1098 RSC.
- Q. Long, J. N. Zhao, B. D. Yin, H. T. Li, Y. Y. Zhang and S. Z. Yao, Anal. Biochem., 2015, 477, 28 CrossRef CAS PubMed.
- F. F. Xue, L. Z. Liu, Y. Y. Mi, H. Y. Han and J. G. Liang, RSC Adv., 2016, 6, 10215 RSC.
- Y. Cao, S. Shi, L. Wang, J. Yao and T. Yao, Biosens. Bioelectron., 2014, 55, 174 CrossRef CAS PubMed.
- Z. P. Liu, C. S. Tian, L. H. Lu and X. G. Su, RSC Adv., 2016, 6, 10205 RSC.
- Y. Zhou, X. J. Xing, D. W. Pang and H. W. Tang, RSC Adv., 2015, 5, 12994 RSC.
- Y. He and B. N. Jiao, RSC Adv., 2015, 5, 101327 RSC.
- J. Liu, G. Liu and W. Liu, Chem. Eng. J., 2014, 257, 299 CrossRef CAS.
- L. Fan, C. Luo, M. Sun, H. Qiu and H. Qiu, Synthesis of graphene oxide decorated with magnetic cyclodextrin for fast chromium removal, J. Mater. Chem., 2012, 22, 24577 RSC.
- S. Adewuyi, D. A. Ondigo, R. Zugle, Z. Tshentu, T. Nyokong and N. Torto, Anal. Methods, 2012, 4, 1729 RSC.
- X. Liu, Z. Wang, J. Zhu, Y. Zheng, S. Cui, M. Lan and H. Li, Colloids Surf., A, 2014, 448, 119 CrossRef CAS.
- Y. L. F. Musico, C. M. Santos, M. L. P. Dalida and D. F. Rodrigues, J. Mater. Chem. A, 2013, 1, 3789 CAS.
- W. Zhang, X. Shi, Y. Zhang, W. Gu, B. Li and Y. Xian, J. Mater. Chem. A, 2013, 1, 1745 CAS.
- J. F. Liang, R. Wei, S. He, Y. K. Liu, L. Guo and L. D. Li, Analyst, 2013, 138, 1726 RSC.
- J. Li, Y. Li, S. A. Shahzad, J. Chen, Y. Chen, Y. Wang, M. Yang and C. Yu, Chem. Commun., 2015, 51, 6354 RSC.
- S. Basiruddin and S. K. Swain, Mater. Sci. Eng., C, 2016, 58, 103 CrossRef CAS PubMed.
- K. Srinivasan, K. Subramanian, K. Murugan and K. Dinakaran, Analyst, 2016, 141, 6344 RSC.
- S. H. Jung, T. K. Hyun, J. Kim and J. H. Jung, RSC Adv., 2015, 5, 26662 RSC.
- A. Pandith, A. Kumar and H. Kim, RSC Adv., 2015, 5, 81808 RSC.
Footnote |
| † Electronic supplementary information (ESI) available. See DOI: 10.1039/c6ra24793h |
| This journal is © The Royal Society of Chemistry 2017 |

