 Open Access Article
Creative Commons Attribution 3.0 Unported Licence
Magnetic separation of clenbuterol based on competitive immunoassay and evaluation by surface-enhanced Raman spectroscopy†
Chao Wei,
Yi Zong,
Qinghua Guo,
Minmin Xu,
Yaxian Yuan and
Jianlin Yao*
College of Chemistry, Chemical Engineering and Materials Science, Soochow University, Suzhou, China. E-mail: jlyao@suda.edu.cn
First published on 13th January 2017
Abstract
The elimination of β-agonist has attracted considerable interest due to its harmfulness to human health when it existed in pork. Here, a strategy based on immuno-magnetic nanoparticles has been successfully developed for the selective and successive magnetic separation of two kinds of β-agonists, clenbuterol (CL) and salbutamol (SAL). The calibration curve of competitive immunoassay was determined for the estimation of the final concentration of targets after the separation, in which the limit of detection (LOD) and half maximal inhibitory concentration (IC50) were about 17 fg mL−1 and 193 pg mL−1, respectively. The specific interaction between the target and the complementary antibody attached to Fe3O4@Au nanoparticles resulted in the aggregation of Fe3O4@Au nanoparticles carried with targets. The magnetic collection of the aggregation of Fe3O4@Au nanoparticles decreased the concentration of targets significantly. The results revealed that the final concentration of remaining targets was lower than the LOD. This strategy was employed to separate CL and SAL molecules in mixed solutions simultaneously or successively with high efficiency. The results demonstrate that it provides a selective and effective approach for the removal of harmful residues in practical samples.
Introduction
Clenbuterol (CL) is a kind of β2-adrenergic agonistic drug which acts as an activator of β2 adrenoreceptors1 and is also used therapeutically as a broncho-dilating agent.2,3 β2-Adrenergic agonists are repartitioning agents for increasing skeletal muscle growth and the speed of contraction as well as decreasing fat deposition. Therefore, they have been widely used in feeding efficiency and carcass leanness increase for animal growth promotion.4,5 However, CL has been illegally used in the meat producing industry, while the abundant residues are very harmful to the health of consumers.2,4,6 Thus, the common uses of this sort of agonist are regulated or even prohibited and it is essential to develop rapid and sensitive approaches for the identification of the abuse of CL.3 Nowadays, many efforts have been made to detect the CL with reasonable sensitivities, such as gas chromatography-mass spectrometry (GC-MS),7,8 high-performance liquid chromatography (HPLC),9,10 capillary electrophoresis (CE),11,12 ion chromatography (IC)13 and so on. However, few attention was paid on the separation and removal of CL from the polluted mediate.In the past few decades, magnetic nanoparticles have attracted great interests in biological fields.14,15 For iron and its oxides (FexOy), they were usually employed for magnetic separation, enrichment and targeted drug delivery.16–18 However, the poor surface functionalization and biocompatibility limited their practical applications in biological system. Therefore, complex nanoparticles, such as core–shell and hybrid structures, were engaged.19,20 Besides, these nanoparticles exhibited many advantages, such as, easy preparation and surface functionalization, controllable size distribution, and long-term stability as well as biocompatibility for protein bindings, which were completely different from the pure iron oxides nanoparticles, particularly for the noble metal shell with unique optical properties.21,22 For example, Au and Ag nanoparticles are most commonly used for ultrasensitive detection due to their surface plasmon resonance (SPR). It resulted in the Raman scattering signals from the adsorbed molecules to be greatly amplified, called surface-enhanced Raman spectroscopy (SERS).23–25 Therefore, the combination of FexOy and Au supplied an ideal platform for the multi purposes applications. The core–shell structures (FexOy@Au) integrated the functions of the two kinds of materials, including magnetic response for separation and SERS performance for detection.26–28 Up to now, there are some reports about the magnetic separations and detections of proteins by SERS-based immunoassay using the bifunctional core–shell nanostructures. For example, Park et al. introduced anti-rabbit IgG-modified Fe-oxide@Au to capture and enrich BSA- or protein A-capped Au nanoparticles.29 The kinds of the targets as well as concentrations could be determined through the change in SERS intensities of magnetic immunocomplex, which showed high specificity and sensitivity. Fan et al. applied M3038 antibody-modified popcorn-shaped Fe@Au magnetic core–shell nanoparticles to separate Salmonella DT104 which achieved high performance.30 In our previous studies, Bao et al. utilized water-soluble goat-anti-human antibody-modified γ-Fe2O3@Au magnetic core–shell nanoparticles to separate human IgG antigen specifically, whose separation efficiencies could be evaluated by sandwiched structure immunoassay.23 Afterwards, Chen et al. extended the experiment system to tri-components of rabbit IgG, human IgG and mouse IgG mixed antigens to realize their separations successively or simultaneously with high specificity, i.e. the mismatched antigens still remained in the solution, while concentrations of the targets decreased dramatically at the level of the LOD of immunoassay strategy.31
Generally, the complementary binding between the target and its corresponding antibody was employed to recognize the target residues. Thus, the target residues were captured and enriched by the target antibody modified-nanoparticles. The target–target antibody modified-nanoparticles could be separated through centrifugation. However, some nanoparticles carried with targets still dispersed in the solution which decreased the separation efficiency. After the introduction of magnetic core to form Fe3O4@Au nanoparticles, the separation efficiency was improved dramatically by an external magnetic field to enrich and collect the aggregation of Fe3O4@Au nanoparticles carried with target residues. As a consequence, the concentration of the target residues in the solution decreased dramatically. Therefore, the detection of remaining target is essential for evaluating the separation efficiency. However, due to the ultralow concentration of free target residues in solution after magnetic separation, the highly sensitive technique was essential for determining the concentration of the target remained in the solution. To our best knowledge, Fe3O4@Au nanoparticles have been rarely used in the separation of the CL residues. Although Cheng et al. ever reported the extraction of pure CL from the mixed animal urine samples by CL antibody-modified magnetic beads, the beads were only served as a purification tool for direct SERS detection on graphene oxide/Au nanoparticles (GO/AuNPs), and SERS-based immunoassay technique was not introduced.32 In order to separate the CL residues, two key issues should be involved, i.e. the capture of CL residues and the evaluation of separation efficiency. For the former, the CL antibody-modified Fe3O4@Au nanoparticles allowed to capture the CL residues specifically and efficiently, and the composite nanoparticles were then magnetically enriched and removed. For the latter, due to the ultralow content of the target residues after separation, a rapid and sensitive approach is highly desired to determine the concentration of remaining targets. Although lots of techniques were developed to directly determine the concentration, their sensitivity was still not enough to fit the requirements.7–13 Actually, enzyme-linked immunosorbent assay (ELISA) has become a promising strategy for the detection of CL residues with the limit of detection (LOD) of about hundred pg mL−1.33,34 Fan et al. ever combined automated immunoassay magnetic separation with ELISA for the detections of CL performed in sterile disposable test strips with several wells.35 It still remains a significant challenge to develop ELISA as an approach for evaluating the separation efficiency.
Surface-enhanced Raman scattering (SERS) is a nano-based optical phenomenon, which can greatly enhance the normal Raman signal intensities from probe molecules down to single molecule level.36,37 Thus, it can remarkably decrease the LOD and it was employed as a highly sensitive tool for trace detection in biological fields.38,39 Moreover, SERS has been shown to be a powerful and general technique for detecting trace analyte because of its extremely high sensitivity and rich spectral fingerprint,40–42 thus, SERS has been already developed as a promising tool for a rapid, highly sensitive readout strategy in analytical science.
Immunoassay is a fast and cost-effective method based on antigen–antibody bindings which is widely applied in biological, biochemical, environmental and food safety fields due to its very satisfactory specificity, sensitivity and ease of handling.6,23,24,43,44 The earliest report that combined immunoassay with SERS could date back to 1989 when Rohr detected thyroid stimulating hormone (TSH) antigen using surface-enhanced resonance Raman spectroscopy (SERRS).45 Since then, SERS-based immunoassay has become a progressively popular approach for the analysis of proteins, such as human IgG antigen and rabbit IgG antigen.46,47 Recently, Zhu and his coworker developed a novel approach to detect CL by SERS-based competitive immunoassay with wider concentration range and lower LOD of about one hundred fg mL−1.48 Moreover, the procedure was significantly simplified by comparison with the conventional methods. Afterwards, Deng's group reported the determination of CL by immunochromatographic assay (ICA) on an ICA strip also by SERS-based competitive immunoassay.49 As a consequence, SERS-based competitive immunoassay could be employed as a qualified candidate for determining the concentration of the target residues after the magnetic separation. Although SERS-based competitive magnetic immunoassay has already been applied to the detections of some micromolecules such as chloramphenicol,50 combination of effective and selective separation of micromolecule residues in the solution by magnetic materials to decrease their concentrations with evaluation by SERS-based competitive immunoassay is rarely reported so far. Thus, it could be employed to evaluate the separation efficiency.
Here, the magnetic separation on targets was developed to reduce the concentration of residues. The CL monoclonal antibody-modified immuno-Fe3O4@Au core–shell nanoparticles, marked as (Fe3O4@Au)–CLab, were employed to capture the CL residues in the solution through the specific bindings between the CL and CL antibody. The (Fe3O4@Au)–CLab with CL was collected by an external magnetic field and it allowed a dramatic decrease in the concentration of CL residues. The efficiencies were evaluated through the determination on concentrations of CL residues in the supernatants before and after magnetic separation by the SERS-based competitive immunoassay approach. In addition, CL and SAL bi-component mixed solutions were also separated by (Fe3O4@Au)–CLab and (Fe3O4@Au)–SALab, successively or simultaneously.
Experimental section
General
Iron chloride hexahydrate (FeCl3·6H2O), trisodium citrate dihydrate (Na3C6H5O7·2H2O), ethylene glycol (EG), chloroauric acid tetrahydrate (HAuCl4·4H2O), and the relevant chemicals were purchased from Sinopharm Chemical Reagent Co., Ltd; sodium acetate (NaAc), Tween-80 and tris-(hydroxymethyl)aminomethane (Tris) were obtained from Chinese Pharmaceutical Group Shanghai Chemical Reagent Company; tetrakis(hydroxymethyl)phosphonium chloride (THPC) and mercaptobenzoic acid (MBA, C7H6O2S) were acquired from Tokyo Chemical industry Co., Ltd; aminopropyltrimethoxysilane (APTMS) was got from Alfa Aesar; bovine serum albumin (BSA) was purchased from Biosharp.CL standard powder sample, CL coupling bovine serum albumin (CL–BSA) monoclonal antibody (concentration: 9.5 mg mL−1) and CL coupling ovalbumin (CL–OVA) coated antigen (concentration: 17 mg mL−1) were purchased from Guangzhou Food-safe Biotechnology Co., Ltd. SAL standard powder sample, SAL monoclonal antibody (concentration: 18 mg mL−1) and SAL coated antigen (concentration: 16.5 mg mL−1) were purchased from Suzhou Industrial Park Entai Reagent Co., Ltd.
A kind of biological substrate produced by Full Moon BioSystems in the USA was used for SERS detection. The substrate was firstly plated with a Ni–Cr thin layer and secondly deposited with a layer of silver membrane on the quartz glass. Finally, high polymers with carboxyl groups at the end of them were applied to modify the surface. There are two advantages with the processes: proteins could form vertical arrangements on the surface of the substrate as well as retention of the biological activity.
All aqueous solutions were prepared using Milli-Q water (resistivity ≥ 18 MΩ cm). The buffer solutions of phosphate-buffered saline (PBS, pH 7.2–7.4), borate buffer (BB, pH 9.2), tris-buffered solution (TBS, pH 7.2–7.4) and tris-buffered solution/0.1% Tween (TBST, pH 7.2–7.4) were prepared based on the routine method.
Characterizations
SERS experiments were performed on a HR800 confocal micro-Raman spectrometer with an excitation laser of 632.8 nm. The hole and slit width were 400 μm and 100 μm, respectively. The objective magnification was 50× with long focus distance of about 8 mm. The laser power was about 10 mW on the sample surface with the exposure time of 5 s. Scanning electron microscopy (SEM) and transmission electron microscope (TEM) images were recorded by Hitachi S-4700 and TECNAI F30, respectively.Preparation of Au and Fe3O4@Au nanoparticles
The preparation of 55 nm Au nanoparticles was referred by Frens' method.51 Briefly, 100 mL of 0.01% (wt) HAuCl4 solution was heated to the boiling point in the condition of reflux under vigorous agitation. 0.75 mL of 1.14% (wt) trisodium citrate solution was instantly added. The color of the solution turned to purple-dark in the first 2 min, indicating the formation of the Au nuclei. Afterwards, the color turned to purplish red, manifesting the growth of the Au nuclei. The solution was kept boiling for another 15 min and cooled down to room temperature. According to Zhao's method:52 0.65 g of FeCl3·6H2O and 0.2 g of trisodium citrate dihydrate were added to 20 mL of EG with ultrasonic agitation. 1.2 g of NaAc powder was added under the condition of stirring for 0.5 h. Then the mixed solution was transferred to polytetrafluoroethene-lined reaction kettle with the volume of 50 mL. The system was kept heating at 200 °C for 10 h and cooled down to the room temperature. After the supernatant was discarded, the rest black Fe3O4 nanoparticles were washed for many times with magnetic enrichment and dispersed in 20 mL of water in reserve.The APTMS was used as a coupling agent to attach the small Au nanoparticles.53 It was served as the seeds for formation of the continuous Au shell in HAuCl4. Briefly, 1 mL of the prepared Fe3O4-2 nm Au dispersion was added to 16 mL of Au precursor solution (200 mL of water containing 0.05 g of K2CO3 and 4 mL of 1% HAuCl4 solution) with ultrasonication and 100 μL of 37% HCHO (aq) was added with stirring. The magnetic sediments were washed with water for several times until the supernatant was colorless and then dispersed in 4 mL of BB solution in reserve.
Preparation of immuno-Au and immuno-Fe3O4@Au nanoparticles
The surface modification procedures were similar to the report by Ni et al.47 Briefly, 1 mL of 55 nm Au was centrifugated and resuspended in BB solution, then 2.5 μL of 1 mmol L−1 MBA solution (in ethanol) was added and oscillated for about 1 h to immobilize the molecules on the surfaces of Au nanoparticles. Next, 1 μL of 9.5 mg mL−1 CL monoclonal antibody (CLab) was added and incubated for 2–3 h to immobilize antibody on the surfaces of Au nanoparticles. After being centrifugated and resuspended in BB solution, 10 μL of 5% (wt) BSA solution was added and incubated for 1 h to block the active sites on Au surfaces. Then the immuno-Au nanoparticles solution was centrifugated and resuspended again in 1 mL of BB solution for further use.The preparation of CL monoclonal antibody-modified immuno-(Fe3O4@Au) ((Fe3O4@Au)–CLab) was similar to the modification procedure of CLab onto Au nanoparticles. 5 μL of 9.5 mg mL−1 CLab solution was added into the above Fe3O4@Au solution and incubated for about 3 h. After being separated by an external magnetic field and resuspended in 4 mL of BB solution, 40 μL of 5% (wt) BSA solution was added and incubated for 1 h to block the remaining active sites on surfaces of Fe3O4@Au nanoparticles. Finally, the sediments were collected by a magnetic field and redispersed in 4 mL of BB solution prior to further use. It should be pointed that the DLS measurements indicated the immobilization of SERS labels and antibody on the Au nanoparticles.
Competitive immunoassay protocol of CL
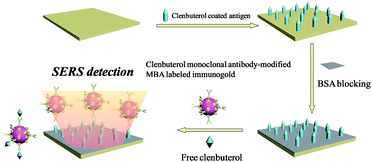
CL coated antigen (CLag) was immobilized on the biological substrate for SERS detections. Firstly, 100 ng mL−1 of CLag solution was dropped onto the solid substrate (from Full Moon). Secondly, the substrate was placed into a chamber with a relative humidity of 65–75% (a beaker containing 200 g of NaCl and 80–100 mL of H2O) overnight for about 12 h. After being taken out and exposed to the air for 30 min, 5% (wt) BSA solution was applied to blocking the active sites on the surface. Finally, the substrate was rinsed with Milli-Q water for several times and dried by nitrogen.A series of different concentrations of original CL aqueous solutions (1 mL) were used for competitive immunoassay protocol. The main principle was shown in Scheme 1. After the BSA-blocked CLag-modified substrate was immersed in CL solution for a while, MBA-labeled immuno-Au nanoparticles were added. The whole system was oscillated and incubated for about 4 h. Finally, the substrate was taken out, rinsed with TBST, TBS and Milli-Q water repeatedly in turn to remove the non-specific bindings of immuno-Au nanoparticles on the surface to a certain extent and dried by nitrogen. Here it should be noted that the choice of concentration of immuno-Au nanoparticles was important, for that too many particles would bind with target CL molecules quickly and were unfavorable to the decrease of absolute SERS intensities for standard samples; while too few particles were against absolute intensities of the blank sample as well as a wide concentration range for detections.
Magnetic separations of CL solutions by immuno-Fe3O4@Au
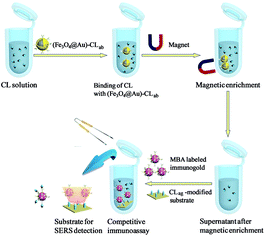
Scheme 2 presented the schematic diagram of magnetic separations and the evaluation on the separation efficiency by SERS-based competitive immunoassay. Typically, certain quantities of the above (Fe3O4@Au)–CLab solutions were enriched by a magnet and the aggregation was then transferred into the original CL aqueous solutions. The mixture was oscillated and incubated for about 3 h. The aggregation was collected from solution after applying an external magnetic field, and the supernatant was removed from the precipitate for the further evaluation on the separation efficiency. It should be mentioned that the excess immuno-Fe3O4@Au nanoparticles were added in order to capture the free CL residues completely. It was beneficial to promise the high efficiency of separation. The evaluation was based on the SERS competitive immunoassay as mentioned above.Results and discussion
Morphology characterizations of nanoparticles
Fig. 1 and 2 show a series of TEM and SEM images of various nanoparticles, including Au, Fe3O4 and Fe3O4@Au. One can find that the average diameter of spherical Au nanoparticles was about 55 nm (as shown in Fig. 1A) which was contributed favorable SERS effect and stability. The size of Au nanoparticles was adjusted through the quantity of trisodium citrate and the concentration of HAuCl4.54 The small Au nanoparticles (diameter of 2 nm) exhibit a reasonable dispersion and uniformity which are beneficial to serve as seeds for the formation of continuous Au shell (as shown in Fig. 1B). It was found that the diameter of the prepared Fe3O4 nanoparticles was about 250 nm and the single particle was integrated by a number of tiny Fe3O4 crystalline grains (as shown in Fig. 2A and D). Generally, the small grains owned superparamagnetic properties and aggregated to form large particles which were stabilized by citrate in the solution. Fig. 2B and E indicated unambiguously the attachment of small Au nanoparticles (seeds) onto Fe3O4 nanoparticles. Moreover, the aggregations of the attached Au nanoparticles bring the rough surfaces (black dots, as shown in Fig. 2E). After the growth in the HAuCl4 solution, a continuous Au shell was attached onto the Fe3O4 core (Fig. 2C and F). It was apparently found that the particle sizes were enlarged to about 350 nm due to the coating of Au shells, suggesting the thicknesses of Au shells of about 50 nm.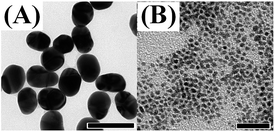 | ||
| Fig. 1 TEM images of Au nanoparticles with the diameter of about 55 nm (A) and 2 nm (B). Scale bar: ((A) 100 nm; (B) 20 nm). | ||
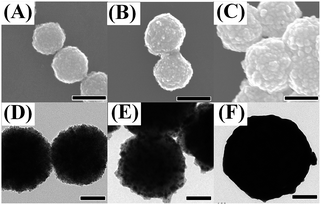 | ||
| Fig. 2 SEM and TEM images of Fe3O4 (A and D), Fe3O4-2 nm Au (B and E) and Fe3O4@Au (C and F) (scale bar: 250 nm for (A–C) and 100 nm for (D–F)). | ||
Characterizations of prepared nanoparticles
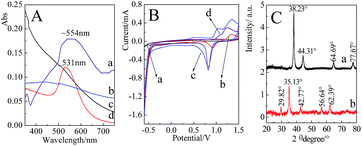
Fig. 3A presents the UV-Vis spectra of the prepared nanoparticles. It was found that the extinction band was absent for the 2 nm Au nanoparticles at the range of 350 nm to 750 nm,55 while a distinct extinction band at ∼531 nm with a relatively narrow band width was observed in the Au nanoparticles (55 nm) solution. Compared with the pure Au nanoparticles, an extinction band at ∼554 nm was observed after Fe3O4 was coated by a continuous Au shell. Since Au shell was formed by the reduction of HAuCl4 onto the surface of Fe3O4, the uniformity of shell thicknesses was decreased accordingly, which resulted in a relatively wider width of extinction band.Cyclic voltammetry (CV) measurements of the different nanoparticles are presented in Fig. 3B. Three-electrode system was employed in the present case, the nanoparticles-modified glassy carbon as working electrode, saturated calomel electrode (SCE) as reference electrode and platinum as auxiliary electrode. For the Fe3O4 attached with Au seeds and Fe3O4@Au nanoparticles, two dominant peaks at about 1.2 V and 0.8 V were similar to those of Au nanoparticles, which were contributed by the oxidation and reduction of Au surface, respectively. The shifts in the peak potential were mainly due to the difference in the size of Au seeds, nanoparticles and shell thicknesses. The observation of characteristic electrochemical behavior suggests that Au shell has attached to or covered the outside of Fe3O4.
Fig. 3C presents the XRD patterns of Fe3O4@Au and Fe3O4 nanoparticles. Five diffraction peaks located at 29.82°, 35.13°, 42.77°, 56.64° and 62.39° for Fe3O4 were originated from the (220), (311), (400), (511) and (440) faces, respectively.56 After the encapsulation of Au shell at the surfaces of Fe3O4, the main diffraction peaks at 38.23°, 44.31°, 64.69° and 77.67° were indexed to (111), (200), (220) and (311) faces of Au, respectively.57 The appearance of relevant diffraction peaks of Au and the disappearance of diffraction peaks of Fe3O4 confirmed the formation of Fe3O4@Au core–shell nanostructures.
Optimization on the SERS-based competitive immunoassay
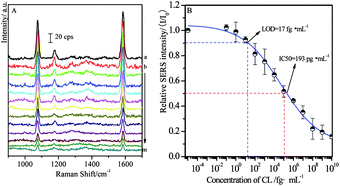
In order to estimate the concentration of remaining targets, a calibration curve was determined based on the relationships between SERS intensities of labeled MBA and concentration of CL residues. As shown in Fig. 4A, the main SERS peaks located at 1077 cm−1 and 1588 cm−1 were assigned to υ12 and υ8a aromatic ring vibrational modes, respectively.58 With the increase of the concentrations of free CL target, SERS intensities from MBA label adsorbed on the solid substrate decreased accordingly. It is mainly because that more MBA labeled immuno-Au nanoparticles bound to free CL, leading to fewer of them bound to CLag on the substrate through competitive reactions. As a consequence, it brought definitely the decrease in the SERS signal. Therefore, the maximum SERS intensity was achieved in the blank sample, while the SERS signal disappeared as the concentration of target was enough high for capturing all of the immuno-Au nanoparticles. In the present case, BB solution without free CL was served as blank sample and the recorded SERS intensity was defined as I0. It is well known that the decrease in SERS by 10% is associated with the confirmation of target, which is defined as LOD of SERS-based competitive immunoassay. In our experimental conditions, the value of LOD is about 17 fg mL−1 estimated from Fig. 4B, indicating the decrease of about six times in LOD by comparing with the previous studies with the similar strategy.48 It was mainly due to the optimization on the modification of the solid substrate and immuno-Au nanoparticles as well as the SERS activities of Au nanoparticles. Meanwhile, the concentration of target CL at half SERS intensity of the blank sample (I/I0 = 50%) is defined as IC50 (half maximal inhibitory concentration), which represents the concentration of the inhibitor CL that is required for 50% inhibition of the reaction between CLab and CLag. The value of IC50 is determined to be about 193 pg mL−1. Although the calibration curve was not a linear relationship, it was an essential standard for the estimation of the concentration of target residues.The influence of SAL on CL competitive immunoassay
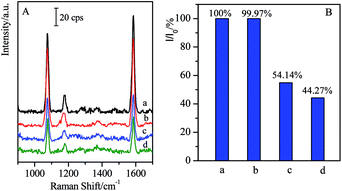
As another kind of β-agonist, SAL is often misused in sportsmen to improve their match performances.59 Here it was introduced to investigate its cross reactions with CL and the specificity of the CL competitive immunoassay system.As 1 ng mL−1 of SAL solution is added instead of CL in competitive reactions, the SERS intensity has only about 5.83% decrease compared with the blank sample, while 1 ng mL−1 of CL allows the observation on 44.27% of the SERS intensity (I0), i.e. 55.73% of SERS intensity (I0) disappears (as shown in Fig. 5). It indicated that the influence of the SAL on the CL competitive immunoassay was negligible, and high specificity of this approach allows us to qualitatively analysis the target with high-accuracy.
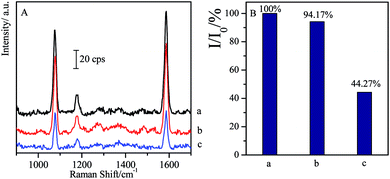 | ||
| Fig. 5 Comparison of SERS spectra of non-specificity of SAL with specificity of CL through competitive immunoassay ((a) blank; (b) 1 ng mL−1 of SAL; (c) 1 ng mL−1 of CL). | ||
Magnetic separation of CL and evaluation on efficiency
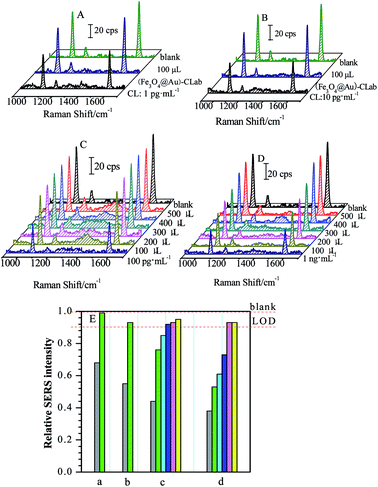
Four CL solutions with different concentrations of 1 pg mL−1, 10 pg mL−1, 100 pg mL−1 and 1 ng mL−1 were used as samples for the investigation and evaluation of magnetic separations, respectively. Fig. 6 presents a series of SERS spectra obtained by the competitive immunoassay before and after the magnetic separations.One can find that the SERS intensities increased accordingly after the (Fe3O4@Au)–CLab solution was added and enriched by a magnetic field. Table 1 presents the changes in the relative SERS intensities before and after the magnetic separation. Based on the above result (Fig. 4), the relative SERS intensities I/I0 = 90% suggested the final concentration of targets approached to LOD. In our present case, four values of I/I0 after magnetic separations were all more than 90% (Table 1), suggesting the concentration of remaining CL was lower than the LOD of the SERS-based competitive immunoassay, i.e. less than 17 fg mL−1. It reveals that the concentration of CL in the original solution is decreased dramatically after the magnetic separation. Normally, the CL residues were attached onto the (Fe3O4@Au)–CLab immuno-nanoparticles through the specific complementary interaction and collected by the magnetic fields. As a consequence, the number of (Fe3O4@Au)–CLab immuno-nanoparticles becomes the key issue for increasing the separation efficiency. For the above different concentrations of CL solutions, with the increase in the volumes of added (Fe3O4@Au)–CLab, there is a tendency which the concentrations of remaining CL residues reach or are even lower than LOD. Therefore, the more the quantities of (Fe3O4@Au)–CLab were added, the more free CL residues were captured and separated by an external magnetic field, resulting in the stronger SERS signal of labels from the competitive immunoassay.
| Concentrations | Relative SERS intensities (I/I0) of band at ∼1588 cm−1 | |
|---|---|---|
| Before separation | After separation | |
| a Note: the volume of (Fe3O4@Au)–CLab solution was 100 μL for 1 and 10 pg mL−1, and 500 μL for 100 pg mL−1 and 1 ng mL−1 of CL original solutions. | ||
| Blank | 1.00 | — |
| 1 pg mL−1 | 0.68 | 0.99 |
| 10 pg mL−1 | 0.55 | 0.93 |
| 100 pg mL−1 | 0.44 | 0.95 |
| 1 ng mL−1 | 0.38 | 0.93 |
In the present case, small volume of (Fe3O4@Au)–CLab was required for magnetic separation on CL residues with low concentration. For the target concentrations lower than 10 pg mL−1, 100 μL of (Fe3O4@Au)–CLab immuno-nanoparticles solution was adequate to capture most of CL molecules in the target solutions, and the concentration of final remaining target reached the LOD of SERS-based immunoassay (as shown in Fig. 6A and B). As the CL concentrations increased to 100 pg mL−1 and 1 ng mL−1 (Fig. 6C and D), 100 μL of the added (Fe3O4@Au)–CLab solution contributed the low separation efficiency (as shown in Table 2). With the increase in the number of the (Fe3O4@Au)–CLab nanoparticles, the relative intensity (I/I0) was improved to close to 1, suggesting the complete separation of free CL residues. For example, the 300 μL of (Fe3O4@Au)–CLab solution was reasonable amount for capturing completely the CL molecules with the concentration of 100 pg mL−1, while 400 μL of (Fe3O4@Au)–CLab solution was required for 1 ng mL−1 of CL solutions.
| CL original concentration | I/I0 after adding different volumes of (Fe3O4@Au)–CLab solution | ||||
|---|---|---|---|---|---|
| 100 μL | 200 μL | 300 μL | 400 μL | 500 μL | |
| 100 pg mL−1 | 0.76 | 0.85 | 0.92 | 0.93 | 0.95 |
| 1 ng mL−1 | 0.53 | 0.61 | 0.73 | 0.93 | 0.93 |
However, with the further increase of volumes of (Fe3O4@Au)–CLab solution, the trend of relative intensity (I/I0) is toward to be constant of 1. It indicates that SERS intensities are comparable to the blank sample after magnetic separations. Therefore, it is reasonable to assume that the CL residues were successfully separated by the (Fe3O4@Au)–CLab solution with high efficiency. It should be pointed out that the excess free (Fe3O4@Au)–CLab nanoparticles were enriched by the magnetic field together with the CL binding (Fe3O4@Au)–CLab nanoparticles.
The specificity of separation on CL
Generally, the complementary interaction between the CL and the corresponding antibody resulted in the magnetic separation with high specificity. In order to verify the influence of other residues, the SAL with similar structure was employed as the coexist species to verify the specific separation. In the present case, the SAL monoclonal antibody-modified immuno-Fe3O4@Au, marked as (Fe3O4@Au)–SALab, was selected to investigate its influence on the cross reactions with CL in the target solutions as well as the specificity of the magnetic separation strategy. Typically, 500 μL of (Fe3O4@Au)–SALab solution (with the same concentration as (Fe3O4@Au)–CLab) was added into the CL target solution with the concentration of 1 ng mL−1. The immunoassay SERS intensity from the final solution was presented in Fig. 7 together with the similar separation by specific (Fe3O4@Au)–CLab solution as comparison.After the introduction of (Fe3O4@Au)–SALab into the CL solution and separation of the magnetic immuno-nanoparticles, the relative SERS intensity (I/I0 = 54.14%, Fig. 7B(c)) was still comparable to that from the original 1 ng mL−1 of CL solution (I/I0 = 44.27%, Fig. 7B(d)). Based on the calibration curve of SERS competitive immunoassay (as shown in Fig. 4B), I/I0 = 54.14% corresponded to the CL concentration of about 0.91 ng mL−1, while I/I0 = 44.27% corresponded to the CL of about 0.94 ng mL−1. It revealed that the CL concentration was lowered slightly after the non-specific magnetic separation. It was mainly contributed that a small number of CL residues were adsorbed onto the unblocked active sites of Fe3O4@Au nanoparticles surfaces and finally collected by the magnetic enrichment. However, as using (Fe3O4@Au)–CLab to separate 1 ng mL−1 of CL in the target solution, the relative SERS intensity (I/I0 = 99.97%) was comparable to the blank sample. It indicated that the remaining CL residues in the solution were lower than the LOD of SERS-based competitive immunoassay (LOD = 17 fg mL−1), i.e. the free CL molecules were captured by the (Fe3O4@Au)–CLab nanoparticles and separated by a magnetic field completely. Although the slight decrease in CL concentration was determined after the introduction of (Fe3O4@Au)–SALab nanoparticles, one can still assume that no significant influence of the non-specific (Fe3O4@Au)–SALab was observed in the separation of CL targets. Based on the above results, one can assume that (Fe3O4@Au)–CLab nanoparticles exhibited stronger capabilities in specific binding with free CL target compared with (Fe3O4@Au)–SALab. It also clearly demonstrates that the magnetic immuno-nanoparticles for magnetic separation exhibited high specificity and efficiency.
Magnetic separation on bi-components of CL and SAL
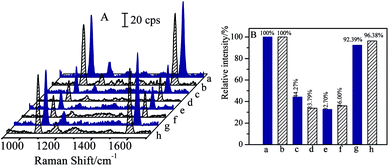
Bi-components magnetic separation and detection have been attracted considerable interests in practical applications. As CL and SAL are of β2-adrenergic agonists with very similar molecular structures, and are usually misused in meat producing industry or competitions, it is essential to realize the separations of CL and SAL mixture solutions efficiently and specifically.The mixture solution contained 1 ng mL−1 of CL and 1 ng mL−1 of SAL was employed as the case for verifying the capability in separation of bi-components. Before the magnetic separation, the original concentrations of CL and SAL were determined respectively by SERS-based immunoassay (as shown in Fig. 8e and f). For the clear demonstration and comparison, the SERS spectra of blank solution and the mono-component CL or SAL solution (same concentration) were attached together (as shown in Fig. 8a, b, c and d). By comparing with the SERS intensity (I0) from the blank solution, the SERS intensities (I) from the original target solution (containing CL and SAL) were decreased accordingly, indicating the coexistence of the CL and SAL in the solution. In order to verify the determination on the concentration, the relative SERS intensities (I/I0) were determined from the mono-component target solution with the same concentration. The I/I0 values were 32.70% for 1 ng mL−1 of CL and 36.00% for 1 ng mL−1 of SAL in the mixture solution (as shown in Fig. 8e and f). Therefore, the I/I0 values from the mixture solution were comparable to that of the mono-component target, indicating the concentrations of CL and SAL closely approximated to 1 ng mL−1. It should be pointed out that the negligible differences in SERS intensity were observed for the blank samples (Fig. 8a and b) or 1 ng mL−1 of standard target samples (Fig. 8c–f). It was mainly due to the deviation in SERS intensities of the immuno-nanoparticles, such as the aggregation and SERS activities. After the introduction of same volumes of (Fe3O4@Au)–CLab and (Fe3O4@Au)–SALab solutions, the magnet was applied to collect the nanoparticles which carried with the corresponding targets of CL and SAL. The CL and SAL competitive immunoassay strategies were performed on the supernatants, respectively. The resulted SERS spectra were presented in Fig. 8g and h. It is observed unambiguously that the SERS intensity (I) was increased to close to that of the blank solutions, i.e. the relative intensities (I/I0) were about 92.39% for CL and 96.38% for SAL. It indicated unambiguously that both of the concentrations of final remaining CL and SAL were lower than the LOD of competitive immunoassay. It was reasonable to assume that the CL and SAL were totally separated together.
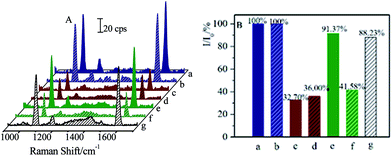
Moreover, successive separations of CL and SAL residues were also performed. After being separated by the (Fe3O4@Au)–CLab solution, the CL residues were attached onto the (Fe3O4@Au)–CLab nanoparticles and then collected by a magnetic field, while the SAL was still remained in the solution. Followed with this procedure, the (Fe3O4@Au)–SALab nanoparticles solution was introduced into the supernatants to capture the SAL residues. After each separation procedure, the CL or SAL competitive immunoassay was then applied to the remaining solution. Fig. 9 presents the SERS spectra and relative SERS intensities (I/I0) from each separation procedures.
Before the separation, the original I/I0 for CL and SAL with the concentration of 1 ng mL−1 were about 32.70% and 36.00%, respectively. It was comparable to the calibration curve of CL as presented in Fig. 4. After the first separation by (Fe3O4@Au)–CLab, the relative SERS intensity (I/I0) of about 91.37% for CL indicated that the concentration of remaining CL was too low to be detected by the immunoassay strategy (as shown in Fig. 9e). However, the relative SERS intensity (I/I0) of about 41.58% for SAL demonstrated that the SAL was still remained in the solution (as shown in Fig. 9f). Therefore, the (Fe3O4@Au)–CLab allowed distinctly the separation of CL rather than SAL residues, and it provided an effective approach for separating the targets selectively. As the (Fe3O4@Au)–SALab was applied into the above solution and evaluated by the SAL competitive immunoassay, the value of I/I0 increased to be about 88.23%. It was close to 90% which was defined as the LOD for demonstrating the capability of immunoassay approach (Fig. 9g). Therefore, it is reasonable to assume that the remaining SAL residues were completely separated as well and the residual concentration of the SAL in supernatant tended to be the LOD at the fg mL−1 level. This strategy allowed us to separate on different targets selectively and successively in mixture solutions. The magnetic separation on the CL in the real pig hair samples was presented in the ESI (Fig. S1 and S2†). It demonstrated that this strategy exhibited promising capacity in separating residues in the real samples.
Conclusions
The strategy based on the immuno-magnetic nanoparticles has been successfully developed for the selective and successive separation of CL and SAL. The selective separation was achieved by the specific interaction between the target and the complementary antibody attached to Fe3O4@Au nanoparticles. Therefore, the targets were immobilized onto Fe3O4@Au immuno-nanoparticles and the aggregated Fe3O4@Au nanoparticles carried with targets were collected by an external magnetic field. The SERS-based competitive immunoassay was optimized to determine the remaining target concentration in the solution after the separation. Thus the separation efficiency was evaluated accordingly. By comparing the change in the relative SERS intensities (I/I0) before and after magnetic separation, the final approximate concentration of remaining target was estimated. The results revealed that the concentration of remaining CL was decreased by about several orders of magnitude after magnetic separation. With the sufficient Fe3O4@Au immuno-nanoparticles, the final concentration of remaining targets was lower than the LOD (at fg mL−1 level) of SERS-based competitive immunoassay. Furthermore, CL and SAL targets in mixed solutions could be separated simultaneously or successively by the addition of their specific antibody-modified immuno-Fe3O4@Au nanoparticles. The results demonstrate that it provides a selective and effective approach for the removal of β-agonist in the water samples, and has promising applications in separations of other residues in the fields of food safety, environmental monitoring for controlling the pollution of β-agonist.Acknowledgements
This project is financially supported by the National Natural Science Foundation of China (21473118, 21303115 and 21673152), the National Instrumentation Program (2011YQ031240402). The partial financial support is from a Project Funded by the Priority Academic Program Development of Jiangsu Higher Education Institutions (PAPD).Notes and references
- E. Davis, R. Loiacono and R. J. Summers, Br. J. Pharmacol., 2008, 154, 584–597 CrossRef CAS PubMed.
- K. E. I. Vanoosthuyze, C. J. M. Arts and C. H. Van Peteghem, J. Agric. Food Chem., 1997, 45, 3129–3137 CrossRef CAS.
- J. Kong, L. Jiang, X. O. Su, J. H. Qin, Y. G. Du and B. C. Lin, Lab Chip, 2009, 9, 1541–1547 RSC.
- A. Panoyan, P. Delahaut, C. Ayotte, P. Lamothe, H. Ong and A. Adam, J. Agric. Food Chem., 1995, 43, 2716–2718 CrossRef CAS.
- W. L. Shelver and D. J. Smith, J. Agric. Food Chem., 2004, 52, 2159–2166 CrossRef CAS PubMed.
- S. Y. Cheng, F. Shi, X. C. Jiang, L. M. Wang, W. Q. Chen and C. G. Zhu, Anal. Chem., 2012, 84, 2129–2132 CrossRef CAS PubMed.
- M. Machnik, H. Geyer, S. Horning, A. Breidbach, P. Delahaut and W. Schänzer, J. Chromatogr. B: Biomed. Sci. Appl., 1999, 723, 147–155 CrossRef CAS.
- W. J. Blanchflower, S. A. Hewitt, A. Cannavan, C. T. Elliott and D. G. Kennedy, Biol. Mass Spectrom., 1993, 22, 326–330 CrossRef CAS PubMed.
- H. Hooijerink, R. Schilt, W. Haasnoot and D. Courtheijn, J. Pharm. Biomed. Anal., 1991, 9, 485–492 CrossRef CAS PubMed.
- P. G. Gigosos, T. F. Fernández, O. C. Maríz, C. A. F. Sampayo, C. F. Abuín and A. C. Sáez, J. Chromatogr. B: Biomed. Sci. Appl., 1996, 677, 167–171 CrossRef.
- X. H. Ji, Z. K. He, X. P. Ai, H. X. Yang and C. L. Xu, Talanta, 2006, 70, 353–357 CrossRef CAS PubMed.
- Y. Chen, W. Wang, J. P. Duan, H. Q. Chen and G. N. Chen, Electroanalysis, 2005, 17, 706–712 CrossRef CAS.
- S. H. Shen, J. Ouyang, W. R. G. Baeyens, J. R. Delanghe and Y. P. Yang, J. Pharm. Biomed. Anal., 2005, 38, 166–172 CrossRef CAS PubMed.
- C. R. Tamanaha, S. P. Mulvaney, J. C. Rife and L. J. Whitman, Biosens. Bioelectron., 2008, 24, 1–13 CrossRef CAS PubMed.
- P. Gould, Mater. Today, 2004, 7, 36–43 CrossRef CAS.
- D. S. Wang, J. B. He, N. Rosenzweig and Z. Rosenzweig, Nano Lett., 2004, 4, 409–413 CrossRef CAS.
- J. Bao, W. Chen, T. T. Liu, Y. L. Zhu, P. Y. Jin, L. Y. Wang, J. F. Liu, Y. G. Wei and Y. D. Li, ACS Nano, 2007, 1, 293–298 CrossRef CAS PubMed.
- X. X. Ma, H. Q. Tao, K. Yang, L. Z. Feng, L. Cheng, X. Z. Shi, Y. G. Li, L. Guo and Z. Liu, Nano Res., 2012, 5, 199–212 CrossRef CAS.
- M. Abbas, S. R. Torati, C. S. Lee, C. Rinaldi and C. Kim, J. Nanomed. Nanotechnol., 2014, 5, 244 Search PubMed.
- A. Abou-Hassan, R. Bazzi and V. Cabuil, Angew. Chem., Int. Ed., 2009, 48, 7180–7183 CrossRef CAS PubMed.
- X. X. Han, L. Chen, J. Guo, B. Zhao and Y. Ozaki, Anal. Chem., 2010, 82, 4102–4106 CrossRef CAS PubMed.
- S. Mann, W. Shenton, M. Li, S. Connolly and D. Fitzmaurice, Adv. Mater., 2000, 12, 147–150 CrossRef CAS.
- F. Bao, J. L. Yao and R. A. Gu, Langmuir, 2009, 25, 10782–10787 CrossRef CAS PubMed.
- H. Chon, S. Lee, S. W. Son, C. H. Oh and J. Choo, Anal. Chem., 2009, 81, 3029–3034 CrossRef CAS PubMed.
- X. M. Qian, X. H. Peng, D. O. Ansari, Q. Q. Yin-Goen, G. Z. Chen, D. M. Shin, L. Yang, A. N. Young, M. D. Wang and S. M. Nie, Nat. Biotechnol., 2008, 26, 83–90 CrossRef CAS PubMed.
- X. Zhou, W. L. Xu, Y. Wang, Q. Kuang, Y. F. Shi, L. B. Zhong and Q. Q. Zhang, J. Phys. Chem. C, 2010, 114, 19607–19613 CAS.
- L. Lou, K. Yu, Z. L. Zhang, R. Huang, J. Z. Zhu, Y. T. Wang and Z. Q. Zhu, Nano Res., 2012, 5, 272–282 CrossRef CAS.
- T. Zhou, B. Y. Wu and D. Xing, J. Mater. Chem., 2012, 22, 470–477 RSC.
- H. Y. Park, M. J. Schadt, L. Y. Wang, I. S. Lim, P. N. Njoki, S. H. Kim, M. Y. Jang, J. Luo and C. J. Zhong, Langmuir, 2007, 23, 9050–9056 CrossRef CAS PubMed.
- Z. Fan, D. Senapati, S. A. Khan, A. K. Singh, A. Hamme, B. Yust, D. Sardar and P. C. Ray, Chem.–Eur. J., 2013, 19, 2839–2847 CrossRef CAS PubMed.
- S. Chen, J. L. Yao, S. Y. Han and R. A. Gu, Acta Chim. Sin., 2010, 68, 2151–2155 CAS.
- J. Cheng, X. O. Su, S. Wang and Y. P. Zhao, Sci. Rep., 2016, 6, 32637 CrossRef PubMed.
- G. Degand, A. Bernes-Duyckaerts and G. Maghuin-Rogister, J. Agric. Food Chem., 1992, 40, 70–75 CrossRef CAS.
- X. F. Ren, F. M. Zhang, F. J. Chen and T. B. Yang, Food Agric. Immunol., 2009, 20, 333–344 CrossRef CAS.
- K. Fan, D. J. Li, H. Y. Liu and J. Wu, Instrum. Sci. Technol., 2015, 43, 524–535 CrossRef CAS.
- M. Fleischmann, P. J. Hendra and A. J. McQuillan, Chem. Phys. Lett., 1974, 26, 163–166 CrossRef CAS.
- D. L. Jeanmaire and R. P. Van Duyne, J. Electroanal. Chem., 1977, 84, 1–20 CrossRef CAS.
- Y. He, S. Su, T. T. Xu, Y. L. Zhong, J. A. Zapien, J. Li, C. H. Fan and S. T. Lee, Nanotoday, 2011, 6, 122–130 CrossRef CAS.
- J. J. Feng, X. L. Wu, W. Ma, H. Kuang, L. G. Xu and C. L. Xu, Chem. Commun., 2015, 51, 14761–14763 RSC.
- M. Kahraman, İ. Sur and M. Çulha, Anal. Chem., 2010, 82, 7596–7602 CrossRef CAS PubMed.
- G. F. Wang, H. Y. Park and R. J. Lipert, Anal. Chem., 2009, 81, 9643–9650 CrossRef CAS PubMed.
- J. Neng, M. H. Harpster, H. Zhang, J. O. Mecham, W. C. Wilson and P. A. Johnson, Biosens. Bioelectron., 2010, 26, 1009–1015 CrossRef CAS PubMed.
- Y. Cui, B. Ren, J. L. Yao, R. A. Gu and Z. Q. Tian, J. Phys. Chem. B, 2006, 110, 4002–4006 CrossRef CAS PubMed.
- V. Kanda, J. K. Kariuki, D. J. Harrison and M. T. McDermott, Anal. Chem., 2004, 76, 7257–7262 CrossRef CAS PubMed.
- T. E. Rohr, T. Cotton, N. Fan and P. J. Tarcha, Anal. Biochem., 1989, 182, 388–398 CrossRef CAS PubMed.
- X. X. Han, L. J. Cai, J. Guo, C. X. Wang, W. D. Ruan, W. Y. Han, W. Q. Xu, B. Zhao and Y. Ozaki, Anal. Chem., 2008, 80, 3020–3024 CrossRef CAS PubMed.
- J. Ni, R. J. Lipert, G. B. Dawson and M. D. Porter, Anal. Chem., 1999, 71, 4903–4908 CrossRef CAS PubMed.
- G. C. Zhu, Y. J. Hu, J. Gao and L. Zhong, Anal. Chim. Acta, 2011, 697, 61–66 CrossRef CAS PubMed.
- Y. Xie, H. F. Chang, K. Zhao, J. G. Li, H. Yang, L. Y. Mei, S. M. Xu and A. P. Deng, Anal. Methods, 2015, 7, 513–520 RSC.
- K. Yang, Y. J. Hu and N. Dong, Biosens. Bioelectron., 2016, 80, 373–377 CrossRef CAS PubMed.
- G. Frens, Nature Physical Science, 1973, 241, 20–22 CrossRef CAS.
- J. Liu, Z. K. Sun, Y. H. Deng, Y. Zou, C. Y. Li, X. H. Guo, L. Q. Xiong, Y. Gao, F. Y. Li and D. Y. Zhao, Angew. Chem., Int. Ed., 2009, 121, 5989–5993 CrossRef.
- T. Yoon, J. Kim, J. Kim and J. K. Lee, Energies, 2013, 6, 4830–4840 CrossRef CAS.
- B. V. Enustun and J. Turkevich, J. Am. Chem. Soc., 1963, 85, 3317–3328 CrossRef CAS.
- D. G. Duff, A. Baiker and P. P. Edwards, Langmuir, 1993, 9, 2301–2309 CrossRef CAS.
- JCPDS-International Center for Diffraction Data, PCPDFWIN v. 2.02, 04-0784 Search PubMed.
- JCPDS-International Center for Diffraction Data, PCPDFWIN v. 2.02, 75-1610 Search PubMed.
- A. Michota and J. Bukowska, J. Raman Spectrosc., 2003, 34, 21–25 CrossRef CAS.
- M. A. van Baak, O. M. de Hon, F. Hartgens and H. Kuipers, Int. J. Sports Med., 2004, 25, 533–538 CrossRef CAS PubMed.
Footnote |
| † Electronic supplementary information (ESI) available. See DOI: 10.1039/c6ra24755e |
| This journal is © The Royal Society of Chemistry 2017 |

