 Open Access Article
Creative Commons Attribution 3.0 Unported Licence
Electrochemical self-assembly of nano-polyaniline film by forced convection and its capacitive performance
Yang Songa,
Zhancheng Guoa,
Zongqian Hu*b,
Junxiang Wanga and
Shuqiang Jiao*a
aState Key Laboratory of Advanced Metallurgy, University of Science and Technology Beijing, Beijing 100083, PR China. E-mail: sjiao@ustb.edu.cn; huzongqian@hotmail.com; Tel: +86-10-62333617
bBeijing Institute of Radiation Medicine, Beijing, 100850, P. R. China
First published on 16th January 2017
Abstract
At present, an in situ synthesis of a conductive polyaniline (PANI) film via self-assembly is particularly of great interest in the supercapacitor field. Herein, we report the discovery a nanostructuring process for PANI electrochemical self-assembly through a forced convection method. It was observed that the morphology and structure of PANI films at the nanometer scale could be controlled by varying the rotation speed of the disk electrode during the electropolymerization process. On increasing the rotation speed from 0 rpm to 1000 rpm, the growth of PANI films successively changes from the nanorods composed porous films to the nanoparticles (diameter of 50 nm) composed dense films. We have also demonstrated the efficient electrochemical properties of the electrochemically assembled nano-PANI film-based electrodes at a rotation speed of 100 rpm, which showed the highest capacitance of 700.50 F g−1 at a current density of 1 A g−1 and good cycle stability after 1000 cycles.
1. Introduction
Conducting polymers have a wide range of applications in electronics,1 optics,2 and energy conversion/storage3 because of their fascinating physical and chemical properties. Among the various conducting polymers, polyaniline (PANI) has been considered as an important conducting polymer due to its unique fast redox, acid–base doping/dedoping properties, high conductivity, excellent environmental stability, facile synthesis, and cost effectiveness.4–7 Moreover, it is believed that morphology is the decisive factor in controlling the practical properties of PANI because of its novel architectures. To optimize the synthesis conditions for the fabrication of PANI with special sizes and anticipative morphologies, existing electropolymerization of aniline monomers is widely employed.8,9 To date, different PANI morphologies have been fabricated by varying the synthetic route. In the electropolymerization approach, several synthetic routes, including the use of ionic liquid solvents,10 template synthesis,11–17 interfacial polymerization,18 self-assembly,19,20 stepwise electrochemical deposition,21–26 centrifugal fields electrochemical deposition,27–29 and rotation of the electrode electrochemical deposition,30,31 have been reported. Among these approaches, the effect of centrifugal field electrochemical deposition method on the morphologies and the effect of ionic conductivity of the conducting polymers through a self-assembly process has been widely investigated. However, little attention has been paid to fabricating PANI with the special sizes and anticipative morphologies.In a previous study, we have successfully prepared the PANI nanofibers on ITO with a diameter of about 100 nm via a pulse galvanostatic method.21 In this work, we have developed an electrochemical self-assembled technique through forced convection that is a facile and highly reproducible synthetic route capable of producing different nano-PANI films with morphologies by changing the rotative speed of the disc electrode. In our study, the mechanism for the formation of nano-PANI film, including the effect of the rotation speed of the disk electrode on the overall morphology, have been investigated in detail. The current work has been further extended to evaluate this nano-PANI film as an efficient electroactive material for a model energy-storage device. The nanorods composed porous PANI film-based electrode showed significantly improved capacitance behavior with good charge–discharge cycle life.
2. Experimental
2.1 PANI film preparation
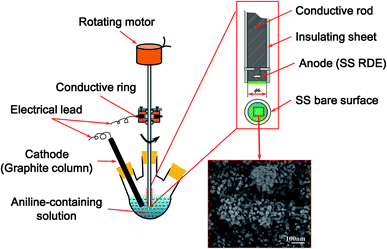
A schematic of the rotating disk electrode (RDE) reactor used in this study is shown in Fig. 1. The electrochemical self-assembly of PANI films by forced convection was performed in a 1.0 M HNO3 aqueous solution containing 0.2 M aniline through the galvanostatic current technique. To facilitate the in situ observation of the as-prepared PANI film, a detachable stainless steel (SS) disk with a 6 mm diameter was selected as the anode. A graphite column with a diameter of 1 cm was used as the cathode. The RDE and the graphite column electrode were electrically connected with a potentiostat/galvanostat workstation via silver rotating rings and carbon brushes. The electrochemical assembly of PANI films was carried out at a mean current density of 2 mA cm−2 for 500 s, and the morphology and structure of the PANI films were controlled by varying the rotation speed of the RDE from 0 to 1000 rpm during the electrochemical assembly process. After electrochemical self-assembly, the RDE with the as-prepared PANI film was taken out of the reaction solution, washed with deionized water, and then dried in air for further characterization.2.2 Apparatus and measurements
The morphologies of the as-prepared PANI film were characterized using a field emission scanning electron microscope (FESEM, JEOL, JSM-6701F).The mass of the deposited PANI film was calculated by the Faraday's law shown in eqn (1), assuming the current efficiency is 100%.
 | (1) |
The electrochemical properties of the as-prepared PANI films were evaluated by galvanostatic charge–discharge (GCD, CHI 1140A), cyclic voltammetry (CV, CHI 1140A), and electrochemical impedance spectroscopy (EIS, CHI 1140A) tests in 1 M HNO3 aqueous solution. The tests were carried out in a three electrode cell with the working electrode being the as-prepared PANI-based SS RDE, whereas the counter and reference electrodes were a graphite column and a saturated calomel electrode, respectively. A saturated calomel electrode, connected by salt bridge in the electrochemical tests, was employed. All experiments were performed at room temperature.
3. Results and discussion
3.1 The morphological evolution of PANI at different rotation speeds
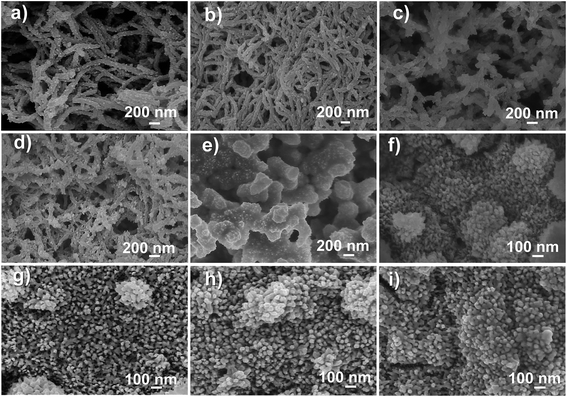
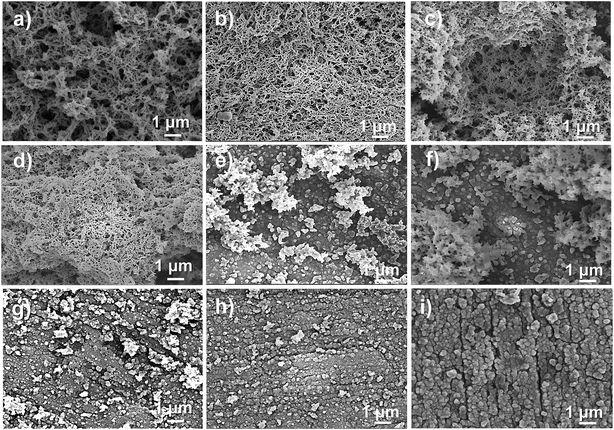
The PANI films with different nanostructures were electrochemically prepared by altering the rotation speeds, and the corresponding morphologies are shown in Fig. 2. The surface morphology of the PANI film depended on the applied rotation speed. In general, as the rotation speed was increased, the surface morphology of the PANI changed from uniform porous nanorods to nanoparticles. PANI film prepared at a rotation speed of 0 rpm (Fig. 2a), which is typical of galvanostatically deposited films, has a highly porous and relatively uniform porous nanorods morphology. At a rotation speed of 100 rpm (Fig. 2b), the micromorphology of PANI was unchanged, whereas the diameter of the nanorods became smaller. At a rotation speed of 200 or 300 rpm (Fig. 2c and d), the microstructures of PANI changed from long fiber-like character to bacillary at the surface of PANI-based SS RDE. As the rotation speed was further increased to 400 or 500 rpm (Fig. 2e), the microstructures of PANI grew to be a bulk at the surface and possessed a kind of coral morphology. Finally, at the rotation speeds of 600, 800, and 1000 rpm, a dense layer of nanoparticles with a 50 nm diameter were grown on the surface of the PANI-based SS RDE (seen in Fig. 2f–i).From the low magnification FESEM images shown in Fig. 3, it is further evident that the morphologies of PANI were influenced by the rotation speed of the electrode. When the rotation speed of the electrode was less than 300 rpm (Fig. 3a–d), the deposited PANI films commonly showed a three-dimensional (3D) network composed of interconnected fibrils with similar diameters. Note that when the rotation speed was 100 rpm, the distribution of the nanostructure was quite uniform rather than porous. Moreover, the space in the porous structure was of micro- and nano-meter size, which provided enough pathways for the movement of ions and solvent molecules within the PANI films, thus improving the electrochemical properties of PANI (100 rpm) that will be discussed hereinafter. As the rotating speed increased to 400 or 500 rpm (Fig. 3e and f), the PANI microstructures had a sparse morphology on the surface. Even at higher rotation speeds (600, 800, and 1000 rpm), some sparse particles can be observed on the surface of the deposited PANI film (Fig. 3g–i).
Fig. 4 summarizes the transition from the porous nanorods morphology to micro- and nano-structured PANI on increasing the rotation speeds. The graphic in Fig. 4 can aid the researchers in tuning the surface morphology of PANI by selecting and applying an appropriate rotation speed. Three zones were identified: (I) porous zone, displaying the porous nanorods with the diameter of 100–150 nm; (II) transition zone, where the bacillary microstructures and a kind of coral microstructure (300 nm long and interval 200 nm) began to form on the surface of the PANI; and (III) microstructured PANI zone, where spherical globules with a diameter of 50 nm have amassed on the PANI surface, completely covering the underlying coral morphology.
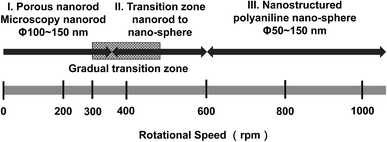 | ||
| Fig. 4 Summary of the progression of the nanostructuring on the surface of PANI as the rotation speeds is increased. | ||
3.2 The mechanism of PANI film with unique structure at different rotation speeds
A schematic for the electrochemical self-assembly is shown in Fig. 5. As depicted in Fig. 4, the morphology of the different electrode speed was divided into three zones. (I) The porous nanorods (diameter: 100–150 nm) morphology: when the rotation speed was below 300 rpm, porous nanorods were formed by oxidation and deposition at the electrode surface; however, when the rotation speed was 100 rpm, a unique and special morphology was demonstrated owing to the slight rotation, which is more conducive for the formation of small diameter nanorods and the uniform growth of a three dimensional porous network structure compared with the stationary electrode (0 rpm); such consistency in the structure promises proportionally enhanced electrochemical performance; as the electrode rotation speed increased to 200 or 300 rpm, the microstructures changed from a long fiber-like character to bacillary due to the relatively strong stirring as the speed was increased. (II) Transition zone: as the rotation speed was further increased to 400 or 500 rpm, the morphology tended to randomly assemble, grew to a bulk on the surface, and had a kind of coral morphology; the reason for this morphology is that the shape of the coral was more favorable for the electrode with vigorous stirring. (III) PANI with nanoparticle structure zone: when high rotation speeds (600, 800, and 1000 rpm) were applied, a thick layer of nanostructure with 50 nm diameter nanoparticles densely grew on the surface of the film; this structure was formed because a higher speed has a higher nucleation rate.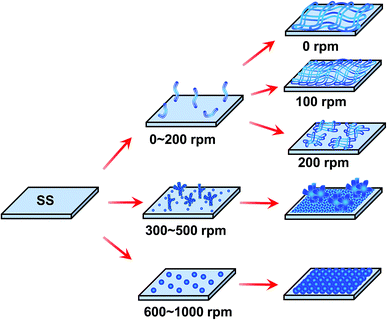 | ||
| Fig. 5 Scheme of the in situ electrochemical polymerization process of the prepared PANI films at different rotating speeds. | ||
3.3 The electrochemical performance of the PANI film obtained at different rotation speeds
Since the PANI film possesses a large specific area and a porous structure, this may enable the electrochemical accessibility of the electrolyte through the PANI phase. To further understand the electrochemical activity of the as-prepared PANI film for different rotation speeds, electrochemical measurements were carried out. The CV curves of the nano-PANI film-based electrode grown at a current density of 2 mA cm−2 for 500 s (Fig. 6) revealed the electrochemical behavior of these electroactive films relationship as a function of the applied rotation speeds. When the rotation speed of the electrode was less than 300 rpm (zone I), as shown in Fig. 6a–d, three pairs of redox peaks were observed (A/A′, B/B′, and C/C′). The two pairs of peaks A/A′ and C/C′ are associated with the redox of PANI molecules from its semiconducting state (leucoemeraldine) to its conductive state (emeraldine), and emeraldine to its full oxidation state (pernigraniline), respectively. Moreover, the weak peaks B/B′ are attributed to the formation of the head-to-tail dimer.32 These voltammetric features agree very well with the FESEM observations of similar porous microstructures formed by the network of interconnected nanofibrils in PANI film. Note that the PANI film prepared at a 100 rpm rotation speed exports larger currents than that prepared at 0, 200, and 300 rpm, especially at the peak potentials. This is an indication of faster kinetics in the polyaniline film prepared at the rotation speed of 100 rpm, which can be attributed to enough pathways for the movement of ions and solvent molecules within the PANI films, resulting in improved electrochemical properties. As the rotation speed was further increased to 400 and 600 rpm (zone II), as shown in Fig. 6e, there were two pairs of faradaic peaks, also relating to the protonation/deprotonation processes. In addition, the CV curves of the PANI film obtained at zone II had a lower current compared to those obtained at zone I, which elaborated that the capacitive performance was not very good at moderate rotation speeds. As the rotation speed was further increased to 800 rpm (zone III), as shown in Fig. 6f, only a pair of redox peaks could be observed, and the redox peak current was smaller, which means that the PANI film obtained at zone III (at high rotation speed) was not suitable as a capacitor.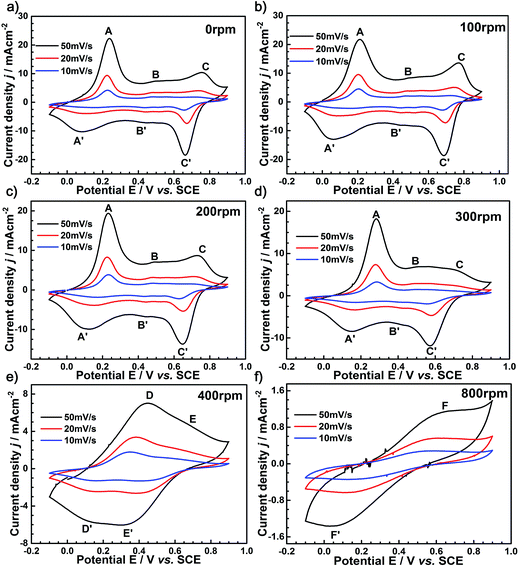 | ||
| Fig. 6 CV curves of the as-prepared PANI films at the rotating speeds of (a) 0 rpm, (b) 100 rpm, (c) 200 rpm, (d) 300 rpm, (e) 400 rpm, and (f) 800 rpm. | ||
Based on the integral area of CV, the specific capacitance of PANI deposited at different speeds was obtained. The specific capacitance, Cm (F g−1), one of the most important parameters for characterizing the electrochemical performance of capacitors, can be calculated from the area under the CV curves using the following formula:33
 | (2) |
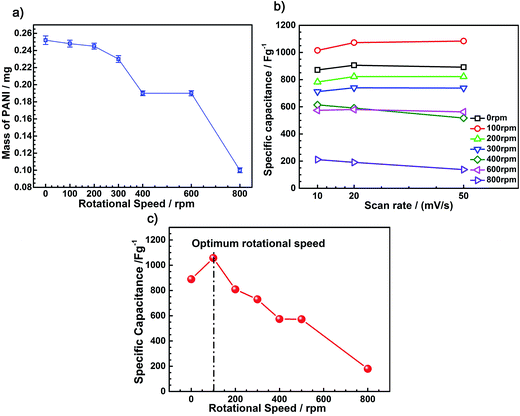
The curve for the mass of PANI with different rotating speeds is shown in Fig. 7a; the mass of PANI decreased with the increasing rotational speed. After eliminating the effect of the mass of electrodeposited PANI on its electrochemical performance, we are convinced that the different electrochemical properties were caused by the different nanostructures of PANI. Fig. 7b shows the specific capacitance of the nano-PANI film-based electrodes prepared at 10, 20, and 50 mV s−1 scan rates. The results demonstrate that the rotation speed has a significant effect on the specific capacitance, whereas the effect of the scan rate on the specific capacitance is not significant. Note that the nano-PANI film prepared at a 100 rpm rotation speed exhibited the largest specific capacitance. Fig. 7c shows the specific capacitance of the nano-PANI film-based electrodes at a scan rate of 10 mV s−1. It can be observed that the specific capacitance increased from 889.14 F g−1, for the electrode prepared at a rotation speed of zero, to a maximum value of 1056.80 F g−1 at a rotation speed of 100 rpm, and then decreased to 179.73 F g−1 at a rotation speed of 800 rpm.
3.4 The electrochemical performance of the as-prepared PANI films (100 rpm)
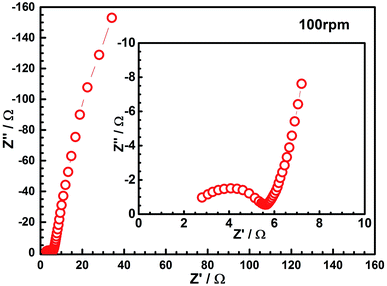
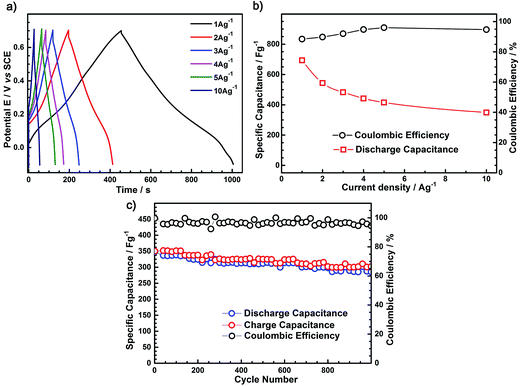
Based on the results of the FESEM and CV studies, we consider the nano-PANI film prepared at a rotation speed of 100 rpm as an optimal film for capacitors applications. The EIS was analyzed by using Nyquist plots to investigate the redox processes, evaluate ionic and electronic conductivity, and specific capacitance of the PANI film at the speed of 100 rpm; Fig. 8 is a typical Nyquist plot of the as-prepared nano-PANI electrode tested in the 1 M HNO3 aqueous solution with a frequency loop from 100 kHz to 1 mHz using a perturbation amplitude of 5 mV. The equivalent series resistance (ESR) of the electrode was about 2.1 Ω, which can be obtained from the x-intercept of the Nyquist plot. In the low frequency region, a line almost vertical to the real axis in the imaginary part of the impedance is attributed to the faradaic pseudocapacitance of the PANI-based electrode. This indicates that this PANI film could be an ideal capacitor material. Furthermore, it exhibited a semicircle in the high frequency region, which is indicative of the charge transfer phenomena by a faradaic process. The numerical value of the semicircle diameter on the Z′ axis is approximately equal to the charge transfer resistance (Rct). In the intermediate frequency region, a 45° line is a characteristic of Warburg diffusion, which is attributed to the semi-infinite diffusion of ions on the interface between the porous structure of the PANI film deposited at 100 rpm and the electrolyte. These results further prove its excellent capacitance as an electrode material for a supercapacitor.Galvanostatic charge–discharge tests were then carried out to evaluate the capacitance of the nano-PANI films (100 rpm) at various current densities using a potential window −0.1 to 0.7 V versus SCE. It is observed in Fig. 9 that the PANI films showed typical capacitance characteristics. The specific capacitance can be calculated according to eqn (3):34
 | (3) |
From Fig. 9a, two voltage stages are observed in the range of −0.1 to 0.2 V and 0.2–0.7 V. The first stage is ascribed to the combination of pure electric double layer and faradaic capacitances, whereas the second stage is associated with the pure electric double layer capacitance.
The discharge specific capacitances of the as-prepared PANI films (100 rpm), as a function of different current densities, are shown in Fig. 9b. It was observed that the discharge specific capacitance for these PANI films decrease with the increasing current density. Furthermore, the coulombic efficiency (charge capacitance/discharge capacitance) at different current densities is presented in Fig. 9b. It can be seen that the coulombic efficiency of the nanosized rod-like PANI film was less than 90% at a current density of 1 A g−1, whereas it was up to 97.7% at a current density of 10 A g−1. This again proves its satisfactory performance as a supercapacitor electrode material in a fast charge–discharge situation.
The cycle stability of the as-prepared PANI films (100 rpm) electrodes was examined at a large charge–discharge current density of 10 A g−1, as shown in Fig. 9c. The porous nano-PANI film prepared at a rotation speed of 100 rpm shows excellent cycle stability, with the discharge capacitance retained at 97.7% after 1000 cycles. This result indicates that the as-prepared rod-like PANI film at a 100 rpm speed has long-term cycle stability and could be used as electrode materials for supercapacitor working at a high charge–discharge current density.
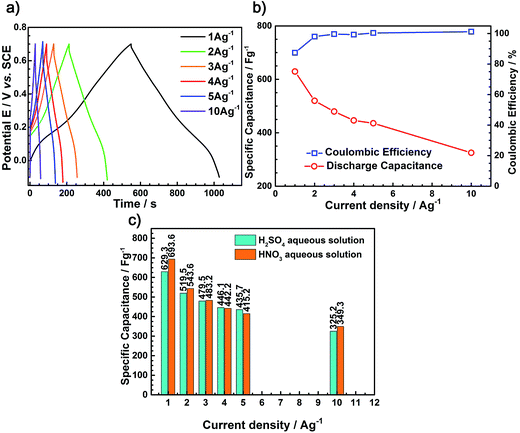
To compare the electrochemical behaviors of the PANI films tested in different electrolyte solutions (H2SO4 and HNO3), galvanostatic charge–discharge tests were carried out to evaluate the capacitance of nano-PANI films (100 rpm) at various current densities using a potential window −0.1 to 0.7 V versus SCE in H2SO4 aqueous solution, as shown in Fig. 10a. Moreover, there is no obvious difference between the test results in HNO3 aqueous solution and H2SO4 aqueous solution. Fig. 10b shows the discharge capacitance and coulombic efficiency tested in H2SO4 aqueous solution at different current densities. It was observed that the discharge specific capacitance for these PANI films decreased with the increasing current density, and the coulombic efficiency of the nanosized rod-like PANI film was less than 91% at the current density of 1 A g−1, whereas it was up to 97.5% at the current density of 10 A g−1.
Fig. 10c shows the discharge capacitance tested in electrolytes (H2SO4 and HNO3) at different current densities. From Fig. 10c, we can draw the conclusion that generally the discharge specific capacity of the HNO3 aqueous solution is higher than that of the H2SO4 aqueous solution. In addition, Fig. 11 can further illustrates the abovementioned conclusions that the PANI synthesized in HNO3 aqueous solution has a nanofiber morphology; however, when prepared in the H2SO4 aqueous solution, it changes to sheet morphology consisting of short rods. Compared with sheet-like morphology, the nanofiber morphology is more advantageous for the capacitance performance. This is in good agreement with the previously reported studies.22,26
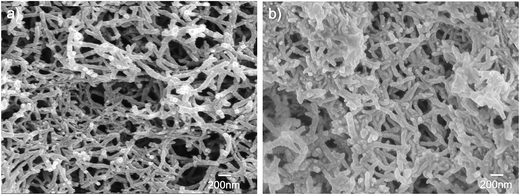 | ||
| Fig. 11 Scanning electron microscopy (SEM) images of the PANI samples in HNO3 aqueous solution (a) and in H2SO4 aqueous solution (b). | ||
4. Conclusion
In summary, we report the discovery of a nanostructuring process for the electrochemical self-assembly of PANI using a forced convection method. It was observed that the morphology and structure of the PANI films at the nanometer scale could be controlled by varying the rotation speed of the disk electrode during the electropolymerization process. As the rotation speed was increased from 0 to 1000 rpm, the growth of PANI films successively changed from porous films composed of PANI nanorods to a transition zone, where bacillary and coral microstructure PANI agglomerates and clusters (300 nm long and interval 200 nm) are formed on the surface of the films, and finally to the dense films composed of PANI nanoparticles (diameter of 50 nm).We have also demonstrated that the nano-PANI film-based electrodes, electrochemically assembled at a rotation speed of 100 rpm, exhibit the highest capacitance of 700.50 F g−1 at a current density of 1 A g−1 and good cycle stability after 1000 cycles. The excellent electrochemical performances are attributed to their well-defined porous nanostructure, which increases the electrode/electrolyte contact area and enhance the electroactive regions.
Moreover, we believe that this electrochemical self-assembly through forced convection method could be a model synthesis route for the production of conducting polymer with controlled morphology for the supercapacitors in a facile way.
Acknowledgements
The authors are grateful to the National Natural Science Foundation of China (No. 81301345).References
- P. N. Bartlett and S. K. Ling-Chung, Sens. Actuators, 1989, 19, 141–150 CrossRef CAS
.
- K.-C. Huang, C.-W. Hu, C.-Y. Tseng, C.-Y. Liu, M.-H. Yeh, H.-Y. Wei, C.-C. Wang, R. Vittal, C.-W. Chu and K.-C. Ho, J. Mater. Chem., 2012, 22, 14727–14733 RSC
.
- K. Jurewicz, S. Delpeux, V. Bertagna, F. Beguin and E. Frackowiak, Chem. Phys. Lett., 2001, 347, 36–40 CrossRef CAS
.
- G. A. Snook, P. Kao and A. S. Best, J. Power Sources, 2011, 196, 1–12 CrossRef CAS
.
- K. S. Ryu, K. M. Kim, N.-G. Park, Y. J. Park and S. H. Chang, J. Power Sources, 2002, 103, 305–309 CrossRef CAS
.
- J. Liu, M. Zhou, L.-Z. Fan, P. Li and X. Qu, Electrochim. Acta, 2010, 55, 5819–5822 CrossRef CAS
.
- D. Dhawale, R. Salunkhe, V. Jamadade, D. Dubal, S. Pawar and C. Lokhande, Curr. Appl. Phys., 2010, 10, 904–909 CrossRef
.
- G. Schopf and G. Kossmehl, Polythiophenes-electrically conductive polymers, Springer, Berlin, 1997 Search PubMed
.
- S. Sadki, P. Schottland, N. Brodie and G. Sabouraud, Chem. Soc. Rev., 2000, 29, 283–293 RSC
.
- J. Chen, W. Li, D. Wang, S. Yang, J. Wen and Z. Ren, Carbon, 2002, 40, 1193–1197 CrossRef CAS
.
- H. Qiu, M. Wan, B. Matthews and L. Dai, Macromolecules, 2001, 34, 675–677 CrossRef CAS
.
- L. Hu, J. Tu, S. Jiao, J. Hou, H. Zhu and D. J. Fray, Phys. Chem. Chem. Phys., 2012, 14, 15652–15656 RSC
.
- S. Jiao, J. Tu, C. Fan, J. Hou and D. J. Fray, J. Mater. Chem., 2011, 21, 9027–9030 RSC
.
- R. V. Parthasarathy and C. R. Martin, Chem. Mater., 1994, 6, 1627–1632 CrossRef CAS
.
- C.-G. Wu and T. Bein, Science, 1994, 1013–1015 CAS
.
- H. Ding, M. Wan and Y. Wei, Adv. Mater., 2007, 19, 465–469 CrossRef CAS
.
- X. Zhang, J.-S. Lee, G. S. Lee, D.-K. Cha, M. J. Kim, D. J. Yang and S. K. Manohar, Macromolecules, 2006, 39, 470–472 CrossRef CAS
.
- Y. Zhou, Z.-Y. Qin, L. Li, Y. Zhang, Y.-L. Wei, L.-F. Wang and M.-F. Zhu, Electrochim. Acta, 2010, 55, 3904–3908 CrossRef CAS
.
- J. Huang and R. B. Kaner, J. Am. Chem. Soc., 2004, 126, 851–855 CrossRef CAS PubMed
.
- J. H. Chang, C. R. Aleman de Leon and I. W. Hunter, Langmuir, 2012, 28, 4805–4810 CrossRef CAS PubMed
.
- J. Tu, J. Hou, W. Wang, S. Jiao and H. Zhu, Synth. Met., 2011, 161, 1255–1258 CrossRef CAS
.
- H. Zhou, S. Jiao, J. Chen, W. Wei and Y. Kuang, Thin Solid Films, 2004, 450, 233–239 CrossRef CAS
.
- S. Jiao, H. Zhou, J. Chen, S. Luo and Y. Kuang, J. Appl. Polym. Sci., 2004, 94, 1389–1394 CrossRef CAS
.
- H.-F. Jiang and X.-X. Liu, Electrochim. Acta, 2010, 55, 7175–7181 CrossRef CAS
.
- H. Zhou, J. Wen, X. Ning, C. Fu, J. Chen and Y. Kuang, J. Appl. Polym. Sci., 2007, 104, 458–463 CrossRef CAS
.
- H. Zhou, J. Wen, X. Ning, C. Fu, J. Chen and Y. Kuang, Synth. Met., 2007, 157, 98–103 CrossRef CAS
.
- R. M. Penner and C. R. Martin, J. Electrochem. Soc., 1986, 133, 2206–2207 CrossRef CAS
.
- C. R. Martin, Nanomaterials – a membrane-based synthetic approach, DTIC Document, 1994 Search PubMed
.
- M. Atobe, S. Hitose and T. Nonaka, Electrochem. Commun., 1999, 1, 278–281 CrossRef CAS
.
- K. Loganathan and P. G. Pickup, Langmuir, 2006, 22, 10612–10618 CrossRef CAS PubMed
.
- Y. Lin and G. Wallace, Electrochim. Acta, 1994, 39, 1409–1413 CrossRef CAS
.
- Z. Zheng, Y. Du, Q. Feng, Z. Wang and C. Wang, J. Mol. Catal. A: Chem., 2012, 353, 80–86 CrossRef
.
- L. Hu, Z. Yu, Z. Hu, Y. Song, F. Zhang, H. Zhu and S. Jiao, Electrochim. Acta, 2015, 174, 273–281 CrossRef CAS
.
- Y. G. Wang, H. Q. Li and Y. Y. Xia, Adv. Mater., 2006, 18, 2619–2623 CrossRef CAS
.
| This journal is © The Royal Society of Chemistry 2017 |

