 Open Access Article
Controlling the structure and morphology of zinc borate by adjusting the reaction temperature and pH value: formation mechanisms and luminescent properties
Pan Liang ,
Zuolaguli Tuoheti and
Zhi-Hong Liu*
Key Laboratory for Macromolecular Science of Shaanxi Province, School of Chemistry and Chemical Engineering, Shaanxi Normal University, Xi'an 710100, People's Republic of China. E-mail: liuzh@snnu.edu.cn
First published on 21st December 2016
Abstract
Controlling the structure and morphology of micro/nanomaterials precisely enables us to manipulate their properties as desired. Therefore, understanding the complex growth mechanisms of micro/nanomaterials, and regulating and controlling their structure, morphology and related luminescent properties, are the focuses of chemistry and materials science. In this study, we hydrothermally synthesized three zinc borates with different structures and compositions, Zn(H2O)B2O4·0.12H2O, Zn2(OH)BO3, and H[Zn6O2(BO3)3], by adjusting the reaction temperature, and further prepared zinc borate, Zn(H2O)B2O4·0.12H2O, with three different morphologies by adjusting the pH of the reaction system. The possible growth mechanisms of these three zinc borate (Zn(H2O)B2O4·0.12H2O) morphologies are illustrated in detail. The luminescent properties of three different Tb3+-doped phosphors with different structures and Zn(H2O)B2O4·0.12H2O with three morphologies have also been investigated. Furthermore, the morphology–structure–property relationships have been discussed.
Introduction
White light-emitting diodes (w-LEDs) have been regarded as the new generation of illumination sources due to numerous advantages, such as long lifetime, energy saving properties, and environmental friendliness. However, the commonly used w-LEDs, which are based on a combination of a blue InGaN LED chip and a yellow-emitting Y3Al5O12:Ce3+ (YAG:Ce), have a low color rendering index and a high color temperature due to the lack of a red-emitting component. At present, researchers overcome the abovementioned problems by combining a near-UV LED chip with a white-emitting phosphor or blue, green and red emitting phosphors. Therefore, it is important to search for phosphors that could be excited efficiently by near-UV LEDs.1–3 For a green emitting phosphor, Tb3+-doped phosphors are considered to be attractive candidates since the 5D4–7F5 transition of Tb3+ is around 540 nm. In principle, Tb3+, as a green activator, has a lower threshold pump power compared to Er3+ ions4 and a shorter decay time than that of Mn2+ ions.5 The luminescence properties of these materials are strongly dependent on their chemical compositions, phases, dimensions, and morphologies.6 Controlling the morphology and structure of micro/nanomaterials precisely enables us to manipulate their properties as desired. Therefore, understanding the complex growth mechanism of micro/nanomaterials, and regulating and controlling their structure, morphology and luminescent properties are the focuses of chemistry and materials science.It is known that the structures and properties of inorganic materials are largely influenced by numerous factors during their assembly and/or post-treatment, such as the types of raw materials, concentration, temperature, and pH. Researchers have already paid special attention to the effects of pH on the assembly, morphology, and properties of inorganic materials.7 For example, Han, G. S. et al. controlled the morphology and phase of hydroxyapatite by adjusting the initial pH of precursors.8 Poongodi, S. et al. obtained nanoarray films of WO3 with three different morphologies by adjusting the pH values of the electrolyte.9 Yin, X. H. et al. found that the pH value dramatically affected monodisperse YBO3 microsphere formation.10 Kong, X. G. et al. demonstrated that the morphology of the layered K2V6O16·nH2O hexavanadate crystal could be easily controlled by adjusting the pH of the system.11 Chu, L. H. et al. tuned the morphology of NiO by adjusting the pH of the precursor solutions with NH3·H2O via a hydrothermal process.12 Song, J. L. et al. obtained a series of lead(II) borates by only adjusting the pH values of the reaction systems.13
Borates, as an important family of functional materials, have received much attention owing to their varied structural chemistry and wide application in photoluminescence,14,15 nonlinear optical (NLO) devices,16,17 flame retardant materials,18 electrochemical devices,19 photocatalysis,20–22 and adsorbents.23 Dozens of polyborates exist in aqueous borate solutions under common conditions. The existing forms and the interactions among these different polyborates mainly depend on pH, temperature, total boron concentration, and counter-ions in the solution.24 Therefore, through tuning the reaction conditions, various forms of metal borate have been obtained with different chemical compositions and structures. An example is zinc borate, which can be categorized as hydrous zinc borate: Zn[B3O3(OH)5]·H2O, Zn[B3O4(OH)3],25 ZnO·2.2B2O3·3H2O,26 Zn3B10O18·14H2O,27 4ZnO·B2O3·H2O,28 Zn8[(BO3)3O2(OH)3],29 3ZnO·3B2O3·3.5H2O, 6ZnO·5B2O3·3H2O,30 H[Zn6O2(BO3)3],31 Zn2B6O11·3H2O,32 and Zn(H2O)B2O4·0.12H2O,33 as well as anhydrous zinc borate: ZnB4O7,34 ZnB2O4,35 4ZnO·3B2O3,36 and Zn3(BO3)2.37 Tb3+-doped zinc borate phosphors have been studied for years. For instance, Li, J. et al. synthesized the novel phosphor, Zn(BO2)2:Tb, by a solid-state reaction.38 Erdogmus, E. et al. synthesized Tb3+-doped Bi2ZnB2O7 by a solid-state reaction.39 Thulasiramudu, A. et al. obtained Eu3+/Tb3+-doped heavy metal oxide (HMO)-based zinc lead borate glasses by a solid-state reaction method.40 Therefore, previous research on Tb3+-doped zinc borate generally involved preparation by a conventional solid-state reaction method, which required high temperatures as well as thorough grinding, and usually resulted in a poor morphology. To explore new metal borates with regular morphology and high photoluminescence (PL) efficiencies, we deem that studies on the reaction conditions of the borate systems are very interesting and important for understanding the structure–property relationships.
In this study, by controlling the reaction temperature and the pH of the prepared solutions, we synthesized three zinc borate structures (Zn(H2O)B2O4·0.12H2O, Zn2(OH)BO3, and H[Zn6O2(BO3)3]) and three Zn(H2O)B2O4·0.12H2O morphologies using a hydrothermal method with no surfactant or template. The morphology changes and structural evolution of zinc borate materials were studied. Furthermore, we also investigated the PL properties of these different structures and the different morphologies of Tb3+-doped zinc borate as well as the relationships between their morphology, crystal structures, and optical properties.
Experimental
Synthesis of samples
All of the reagents were of analytical grade and used directly without further purification.For the synthesis of the three zinc borate structures, ZnSO4·7H2O (1.43 g), K2B4O7·4H2O (1.00 g), and NH4HB4O7·3H2O (2.50 g) were added into a 100 mL Teflon-lined stainless steel autoclave, and 60 mL H2O was added with constant magnetic stirring. The pH of the mixed solution was adjusted to 9.5 with 3 M NaOH solution, and the solution was kept stirring for 30 min. After that, the Teflon-lined stainless steel autoclave was sealed and maintained at three temperature points (80 °C, 150 °C, and 220 °C) for 12 h, and allowed to cool to room temperature naturally. The white precipitates of Zn(H2O)B2O4·0.12H2O, Zn2(OH)BO3, and H[Zn6O2(BO3)3] were collected and washed several times with distilled water and absolute alcohol and then dried at 60 °C for 12 h.
For the synthesis of the three Zn(H2O)B2O4·0.12H2O morphologies, the procedures were the same as stated above (80 °C) except that the pH of the reaction system was changed from 8.0 to 9.0 and 9.5.
For the synthesis of Tb3+-doped zinc borate samples, the procedures were the same as stated above except that stoichiometric amounts of Tb(NO3)3·5H2O were added.
Characterization
All samples were characterized by X-ray diffraction (XRD) (Rigaku D/max, operating at 40 kV and 30 mA, with a Cu target at a scanning rate of 8° min−1, with a 2θ range from 10° to 50°), field emission scanning electron microscopy (FSEM) (SU-8020, Hitachi), and transmission electron microscopy (FTEM) (Tecnai G2 F20, FEI). The photoluminescence excitation and emission spectra were measured with an F-7000 (Hitachi) spectrophotometer equipped with a continuous 150 W xenon lamp at room temperature. For temperature-dependent experiments at 50–300 °C, the samples were placed in a small holder, the temperature of which was controlled by a heating device. The absolute photoluminescence quantum yield (QY) was measured with a Hamamatsu (C9920-02G) analytical instrument.Results and discussion
Characterization and possible formation mechanism of samples
![[3 with combining macron]](https://www.rsc.org/images/entities/char_0033_0304.gif) m) Zn(H2O)B2O4·0.12H2O (PDF, no. 97-028-1308). All the peaks of the sample prepared at 150 °C are in good agreement with those of the monoclinic phase (space group: P21) Zn2(OH)BO3 (PDF, no. 00-057-0146). All the peaks of the sample prepared at 220 °C are in good agreement with those of the trigonal phase (space group: R
m) Zn(H2O)B2O4·0.12H2O (PDF, no. 97-028-1308). All the peaks of the sample prepared at 150 °C are in good agreement with those of the monoclinic phase (space group: P21) Zn2(OH)BO3 (PDF, no. 00-057-0146). All the peaks of the sample prepared at 220 °C are in good agreement with those of the trigonal phase (space group: R![[3 with combining macron]](https://www.rsc.org/images/entities/char_0033_0304.gif) c) H[Zn6O2(BO3)3] (PDF, no. 97-024-0473). No diffraction peaks of any other phases or impurities were detected in the three XRD patterns, indicating that all of the as-prepared samples are single-phase.
c) H[Zn6O2(BO3)3] (PDF, no. 97-024-0473). No diffraction peaks of any other phases or impurities were detected in the three XRD patterns, indicating that all of the as-prepared samples are single-phase.
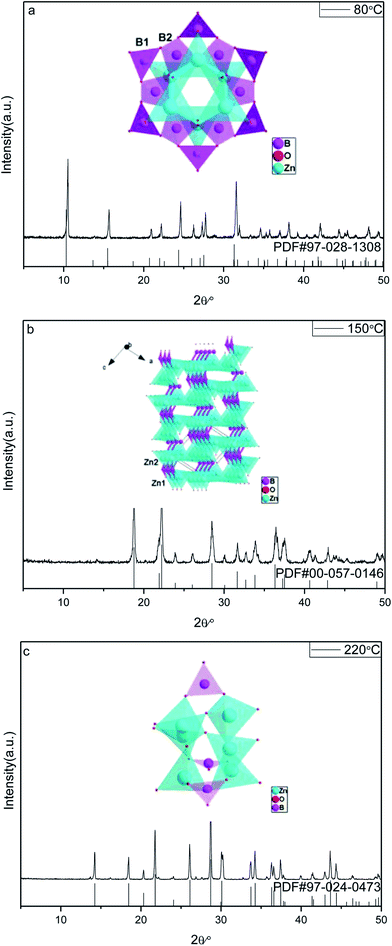 | ||
| Fig. 1 XRD patterns and corresponding crystal structures of obtained zinc borates at different temperatures: (a) 80 °C; (b) 150 °C; (c) 220 °C. | ||
The possible chemical reactions at different reaction temperatures can be formulated as follows:28
| B4O72− + 7H2O → 4H3BO3 + 2OH− | (1) |
| HB4O7− + 6H2O → 4H3BO3 + OH− | (2) |
| NH4+ + H2O → NH3·H2O + H+ | (3) |
| Zn2+ + 4OH− → Zn(OH)42− | (4) |
 | (5) |
 | (6) |
 | (7) |
These results indicate that the reaction temperature of the current hydrothermal system has a significant role in the formation of the final products, which have different compositions and structures.
The reaction temperature drives the connection style of B–O, Zn–O and O–H, resulting in different compositions of the final products. When the reaction temperature is 80 °C, the final product, Zn(H2O)B2O4·0.12H2O, is constructed from the vertex linkages between the triangular B(1)O3 unit and the tetrahedral B(2)O4 and ZnO4 units, as shown in the inset of Fig. 1a. The connectivity between the triangular B(1)O3 unit and the tetrahedral B(2)O4 creates a six-membered cyclic borate polyanion with the formula [B12O24]12−. The polyanion is formed by six B(2)O4 and six B(1)O3 triangles. Each B(2)O4 tetrahedron shares two of its corners externally with the B(1)O3 triangles. The addition of Zn2+ ions to the polyborate anion, [B12O24]12−, through Zn-μ3O(1)–B bonds gives rise to the zinc borate cluster, Zn6B12O24.33 When the reaction temperature rises to 150 °C, the final product, Zn2(OH)BO3, has a chiral network structure built up from two independent types of ZnO4 tetrahedra and BO3 groups linked through common O vertices, as shown in the inset of Fig. 1b. The four oxygen atoms in both Zn(1)O4 and Zn(2)O4 are arranged in a very irregular tetrahedron. However, the unit cell of the compound contains crystallographically independent borate BO3 groups, the zinc-centered tetrahedra sharing vertices to form a three-dimensional zinc oxide matrix, which consists of two types of –Zn–O–Zn– helical chains of distorted ZnO4 tetrahedra running along the [100] and the [001] directions.41 When the reaction temperature rises to 220 °C, the final product, H[Zn6O2(BO3)3], is constructed of a triangular B(1)O3 unit and tetrahedral ZnO4 units, as shown in the inset of Fig. 1c. Each O atom is surrounded by three cations, viz. three Zn atoms for atom O1, and two Zn and one B atom for atoms O2 and O3. Thus, a three-dimensional framework is formed. The main feature is the triple units of [ZnO4] tetrahedra sharing one common O1 vertex that are connected by an equivalent unit over three corners (O2) and three [BO3] units to form a cage.31
FSEM images of the prepared zinc borate samples obtained at different temperatures are shown in Fig. 2. It is apparent that Zn(H2O)B2O4·0.12H2O displays hexahedral morphology with an edge of about 700 nm (Fig. 2a and a1). Zn2(OH)BO3 displays well-dispersed short belt-like morphology with a length of about 1.5 μm and a width of about 80 nm (Fig. 2b and b1). H[Zn6O2(BO3)3] displays well-dispersed polyhedral morphology with an average size of about 12 μm (Fig. 2c and c1).
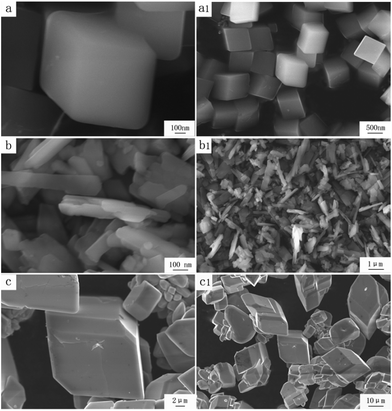 | ||
| Fig. 2 High and low resolution SEM images of obtained zinc borate at different temperatures: (a and a1) 80 °C; (b and b1) 150 °C; (c and c1) 220 °C. | ||
HREM images of the prepared zinc borate samples obtained at different temperatures are shown in Fig. 3. The inter-planar spacing of the sample obtained at 80 °C is 2.368 Å, which is very close to the d value (2.374 Å) of the [0 4 2] faces in the Zn(H2O)B2O4·0.12H2O crystal. The inter-planar spacing of the sample obtained at 150 °C is 2.413 Å, which is very close to the d value (2.411 Å) of the [2 1 −1] faces in the Zn2(OH)BO3 crystal. The inter-planar spacing of the sample obtained at 220 °C is 2.458 Å, which is very close to the d value (2.454 Å) of the [0 1 −10] faces in the H[Zn6O2(BO3)3] crystal.
![[3 with combining macron]](https://www.rsc.org/images/entities/char_0033_0304.gif) m) Zn(H2O)B2O4·0.12H2O (PDF, no. 97-028-1308). No diffraction peaks of any other phases or impurities were detected in this pattern, indicating that all of the as-prepared samples are single-phase.
m) Zn(H2O)B2O4·0.12H2O (PDF, no. 97-028-1308). No diffraction peaks of any other phases or impurities were detected in this pattern, indicating that all of the as-prepared samples are single-phase.
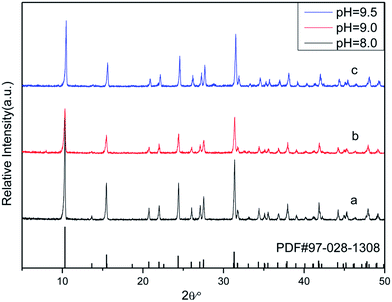 | ||
| Fig. 4 XRD patterns of obtained zinc borate at different pH values: (a) pH = 8.0; (b) pH = 9.0; (c) pH = 9.5. | ||
FSEM images of the prepared Zn(H2O)B2O4·0.12H2O samples obtained at different pH values are shown in Fig. 5. It is apparent that the morphologies of the Zn(H2O)B2O4·0.12H2O samples are closely related to the pH values of the precursor solution during the synthesis process. The sample synthesized at pH 8.0 displays well-dispersed octahedral morphology with an edge of about 1.5 μm (Fig. 5a and a1). When the pH of the precursor solution rises to 9.0, the obtained sample displays distorted octahedral morphology with a long edge of about 600 nm (Fig. 5b and b1). When the pH of the precursor solution rises to 9.5, the obtained sample displays hexahedral morphology with an edge of about 700 nm (Fig. 5c and c1).
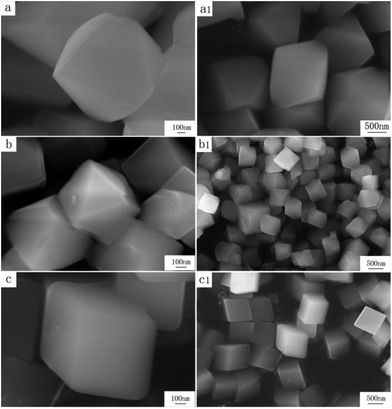 | ||
| Fig. 5 High and low resolution SEM images of obtained zinc borate at different pH values: (a and a1) pH = 8.0; (b and b1) pH = 9.0; (c and c1) pH = 9.5. | ||
The morphology evolution of Zn(H2O)B2O4·0.12H2O at the pH of the precursor solution indicates the significant influence of the pH on the morphology of the products. However, using NaOH to increase the system pH increases the amount of Na+ ions, which can also affect the morphology of the materials.42 Therefore, we also added different amounts of NaNO3, Na2SO4 and K2SO4 when the system pH had been adjusted to 9.5. However, the phase and morphology of the obtained samples were not changed significantly when the abovementioned salts were added. Therefore, we deem that OH− plays a critical role in changing the morphology of Zn(H2O)B2O4·0.12H2O. Moreover, when NH3·H2O and KOH were used to adjust the pH of the system, we obtained similar results to those with NaOH.
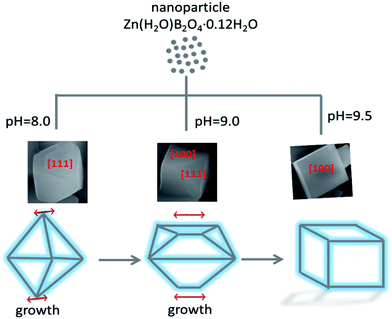
A possible formation mechanism for the Zn(H2O)B2O4·0.12H2O samples with various morphologies is proposed, as shown in Scheme 1. During the hydrothermal process, the ions in aqueous solution initially reacted quickly, precipitating amorphous particles. When the pH value of the precursor solution was weak alkaline, the lower concentration of OH− ions resulted in the formation of Zn(OH)42−, leading to slow growth of the crystal and weak aggregation of the crystal nuclei. Furthermore, Zn(H2O)B2O4·0.12H2O crystals were formed through the intermolecular reaction. The surface of Zn(H2O)B2O4·0.12H2O can attach a number of OH− groups. Under non-equilibrium conditions, the shape of the crystals varies and strongly depends on kinetic parameters, such as the crystal growth rate during the nucleation and growth of crystals.43 At pH 8.00, an octahedral morphology of Zn(H2O)B2O4·0.12H2O with exposed [1 1 1] faces can be obtained. Thermodynamic analysis indicated that the supersaturation of the growth species (the concentration of OH− in this system) might determine the surface energy of exposed faces during crystal growth. According to the Gibbs–Curie–Wulff theorem,28 the growth rates on different surface facets are dominated by the surface energy. When a particle grows, the facets tend toward low-energy planes to minimize the surface energy. The energy of [1 0 0] faces is lower than that of [1 1 1] faces. When the pH rises to 9.00, the solution generates more OH−, resulting in a higher growth rate of Zn(OH)42− nuclei. Therefore, a disordered octahedral morphology of Zn(H2O)B2O4·0.12H2O with exposed [1 1 1] and [1 0 0] faces can be obtained. With a further increase in the pH of the precursor solution to 9.50, a higher content of OH− leads to a higher growth rate of Zn(OH)42− nuclei. Therefore, favored by the higher growth rate and the spontaneous energy-minimizing process removing surface energy associated with unsatisfied bonds, the resulting Zn(OH)42− nuclei gradually self-organize and react further. Hence, a hexahedral morphology of Zn(H2O)B2O4·0.12H2O with exposed [1 0 0] faces can be obtained. From the octahedral, to the disordered octahedral, to the hexahedral morphology of Zn(H2O)B2O4·0.12H2O, we found that when the up-down symmetrical points of the octahedra and their linked faces grew along a parallel line, disordered octahedral morphology could be obtained. With further growth along the parallel line, a hexahedral morphology of Zn(H2O)B2O4·0.12H2O could be obtained.
Photoluminescence properties of Tb3+-doped zinc borates
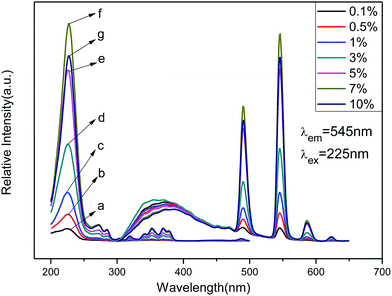
The emission spectra of Zn(H2O)B2O4·0.12H2O:xTb3+ (x = 0.001, 0.005, 0.01, 0.03, 0.05, 0.07 and 0.10) at room temperature (RT) are shown in Fig. 6 (right), which exhibit the same spectroscopic features for different concentrations of Tb3+ ions in the samples. The emission spectra are composed of one hump band and four sharp bands. The hump band centered at about 380 nm can be attributed to zinc borate host-related emission, which is called ‘‘band-gap’’ fluorescence.41 The four sharp bands with maxima at about 491, 545, 587, and 623 nm are due to the transitions from the excitation state 5D4 to the ground states 7FJ (J = 6, 5, 4, 3) of Tb3+ in the host lattice. Among these transitions, the green emission located at 545 nm (5D4 → 7F5) is the strongest peak because it is a magnetic dipole allowed with the ΔJ = ±1 rule. Therefore, we can deduce that Tb3+ is located at a low symmetry site of Zn in the Zn(H2O)B2O4·0.12H2O host lattices.1 For all Tb3+ concentrations, the shapes of the emission spectra are essentially the same except for the intensity at different activator concentrations. As the concentration of Tb3+ increased gradually, the emission associated with Tb3+ also increased up to 7 mol% doping concentration and then decreased because of concentration quenching. The concentration quenching effect might be due to the enhanced excitation migration or to the activator ions that are coupled or coagulated and migrate to the quenching center.1
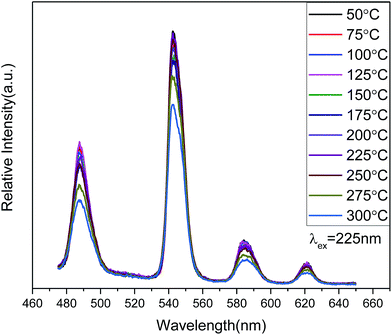
The temperature-dependent behavior of the PL emission spectra (Fig. 7) shows considerable stability for Zn(H2O)B2O4·0.12H2O:0.07Tb3+ in the temperature range 50–300 °C. As the temperature increases from 50 °C to 250 °C, the shape and PL intensity of the emission spectra does not change significantly, which shows that the thermal stability of the optimized-composition sample is good. A further increase in the temperature above 250 °C (275 °C, 300 °C) will increase the non-radiative transition probability and the PL intensity shows thermal quenching.45 Moreover, the quantum yield of Zn(H2O)B2O4·0.12H2O:0.07Tb3+ under 352 nm excitation is about 10.2% at room temperature.
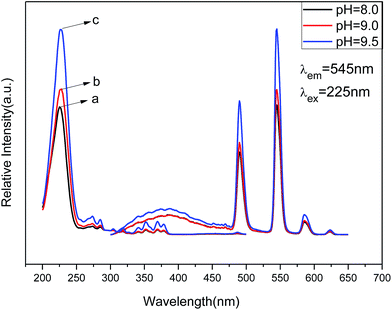 | ||
| Fig. 8 PL excitation (left) and emission spectra (right) of Zn(H2O)B2O4·0.12H2O:0.07Tb3+ at different pH values: (a) pH = 8.0, (b) pH = 9.0, (c) pH = 9.5. | ||
The emission spectra of Zn(H2O)B2O4·0.12H2O:0.07Tb3+ at room temperature (RT) are shown in Fig. 8 (right), which exhibit the same spectroscopic features for different morphologies of the samples. The shapes of the emission spectra are essentially the same except for the intensity at different pH values. The emission spectra are composed of one hump band and four sharp bands. The hump band centered at about 385 nm can be attributed to zinc borate host-related emission, which is called “band-gap” fluorescence. The four sharp bands with maxima at about 490, 544, 586, and 623 nm are due to the transitions from the excitation state 5D4 to the ground states 7FJ (J = 6, 5, 4, 3) of Tb3+ in the host lattice. The sample prepared at pH = 9.5 (hexahedral morphology) exhibited the strongest intensity. It is widely accepted that the luminescent properties of phosphors are strongly correlated with the morphology, size, crystallinity, the center of luminescence and the density of defects.46 The hexahedral morphology of Zn(H2O)B2O4·0.12H2O:0.07Tb3+ has a shorter edge with a larger specific surface area than the octahedral morphology, which will result in a high concentration of luminescence centers, causing enhancement of the emission intensity.47 Furthermore, the [100] faces of the hexahedral morphology possess a lower energy than the combined [1 1 1] and [1 0 0] faces of the disordered octahedral morphology and the [1 1 1] faces of the octahedral morphology of Zn(H2O)B2O4·0.12H2O:0.07Tb3+, which results in a lower trapping effect with respect to phonon emission and transition. Therefore, the hexahedral morphology of Zn(H2O)B2O4·0.12H2O:0.07Tb3+ possesses the highest emission intensity.
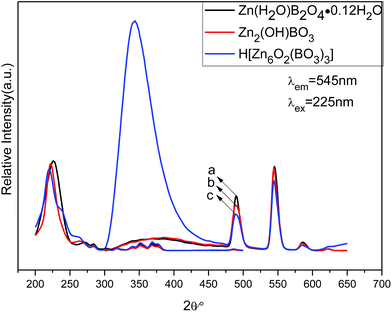 | ||
| Fig. 9 PL excitation (left) and emission spectra (right) of different structures of zinc borateahcas: (a) Zn(H2O)B2O4·0.12H2O:0.07Tb, (b) Zn2(OH)BO3:0.07Tb, (c) H[Zn6O2(BO3)3]:0.07Tb. | ||
The emission spectra of the abovementioned three zinc borate phosphors at room temperature (RT) are shown in Fig. 9 (right), which exhibit the same spectroscopic features for different structures of Tb3+ ions in the samples. For all the different structures of Tb3+ ions in the samples, the shapes of the emission spectra are generally the same except for the intensities. The emission spectra are composed of one hump band and four sharp bands. The hump band centered at about 385 nm can be attributed to zinc borate host-related emission, which is called “band-gap” fluorescence. The four sharp bands with maxima at about 490, 544, 586, and 623 nm are due to the transitions from the excitation state 5D4 to the ground states 7FJ (J = 6, 5, 4, 3) of Tb3+ in the host lattice. The Zn(H2O)B2O4·0.12H2O:0.07Tb sample exhibited the strongest intensity. Furthermore, the band gap emission in H[Zn6O2(BO3)3]:0.07Tb was obviously higher than the characteristic Tb3+ emission. Upon VUV excitation, it is considered that most of the incident photons are absorbed by the host crystal moving electrons from the valence band toward the conduction band, subsequently producing either self-trapped excitons (STEs) or free electron–hole pairs. This emission band most likely arises from the recombination of STEs that are associated with band-gap excitations or molecular transitions within the BO33− group.5 The top of the valence band comprises hybridized O 2p and B 2p-like states, whereas the bottom of the conduction band may contain metallic states. The key to the band gap of borates has been shown to be the elimination of nonbonding orbitals from oxygen atoms, the so-called dangling bonds in the valence band.48 The sample (H[Zn6O2(BO3)3]:0.07Tb) obtained at the highest temperature, possesses the largest volume and the smallest specific surface area. Therefore, it owns the fewest dangling bonds and the strongest band gap emission. The various structures will produce different crystal field environments for the doped activators, which further affects the luminescence properties of the as-prepared zinc borate phosphors.
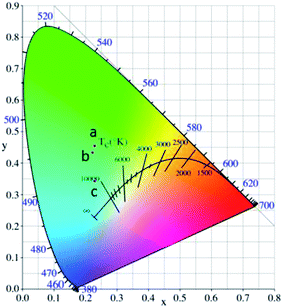
In the present case, by changing the reaction temperature, we can obtain different compositions and structures of zinc borate, which will affect the crystal field environment around the doped Tb3+ ions, and thus the color-tunable emission can be controlled through changing the structures of the zinc borate. The corresponding variation in the CIE chromaticity coordinates under a 225 nm UV lamp is demonstrated and summarized in Fig. 10. The color tone can be adjusted from green (0.230, 0.454), to light green (0.223, 434), to light blue (0.229, 0.342) in the zinc borate phosphors by varying the chemical composition of the solid solution phosphor.
Conclusions
Three different structures of zinc borates for Zn(H2O)B2O4·0.12H2O, Zn2(OH)BO3, and H[Zn6O2(BO3)3], and three different morphologies of Zn(H2O)B2O4·0.12H2O have been prepared through a hydrothermal method. The reaction-temperature-driven structural changes of zinc borate were discussed in detail. The reason why the pH value affected the morphology was also discussed in detail. The photoluminescence (PL) analysis results manifested that the 7% doped Zn(H2O)B2O4·0.12H2O sample possesses the highest intensity. Furthermore, the PL results indicated that the hexahedral morphology possesses the highest intensity. Moreover, the structure–property relationships of zinc borate have also been discussed.Acknowledgements
This study is supported by the National Natural Science Foundation of China (No. 21573142).Notes and references
- G. Seeta Rama Raju, E. Pavitra and J. S. Yu, Phys. Chem. Chem. Phys., 2014, 16, 18124 RSC.
- Z. G. Xia, J. Q. Zhuang and L. B. Liao, Inorg. Chem., 2012, 51, 7202 CrossRef CAS PubMed.
- L. P. Yi, J. L. Zhang, Z. X. Qiu, W. L. Zhou, L. P. Yu and S. X. Lian, RSC Adv., 2015, 5, 67125 RSC.
- K. Linganna, V. B. Sreedhar and C. K. Jayasankar, Mater. Res. Bull., 2015, 67, 196 CrossRef CAS.
- D. Y. Wang, T. M. Chen and B. M. Cheng, Inorg. Chem., 2012, 51, 2961 CrossRef CAS PubMed.
- L. S. Yang, G. S Li, M. L. Zhao, J. Zheng, X. F. Guang and L. P. Li, Nanotechnology, 2012, 23, 245602 CrossRef PubMed.
- X. Gong, Phys. Chem. Chem. Phys., 2013, 15, 10459 RSC.
- G. S. Han, S. Lee, D. W. Kim, D. H. Kim, J. H. Noh, J. H. Park, S. Roy, T. K. Ahn and H. S. Jung, Cryst. Growth Des., 2013, 13, 3414 CAS.
- S. Poongodi, P. S. Kumar, Y. Masuda, D. Mangalaraj, N. Ponpandian, C. Viswanathan and S. Ramakrishna, RSC Adv., 2015, 5, 96416 RSC.
- X. H. Yin, Q. Zhao, B. Q. Shao, W. Lv, Y. H. Li and H. P. You, CrystEngComm, 2014, 16, 5543 RSC.
- X. G. Kong, Z. L. Guo, P. H. Wen, J. F. Huang, L. Y. Cao, L. X. Yin, J. Y. Li and Q. Feng, CrystEngComm, 2015, 17, 3777 RSC.
- L. H. Chu, M. C. Li, Z. P. Wan, L. Ding, D. D. Song, S. Y. Dou, J. W. Chen and Y. Wang, CrystEngComm, 2014, 16, 11096 RSC.
- J. L. Song, C. L. Hu, X. Xu, F. Kong and J. G. Mao, Inorg. Chem., 2013, 52, 8979 CrossRef CAS PubMed.
- M. Hermus, P. C. Phan and J. Brgoch, Chem. Mater., 2016, 28, 1121 CrossRef CAS.
- X. C. Jiang, L. D. Sun and C. H. Yan, J. Phys. Chem. B, 2004, 108, 3387 CrossRef CAS.
- H. W. Yu, H. P. Wu, Q. Jing, Z. H. Yang, P. S. Halasyamani and S. L. Pan, Chem. Mater., 2015, 27, 4779 CrossRef CAS.
- P. Becker, Adv. Mater., 1998, 10, 979 CrossRef CAS.
- X. S. Wang, H. C. Pang, W. D. Chen, Y. Lin, L. S. Zong and G. L. Ning, ACS Appl. Mater. Interfaces, 2014, 6, 7223 CAS.
- A. Débart, B. Revel, L. Dupont, L. Montagne, J. B. Leriche, M. Touboul and J. M. Tarascon, Chem. Mater., 2003, 15, 3683 CrossRef.
- D. Vitzthum, M. Schauperl, C. M. Strabler, P. Bruggeller, K. R. Liedl, U. J. Griesser and H. Huppertz, Inorg. Chem., 2016, 55, 676 CrossRef CAS PubMed.
- G. J. Wang, Y. Jing, J. Ju, D. F. Yang, J. Yang, W. L. Gao, R. H. Cong and T. Yang, Inorg. Chem., 2015, 54, 2945 CrossRef CAS PubMed.
- W. L. Gao, Y. Jing, J. Yang, Z. Y. Zhou, D. Yang, J. L. Sun, J. H. Lin, R. H. Cong and T. Yang, Inorg. Chem., 2014, 53, 2364 CrossRef CAS PubMed.
- Z. Q. Zhang, W. C. Zhu, R. G. Wang, L. L. Zhang, L. Zhu and Q. Zhang, J. Mater. Chem. A, 2014, 2, 19167 CAS.
- Y. Q. Zhou, C. H. Fang, Y. Fang and F. Y. Zhu, Spectrochim. Acta, Part A, 2011, 83, 82 CrossRef CAS PubMed.
- B. Alp, M. Gönen, S. A. Savrık, D. Balköse and S. Ülkü, Drying Technol., 2012, 30, 1610 CrossRef CAS.
- T. Chen, J. C. Deng, L. S. Wang and G. Feng, J. Mater. Process. Technol., 2009, 209, 4076 CrossRef CAS.
- Y. H. Gao and Z. H. Liu, Thermochim. Acta, 2009, 484, 27 CrossRef CAS.
- X. X. Shi, L. J. Yuan, X. Z. Sun, C. X. Chang and J. T. Sun, J. Phys. Chem. C, 2008, 112, 3558 CAS.
- X. A. Chen, Y. H. Zhao, X. A. Chang, J. L. Zuo, H. G. Zang and W. Q. Xiao, J. Solid State Chem., 2006, 179, 3911 CrossRef CAS.
- J. Wang, A. Q. Zhang and Z. H. Liu, J. Chem. Thermodyn., 2015, 82, 88 CrossRef CAS.
- W. Massa, O. V. Yakubovich and O. V. Dimitrova, Acta Crystallogr., 2006, 62, 106 Search PubMed.
- Y. M. Tian, Y. P. Guo, M. Jiang, Y. Sheng, B. Hari, G. Y. Zhang, Y. Q. Jiang, B. Zhou, Y. C. Zhu and Z. C. Wang, Mater. Lett., 2006, 60, 2511 CrossRef CAS.
- A. Choudhury, S. Neeraj, S. Natarajan and C. N. R. Rao, J. Chem. Soc., Dalton Trans., 2002, 1535 RSC.
- J. B. Chang, P. X. Yan and Q. Yang, J. Cryst. Growth, 2006, 286, 184 CrossRef CAS.
- P. X. Yan, J. Z. Liu, J. Wang and Z. G. Wu, Appl. Phys. Lett., 2004, 85, 4747 CrossRef CAS.
- G. Pozza, D. Ajò, M. Bettinelli, A. Speghini and M. Casarin, Solid State Commun., 1996, 97, 521 CrossRef CAS.
- G. V. S. S. Sarma, C. Venkata Reddy, S. V. Prabhakar Vattikuti, C. Rama Krishna, P. Narayana Murthy and R. V. S. S. N. Ravikumar, J. Mol. Struct., 2013, 1048, 64 CrossRef CAS.
- J. Li, C. X. Zhang, Q. Tang, Y. L. Zhang, J. Q. Hao, Q. Su and S. B. Wang, J. Phys. Chem. Solids, 2007, 68, 143 CrossRef CAS.
- E. Erdoğmuş and E. Korkmaz, Optik, 2014, 125, 4098 CrossRef.
- A. Thulasiramudu and S. Buddhudu, Spectrochim. Acta, Part A, 2007, 66, 323 CrossRef CAS PubMed.
- Z. T. Yu, J. J. Xu, Y. S. Jiang, Z. Shi, Y. Guo, D. J. Wang and J. S. Chen, J. Mater. Chem., 2003, 13, 2227 RSC.
- Q. Liu, J. M. Yang, L. N. Jin and W. Y. Sun, CrystEngComm, 2016, 18, 4124 Search PubMed.
- Q. Kuang, X. Wang, Z. Y. Jiang, Z. X. Xie and L. S. Zheng, Acc. Chem. Res., 2014, 47, 308 CrossRef CAS PubMed.
- C. H. Zhang, H. B. Liang, S. Zhang, C. M. Liu, D. J. Hou, L. Zhou, G. B. Zhang and J. Y. Shi, J. Phys. Chem. C, 2012, 116, 15932 CAS.
- L. L. Wei, C. C. Lin, M. H. Fang, M. G. Brik, S. F. Hu, H. Jiao and R. S. Liu, J. Mater. Chem. C, 2015, 3, 1655 RSC.
- D. Yue, W. Lu, C. Y. Li, X. L. Zhang, C. X. Liu and Z. L. Wang, Nanoscale, 2014, 6, 2137 RSC.
- P. Liang and Z. H. Liu, CrystEngComm, 2016, 18, 1311 RSC.
- H. Lin, G. Zhang, P. A. Tanner and H. Liang, J. Phys. Chem. C, 2013, 117, 12769 CAS.
| This journal is © The Royal Society of Chemistry 2017 |


