
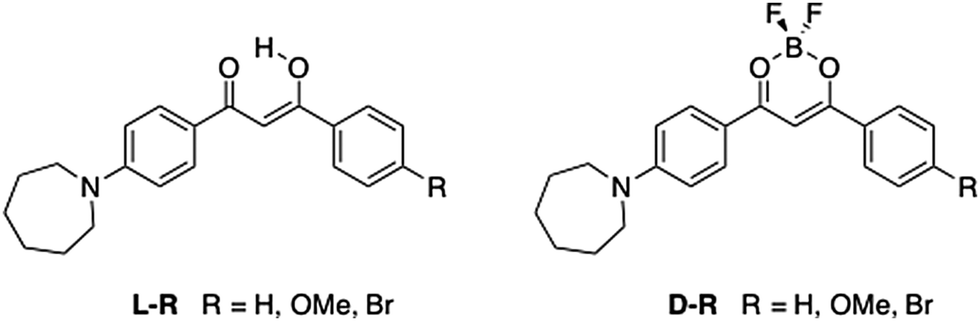
Multi-stimuli responsive luminescent azepane-substituted β-diketones and difluoroboron complexes†
Fang
Wang
a,
Christopher A.
DeRosa
a,
Margaret L.
Daly
a,
Daniel
Song
a,
Michal
Sabat
b and
Cassandra L.
Fraser
 *a
*a
aDepartment of Chemistry, University of Virginia, McCormick Road, Charlottesville, Virginia 22904, USA. E-mail: fraser@virginia.edu
bDepartment of Materials Science and Engineering, University of Virginia, 395 McCormick Road, Charlottesville, Virginia 22904, USA
First published on 25th May 2017
Abstract
Difluoroboron β-diketonate (BF2bdk) compounds show environment-sensitive optical properties in solution, aggregation-induced emission (AIE) and multi-stimuli responsive fluorescence switching in the solid state. Here, a series of 4-azepane-substituted β-diketone (bdk) ligands (L-H, L-OMe, L-Br) and their corresponding difluoroboron dyes (D-H, D-OMe, D-Br) were synthesized, and various responsive fluorescence properties of the compounds were studied, including solvatochromism, viscochromism, AIE, mechanochromic luminescence (ML) and halochromism. Compared to the β-diketones, the boron complexes exhibited higher extinction coefficients but lower quantum yields, and red-shifted absorption and emission in CH2Cl2. Computational studies showed that intramolecular charge transfer (ICT) dominated rather than π–π* transitions in all the compounds regardless of boron coordination. In solution, all the bdk ligands and boron dyes showed red-shifted emission in more polar solvents and increased fluorescence intensity in more viscous media. Upon aggregation, the emission of the β-diketones was quenched, however, the boronated dyes showed increased emission, indicative of AIE. Solid-state emission properties, ML and halochromism, were investigated on spin cast films. For ML, smearing caused a bathochromic emission shift for L-Br, and powder X-ray diffraction (XRD) patterns showed that the “as spun” and thermally annealed states were more crystalline and the smeared state was amorphous. No obvious ML emission shift was observed for L-H or L-OMe, and the boronated dyes were not mechano-active. Trifluoroacetic acid (TFA) and triethylamine (TEA) vapors were used to study halochromism. Large hypsochromic emission shifts were observed for all the compounds after exposure to TFA vapor, and reversible fluorescence switching was achieved using the acid/base pair.
Introduction
Small-molecule fluorescent probes based on organic dyes have been intensively studied for decades for fundamental research and biological applications in sensing and imaging.1–4 Among these, environment-sensitive dyes can change fluorescence color or intensity in response to changes in local properties, such as polarity and viscosity.5 Solvatochromic dyes are classic environmentally sensitive probes and often possess electron donor (D) and acceptor (A) groups. Upon light absorption, such dyes undergo an intramolecular charge transfer (ICT) from the donor to the acceptor to produce a highly polar excited state, and interactions with the dipoles of different solvents lead to different emission wavelengths.5,6 Given their sensitivity to polarity, solvatochromic dyes have been used to monitor intrinsic biophysical properties of membranes, such as hydration and electrostatics.7 Viscochromic dyes, on the other hand, possess molecular rotors that form twisted intramolecular charge transfer (TICT) states3 upon excitation, and formation of TICT states results in an increase in non-radiative decay.8 In a viscous medium, fluorescence intensity can be enhanced by restricting intramolecular twisting.4 Molecular rotors have found use in probing cell membranes. For example, a boron-dipyrromethene (BODIPY) derivative was used for measuring the membrane viscosity of living cells.9Fluorescent dyes with highly hydrophobic emitting centers, usually aromatic rings, tend to aggregate in polar protic solvents (e.g. H2O).10 Dye aggregation typically generates two effects on emission processes: aggregation-caused quenching (ACQ) or aggregation-induced emission (AIE).11 When an ACQ dye (e.g. N,N-dicyclohexyl-1,7-dibromo-3,4,9,10-perylenetetracarboxylic diimide) aggregates, its emission is quenched due to strong π–π interactions.12 In contrast, dyes that exhibit AIE (e.g. hexaphenylsilole) emit brightly in the aggregate state.13 Mechanistic studies show that AIE arises when there is restriction of intramolecular motion (RIM) upon complex formation, including restriction of intramolecular rotation (RIR) or intramolecular vibration (RIV).14 Dyes with AIE can be utilized as biosensors for proteins, amino acids and lipids.15 For example, a water-soluble AIE dye was used for cardiolipin phospholipid sensing and quantitative analysis.16
In the solid state, stimuli-responsive fluorescence switching, such as mechanochromic luminescence and halochromism for pH sensitivity, has also attracted growing attention in recent years.17–20 Mechanochromic luminescent (ML) materials change emission color due to differences in molecular packing when external mechanical stimuli such as grinding and smearing are applied.19,21 These materials have many potential uses, such as security inks, light-emitting diodes and mechanical sensors.19 For halochromism, when annealed by acid or base vapors, stimuli-responsive materials adopt protonated or deprotonated forms respectively. Due to frontier molecular orbital (FMO) changes, large emission wavelength shifts can be obtained in halochromic materials, which have potential applications in sensing and detection.20
Recently, a general method to improve the brightness of fluorescent dyes was reported by Lavis et al., where N,N-dimethyl groups in tetramethylrhodamine (TMR) were replaced with a series of nitrogen-containing rings of different sizes, ranging from aziridine (three-membered ring) to azepane (seven-membered ring).22 It was found that increased ring sizes resulted in a bathochromic shift in both absorption and emission, and the azepane derivative had an extinction coefficient (ε) ∼30% higher than other derivatives.22 In addition, a follow-up study by Lavis et al., showed that the azepane derivative worked as an effective membrane probe.23 Inspired by this idea and the potential for other responsive properties associated with bdks, BF2bdks, and basic amine donor groups, a series of azepane-substituted β-diketones (ligands, L) and difluoroboron complexes (dyes, D) were investigated (Fig. 1). Along with hydrogen, methoxy and bromo substituents were introduced into the 4′ position on the other phenyl ring to assess electron donating and withdrawing effects on luminescence properties, respectively. Difluoroboron β-diketonates (BF2bdks) with azepane substitution consist of a donor (nitrogen substituted phenyl ring) and an acceptor (dioxaborine or Br-phenyl ring); thus, solvatochromism is hypothesized to be present as a result of these electronic effects (i.e. charge transfer). Moreover, the seven-membered azepane ring or the azepane-substituted aryl group can function as intramolecular rotors, which can lead to viscochromism. Protonation and deprotonation of the nitrogen atom also make halochromism possible. Furthermore, many BF2bdks can be efficiently excited by both 1- and 2-photon absorption, to display bright, color tunable emission with quantum yields (ϕ) that approach unity.24 Additional benefits of the azepane substituent include larger ε values that contribute to high brightness (ε × ϕ), and strong amine donors that can redshift emission, expanding the set of achievable emission colors for multiplexing applications. In vivo applications require further bathochromic shifts of the absorption and emission to minimize phototoxicity and interference from autofluorescence,25,26 and to achieve deep tissue probing.27 Fluorescent analogues of natural lipids have been designed and synthesized to probe specific lipid environments.28 Long hydrophobic chains, commonly seen in those systems, make them more compatible with lipid bilayer membranes.2 With similar features, the bulky and hydrophobic azepane ring also has potential to serve as a lipid probe.
 | ||
| Fig. 1 Chemical structures of azepane-substituted β-diketones and difluoroboron dyes. | ||
Experimental methods
Materials
Solvents, CH2Cl2 and THF, were dried over 3 Å molecular sieves activated at 300 °C for three days prior to use.29 Silica TLC plates were used to monitor reactions. Chemicals purchased from TCI and Sigma-Aldrich were reagent grade and used without further purification. The starting material for synthesis of the β-diketones, 1-(4-(azepan-1-yl)phenyl)ethan-1-one, was prepared as previously described.30Methods
1H NMR spectra were recorded on a Varian NMRS 600 (600 MHz) instrument in deuterated DMSO or CDCl3. Peaks were referenced to the signals for residual protio-DMSO at 2.50 ppm or protiochloroform at 7.26 ppm, and the units of coupling constants were given in Hz. Mass spectra were achieved by a Micromass Q-TOF Ultima spectrometer using electrospray ionization (ESI). UV-Vis spectra were recorded using a Hewlett-Packard 8452A diode-array spectrophotometer. Steady-state fluorescence emission spectra were collected on a Horiba Fluorolog-3 Model FL3-22 spectrofluorometer with double-grating excitation and a double-grating emission monochromator. Fluorescence quantum yields of the ligands in CH2Cl2 were calculated against a dilute solution of quinine sulfate in 0.1 M H2SO4 as a standard using a previously reported method,31 with the following values: ϕF (quinine sulfate) = 0.53,31,32λex = 366 nm, nD20 (0.1 M H2SO4) = 1.333, nD20 (CH2Cl2) = 1.424.33 Rhodamine 6G in EtOH was used as a standard solution in quantum yield measurements for the boron complexes in CH2Cl2, using the same method as for the ligands,31 with the following values: ϕF (rhodamine 6G) = 0.94,34λex = 488 nm, nD20 (EtOH) = 1.361, nD20 (CH2Cl2) = 1.424.33 Time-correlated single-photon counting (TCSPC) fluorescence lifetime measurements were conducted with a NanoLED-370 excitation source (λex = 369 nm), and a DataStation Hub as the SPC controller. DataStation v2.4 software from Horiba Jobin Yvon was used to analyze lifetime data. Differential scanning calorimetry (DSC) experiments for β-diketone and boron complex pristine powders were conducted on a TA Instruments DSC 2920 Modulated DSC. Thermograms were obtained with a temperature ramp rate of 5 °C min−1 using the standard mode. After the first conditioning cycle, a second scan was run and reported. The Universal Analysis Software V 2.3 from TA Instruments was used to analyze DSC data. Powder X-ray diffraction patterns were collected by a Panalytical X'Pert Pro MPD diffractometer, which was operated at 40 kV and 40 mA with Cu Kα radiation.To conduct solvatochromism, viscochromism and AIE experiments, stock solutions of each compound in CH2Cl2 were first prepared. To obtain 10−5 M solutions, calculated volumes of the stock solutions were added into several vials, and CH2Cl2 was allowed to evaporate in air. Binary solvent pairs with proper ratios were added into the vials, then UV excited images were taken before UV-Vis and fluorescence emission spectra for the solutions were measured.
Thin films needed for powder XRD characterization, ML and halochromism experiments were prepared on 18 × 18 mm microscope cover glass. For ML and halochromism, the sample-coated films were produced by applying ∼20 drops of saturated solution to the coverslips while spinning at 3000 rpm. The thin films were then dried in vacuo for 15 min prior to use. To fabricate thin films for XRD characterization, ∼40 drops of saturated solution were simply cast onto the coverslips, and the films were allowed to evaporate in air.
Halochromism experiments were conducted on spin cast films that were prepared as described above. First, emission spectra were recorded for the films in the “as spun” (AS) state, then samples were placed in containers saturated with acid (TFA) or base (Et3N) vapor. After annealing with acid and base vapors (acid annealing time: ∼18 h for the ligands and ∼5 h for the dyes; base annealing time: ∼18 h for all the compounds), emission spectra were measured for the thin films in acid annealed (AA) and base annealed (BA) states respectively.
Results and discussion
Synthesis and optical properties in solution
The β-diketonate ligands (L) with tunable optical properties were easily prepared via Claisen condensation using a previously reported method.35 The boronated dyes (D) were synthesized by reaction of the ligands with boron difluoride diethyl etherate.36 Details for synthesis, including NMR and MS data, are included in the ESI.† Optical properties for the ligands and dyes were measured for 10−5 M CH2Cl2 solutions. UV-Vis absorption (λabs), extinction coefficients (ε), fluorescence emission maxima (λem), quantum yields (ϕ) and fluorescence lifetimes (τ) are listed in Table 1. Absorption and emission spectra for each compound are provided in the ESI† (Fig. S1).| Compound | λ abs (nm) | ε (M−1 cm−1) | λ em (nm) | Φ | τ (ns) |
|---|---|---|---|---|---|
| a Absorbance maxima in air (λex = 369 nm). b Extinction coefficients. c Fluorescence maxima in air (λex = 369 nm). d Quantum yield. e Fluorescence lifetimes in air (λex = 369 nm LED). Data were fit to double exponential decay. | |||||
| L-H | 412 | 37![[thin space (1/6-em)]](https://www.rsc.org/images/entities/char_2009.gif) 800 800 |
491 | 0.26 | 1.16 |
| L-OMe | 414 | 35100 |
476 | 0.50 | 1.78 |
| L-Br | 418 | 34600 |
503 | 0.19 | 0.89 |
| D-H | 471 | 61500 |
543 | 0.02 | 1.20 |
| D-OMe | 474 | 78600 |
538 | 0.33 | 1.74 |
| D-Br | 478 | 65000 |
545 | 0.02 | 1.90 |
Compared to the β-diketonate ligands, the boronated dyes showed red-shifted absorption and fluorescence (e.g.L-H: λabs = 412 nm, λem = 491 nm; D-H: λabs = 471 nm, λem = 543 nm) and higher extinction coefficients than the ligands for each substituent (e.g.L-H: ε = 37800; D-H: ε = 61500). However, coordination of boron sharply decreased the quantum yields of the β-diketones (e.g.L-H: Φ = 0.26; D-H: Φ = 0.02). This is an interesting phenomenon that opposes the trend in a previous paper, in which the difluoroboron complexes have much higher quantum yields than their ligand counterparts.37 This observation is probably due to enhanced ICT and associated non-radiative decay pathways in the dyes compared to the ligands in polar solvents (e.g. CH2Cl2).38 Moreover, methoxy substitution resulted in a higher quantum yield in the boron dyes (D-H: Φ = 0.02; D-OMe: Φ = 0.33; D-Br: Φ = 0.02), which is consistent with the trend in a previous study.39 From the emission spectra in CH2Cl2 (Fig. S1b, ESI†), the dyes showed blue shoulders on the dominant peaks, suggesting more than one emissive species in solution. After analyzing the lifetime data, all the compounds showed double exponential decay, which demonstrated the presence of multiple emissive species.
The absorption spectra (Fig. S1a, ESI†) also showed multiple peaks for all the compounds, suggesting multiple energy transitions were present. In support of this observation, density functional theory (DFT) calculations of frontier molecular orbital energies were conducted (Fig. 2 and Table S1, ESI†). As shown in Fig. 2 for D-OMe, electron density resides mainly on the azepane-substituted phenyl ring in the highest occupied molecular orbital (HOMO). In the HOMO−1, the electron density is mostly localized on the methoxy-substituted phenyl ring. Transitions from different occupied molecular orbitals to the lowest unoccupied molecular orbital (LUMO) may account for multiple peaks in the absorption spectrum (Fig. S1a, ESI†). The major transition is from the HOMO to the LUMO, indicating that the major donating group in the molecule is the azepane ring rather than the methoxy substituent. DFT calculations were also utilized to predict UV-Vis spectra (Table S1, ESI†). Although the predicted peak shape is not exactly the same as the experimental one, the absorption peak wavelengths are still comparable (e.g. experimental absorption peaks for D-OMe: 474 nm and 348 nm; DFT predicted ones: 456 nm and 349 nm). As shown in Fig. 2, despite switching from methoxy substituent (electron donating group) to bromo substituent (electron withdrawing group), no obvious changes are observed in the molecular orbitals. According to the molecular orbitals of all the ligands and dyes generated by DFT calculations (Fig. 2 and Table S1, ESI†), the HOMO of each compound showed electron density mostly localized on the azepane-substituted phenyl ring, but delocalized throughout the molecule in the LUMO. These results indicate that all the compounds undergo predominantly ICT transitions rather than π–π* transitions regardless of boron coordination.37,39 An example of an excited-state calculation (D-H) utilizing time-dependent density functional theory (TD-DFT) is shown in the ESI† (Table S2). The optimized excited-state geometry is entirely twisted on the azepane substituted aryl ring (Table S2, ESI†), indicating the formation of the TICT state.40 In the calculated emission spectrum (Table S2, ESI†), the red emission from the TICT state is negligible, with an oscillator strength of 0.0001. This is consistent with the experimental dark emission in CH2Cl2. Large Stokes shifts of the ligands (L-H: 3905 cm−1; L-OMe: 3146 cm−1; L-Br: 4043 cm−1) and the dyes (D-H: 2815 cm−1; D-OMe: 2510 cm−1; D-Br: 2572 cm−1) also suggest molecular geometry changes upon excitation, which are typical for ICT character.3
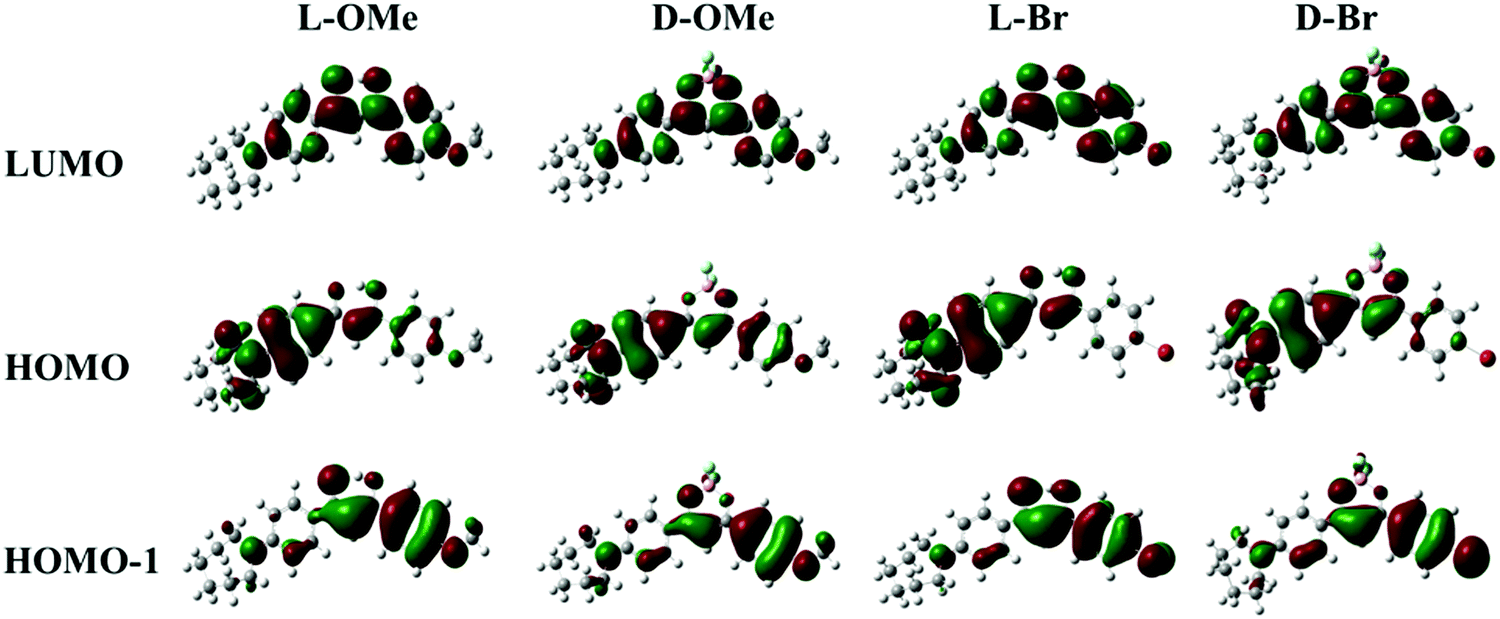 | ||
| Fig. 2 DFT calculated frontier molecular orbitals for L-OMe, D-OMe, L-Br and D-Br. | ||
Solvatochromism
Since ICT is present, all the compounds are expected to show solvatochromic properties.5,6 In order to understand the effect of polarity, the absorption and emission spectra were taken for the ligand and dye solutions (10−5 M) in solvents with different polarities (i.e. solvent dipole moments range from 0.36 D for toluene to 3.92 D for acetonitrile)41 (Fig. 3 and Fig. S2–S6, ESI†). Using L-H as an example (Fig. 3), as the solvent polarity was increased, a solvatochromic shift from blue to green was clearly visible upon UV irradiation (Fig. 3a). Both absorption and emission maxima showed bathochromic shifts, but solvent polarity affected emission more than absorption (Fig. 3b and c). Methanol is a polar protic solvent, acetone and acetonitrile are polar aprotic solvents, and the remaining solvents are relatively nonpolar and aprotic. In highly polar solvents such as methanol, acetone and acetonitrile, L-H showed weak emission compared to the other solvents. The shift in emission occurred over a wide wavelength range for L-H (69 nm). According to the emission spectra of the ligands and dyes (Fig. 3c and Fig. S2–S6, ESI†), the most blue-shifted emissions observed for all the compounds were when dissolved in toluene. Whereas, methanol solutions of L-OMe, L-Br, D-OMe and D-Br showed the most red-shifted emissions, L-H and D-H, had the most red-shifted emissions in acetonitrile and chloroform respectively. For different compounds, interactions with different polar solvents most stabilized the local excited states and thus led to the most bathochromic emission shifts.42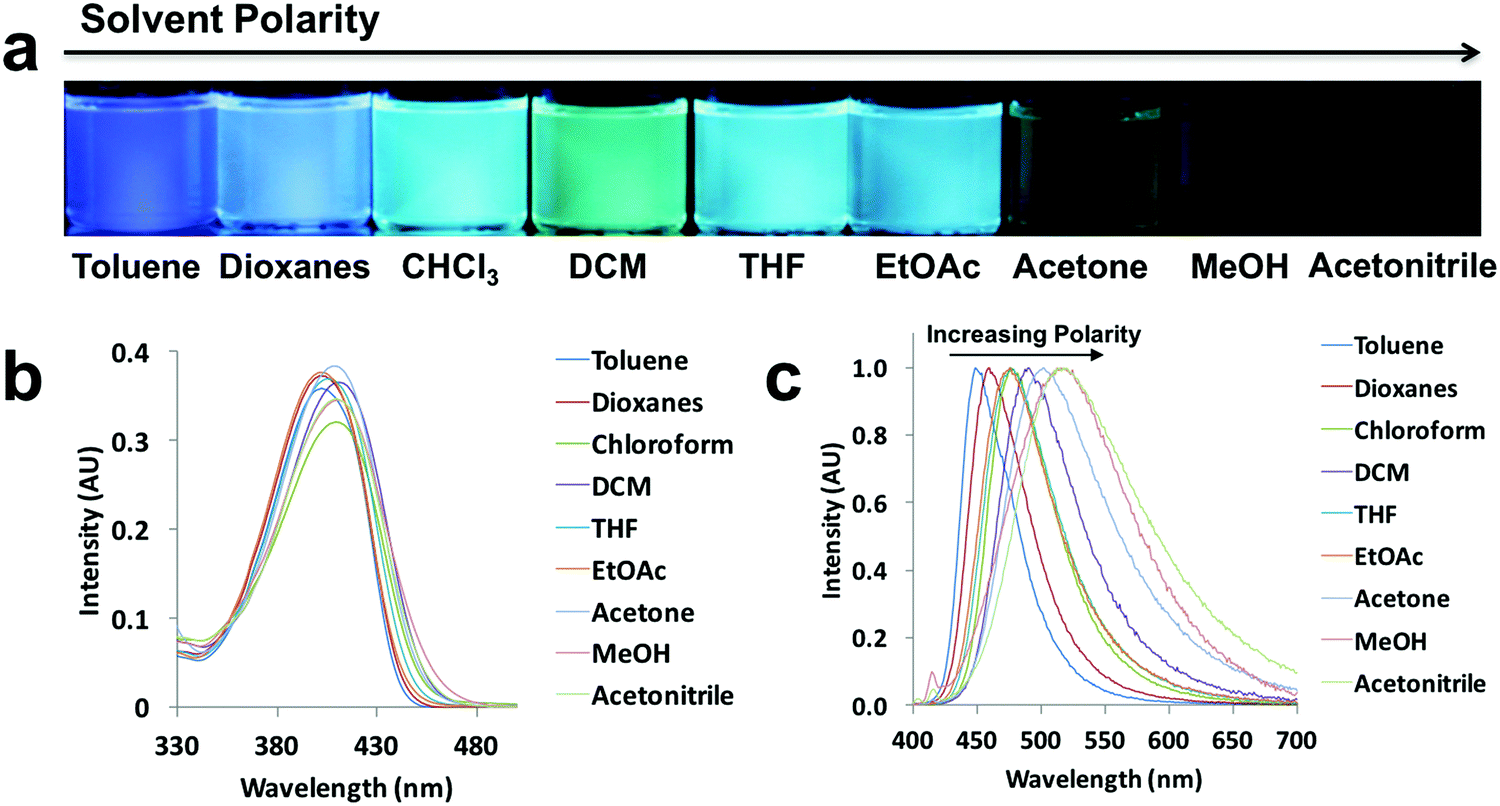 | ||
| Fig. 3 Solvatochromism of L-H: (a) UV excited images, (b) absorption spectra, (c) and normalized emission spectra in the indicated solvents (λex = 369 nm). | ||
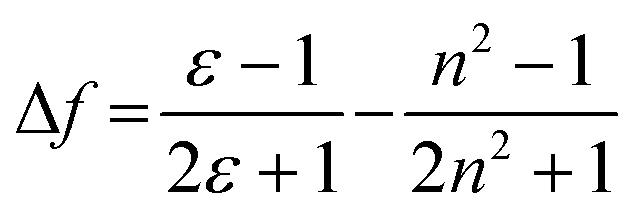
These results show positive solvatochromic shifts in both the ligands and dyes. Moreover, by plotting the Stokes shifts (Δν) against the orientational polarizability (Δf) of the solvents, an approximately linear relationship is shown in the Lippert–Mataga plots for the azepane ligands and dyes (Fig. S7, ESI†). The positive slope of the plots demonstrates positive solvatochromism in these compounds. The orientational polarizability, however, can be calculated with different equations:
 | (1) |
 | (2) |
Viscochromism
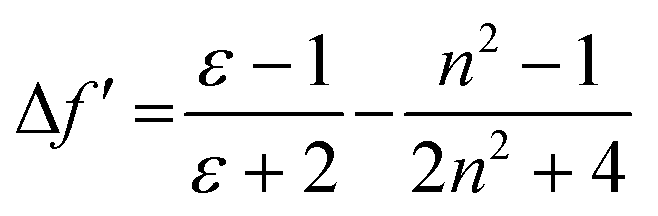
In order to explore the behaviors of the compounds in environments with various viscosities, two binary solvent systems were chosen, namely, DMSO/acetonitrile for the ligands and dioxane/EtOAc for the dyes. Polar protic solvents (e.g. ethylene glycol) were not chosen, given the dyes showed limited solubility. The ligands were dissolved in DMSO (viscosity: 1.996 cP at 25 °C)/acetonitrile (viscosity: 0.3417 cP at 25 °C) binary mixtures44 to achieve a series of solutions with similar polarities (similar dipole moments: 3.92 D for acetonitrile and 3.96 D for DMSO) and the same concentration (10−5 M), but different viscosities (Fig. 4 and Fig. S9, S10, ESI†). For example, L-Br (Fig. 4) was dissolved in DMSO/acetonitrile solvent mixtures with different compositions, from 0–100% acetonitrile. Upon UV irradiation, the emissions became darker as acetonitrile fractions (fa) increased (Fig. 4a). The observation was supported by the emission spectra, in which fluorescence intensity decreased when larger percentages of acetonitrile were present (Fig. 4b), suggesting potential application of the ligand as a viscosity sensor. The plot of relative intensity versus acetonitrile percentage (Fig. 4c) further demonstrated a negative intensity trend, indicating viscochromism.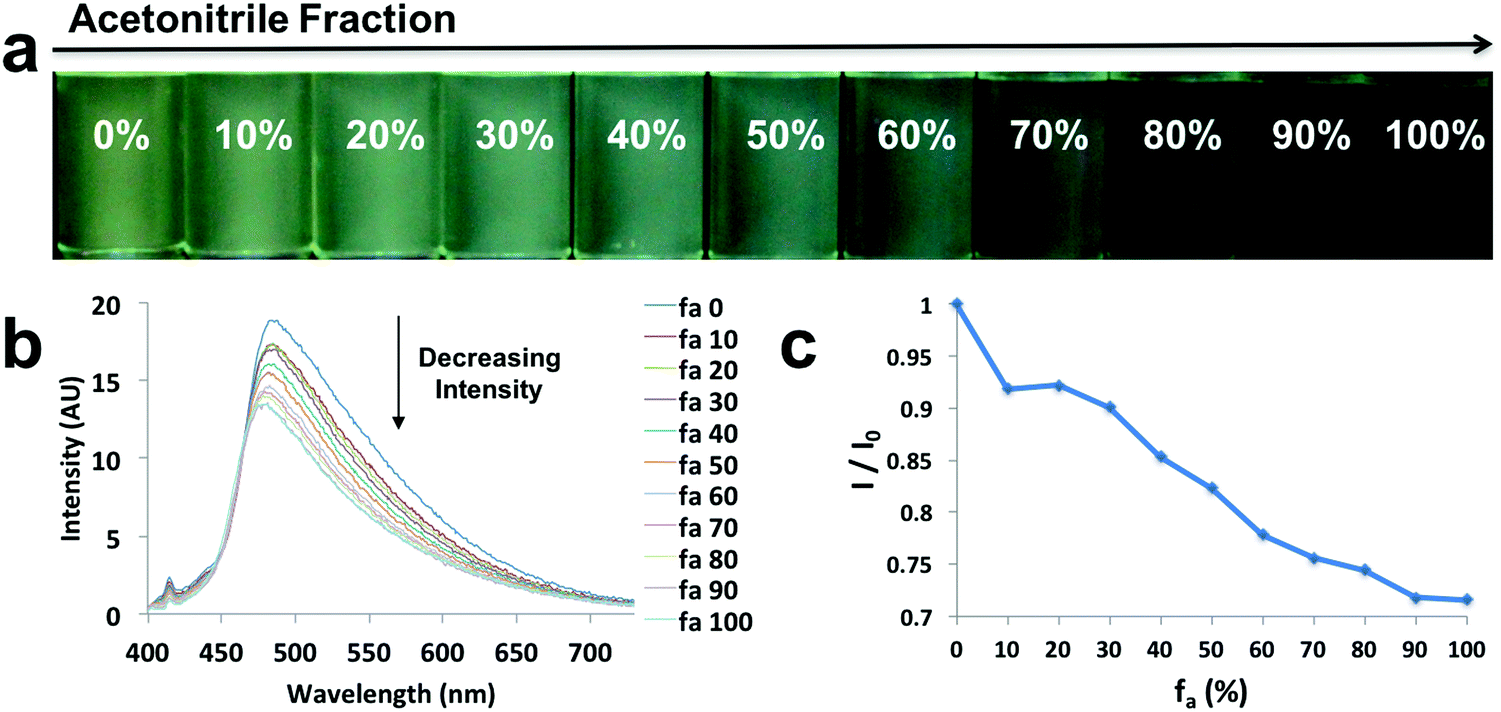 | ||
| Fig. 4 Viscochromism of L-Br: (a) UV excited images, (b) emission spectra in the indicated DMSO/acetonitrile compositions (λex = 369 nm), (c) and plot of relative intensity (I/I0) versus acetonitrile percentage. | ||
A small hypsochromic shift (∼10 nm) in emission maxima was observed (Fig. 4b), probably due to the slight effect of solvatochromism. For boronated dyes (Fig. 5 and Fig. S11, S12, ESI†), the DMSO/acetonitrile binary system was not applied, as the dyes showed only weak emissions in this polar solvent mixture. Instead, a dioxane (viscosity: 1.37 cP at 20 °C)/EtOAc (viscosity: 0.45 cP at 20 °C) binary system was adopted. Once again, the effect of solvatochromism was minimized as the two solvents have similar polarity (Et (30) values: 36 kcal mol−1 for dioxane and 38.1 kcal mol−1 for EtOAc).45 A representative example of a viscochromic dye, D-OMe, is shown in Fig. 5; a similar procedure as described for L-Br was utilized. The effect of solvatochromism could almost be neglected as no emission maximum shifts were observed when the solvent mixtures changed (Fig. 5b). Fig. 5a and b showed a clear downward trend of emission intensity as viscosity decreased, indicating that D-OMe tends to emit more brightly in more rigid/viscous environment. According to the emission spectrum (Fig. 5b), there were two emissive species with peak wavelengths, around 430 nm (Species 1) and 510 nm (Species 2). Interestingly, a change in environment viscosity affects the emission intensity of Species 2 but not Species 1. The plot of relative intensity of Species 2 over Species 1 (I2/I1) versus EtOAc percentage showed a clear negative trend (Fig. 5c), indicating potential application as a ratiometric sensor in the green channel. The mechanism of viscochromism for the azepane ligands and dyes arises from the formation of a TICT state upon excitation. This is supported by the twisted excited-state geometry in the TD-DFT calculations and analyses of the Lippert–Mataga plots in the solvatochromism section. In more viscous solvents, restriction of intramolecular twisting results in less non-radiative decay from the TICT state and consequently, gives rise to enhanced emission.
 | ||
| Fig. 5 Viscochromism of D-OMe. (a) UV excited images, (b) emission spectra in the indicated dioxane/EtOAc compositions (λex = 369 nm), and (c) plot of relative intensity of Species 2 over Species 1 (I2/I1) versus EtOAc percentage (fe). | ||
Aggregation-induced emission
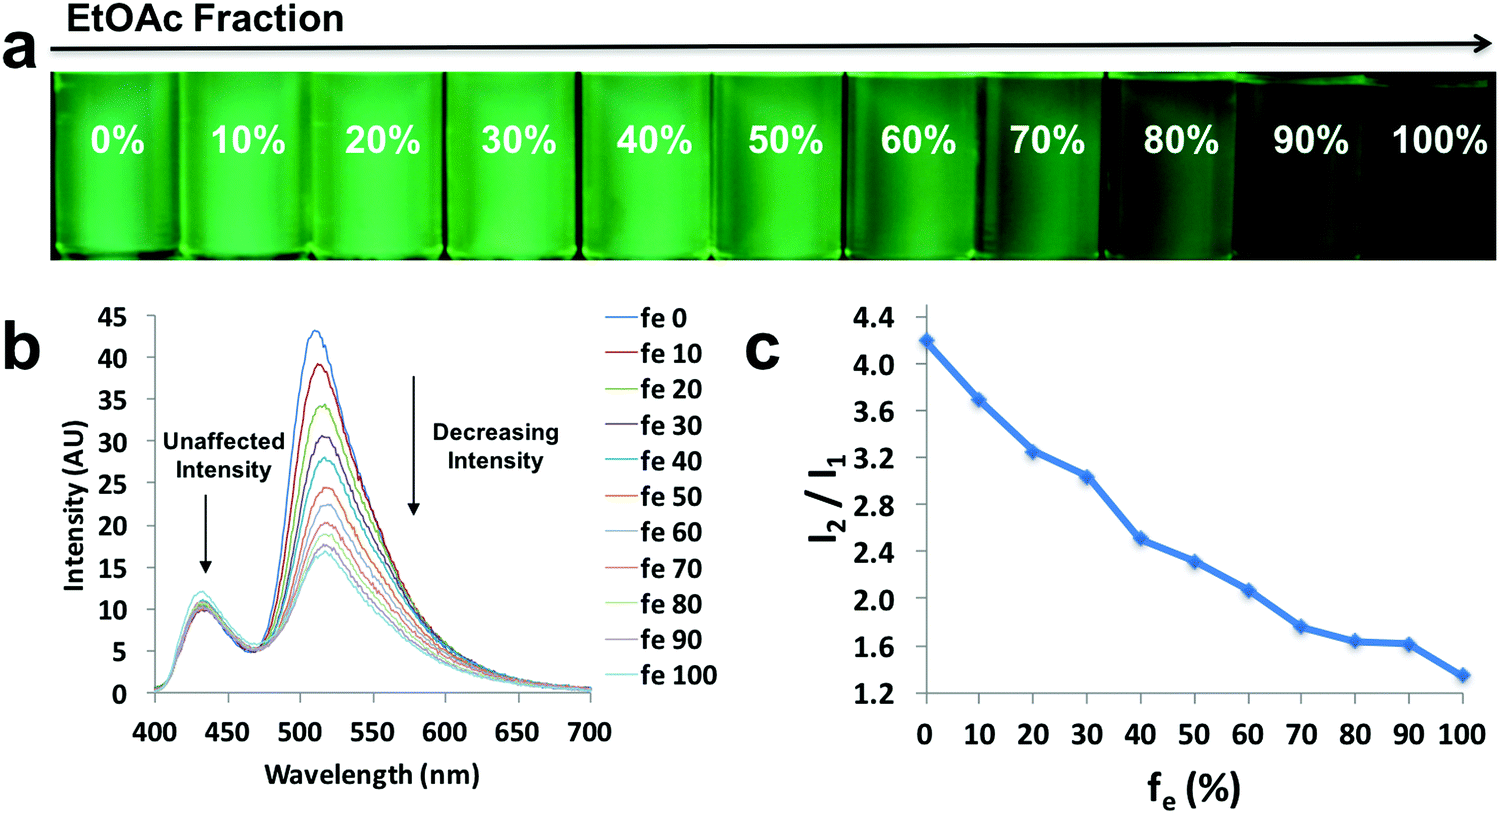
Environment-sensitive properties, such as solvatochromism, are usually applied in dilute solutions (e.g. 10−5 M).46 However, when the solubility of a dye decreases in a given medium, a very concentrated solution is formed, and ultimately, a transition from the solution state to an aggregate state can occur with ACQ or AIE.14 After testing the environment-sensitive properties of diketones and boron dyes in solution, AIE experiments were performed. The azepane-substituted ligands and their boron complexes were dissolved in THF/water mixtures with different compositions, ranging from 0% to 95% of water, but with the same dye concentration (10−5 M). Water is a poor solvent, inducing AIE. The absorption and emission spectra were obtained (Fig. 6 and Fig. S13–S17, ESI†). All the ligands showed ACQ properties; emission intensities decreased when water fractions were increased (Fig. S13–S15, ESI†). But for the boron complexes (D-H, D-OMe, D-Br), there was an increase in emission intensity with aggregation, indicative of AIE (Fig. 6 and Fig. S16, S17, ESI†). Upon UV irradiation, a green to red emission shift was observed in D-Br as the water fraction was increased from 0–95% (Fig. 6a). From 0–70% water, D-Br was dissolved and showed solvatochromism, as addition of water increased the overall polarity of the solution. As a result, bathochromic shifts and decreasing intensities were observed due to ICT (Fig. 6c).14 When the percentage of water reached 80%, dominating red AIE (∼669 nm) appeared as well as the existing weak emission in solution (∼527 nm) (Fig. 6a and c). This strong AIE peak showed a large bathochromic shift up to 151 nm compared to the emission maximum in pure THF. This observation was further supported by the absorption spectra (Fig. 6b), in which absorption increased dramatically for water fractions above 80%. Thus, all the emission came from AIE when the water fraction was increased to 90% and 95% (Fig. 6c). | ||
| Fig. 6 AIE experiment of D-Br: (a) UV excited images, (b) absorption spectra, (c) and emission spectra in the indicated THF/water compositions (λex = 369 nm). | ||
Mechanochromic luminescence
That the dyes show AIE suggests that the azepane-substituted compounds should have interesting solid-state emission properties, such as mechanochromic luminescence and halochromism for pH sensitivity. The boron complexes were not mechano-active, so ML investigations focused on the β-diketones. Spin cast films were studied in “as spun” (AS), thermally annealed (TA) and smeared (SM) states, which were prepared as described in the ESI.† Typically, the AS state is amorphous; however, some AS films are crystalline.35 After thermal annealing, films become crystalline, but when these TA films are smeared, an amorphous state is produced.47 A transition from amorphous to crystalline is achieved by heating the sample above the crystallization temperature (Tc), but below the melting temperature (Tm) to circumvent the formation of possible amorphous melt quenched or supercooled states.48 Emission wavelength shifts are observed as a result of the amorphous to crystalline transition.49,50 To determine the crystallization and melting temperatures, differential scanning calorimetry (DSC) was used to characterize the thermal properties of the pristine powders (Fig. S18, ESI†). The sharp exothermic peak of L-H indicated its Tc at ∼56 °C, but for the other two ligands, very broad crystallization peaks almost merging with the melting ranges were observed in the DSC curves with ∼104 °C (L-OMe) and ∼103 °C (L-Br) maxima. The melting peak of L-Br was determined to be ∼125 °C, but the melting range was wide and actual melting started at ∼110 °C. Therefore, the annealing temperature for L-Br was chosen to be 100 °C to avoid melting. Similarly, the annealing temperature for L-OMe was also set at 100 °C. For L-H, an annealing temperature optimization process36 was conducted by annealing six thin films (annealing time: 10 min for each film) at 60 °C, 70 °C, 80 °C, 90 °C, 100 °C, 110 °C, respectively, and measuring emission spectra for all the films (Fig. S19a, ESI†). The optimized annealing temperature for L-H was chosen as 110 °C given the emission was most blue-shifted in this case. For ML, previous studies associated blue shifted emission with crystalline species, and red shifted fluorescence with amorphous forms.49,50 Therefore, according to Fig. 7a, the TA film of L-Br was speculated to be more crystalline with an emission maximum at 502 nm (more blue shifted), and the SM film was amorphous with an emission peak at 542 nm (more redshifted). Upon smearing, a large bathochromic shift of ∼40 nm was obtained. There were two merging peaks in the AS emission spectrum, indicating a mixture of polymorphs. Structural characterization was performed by X-ray powder diffraction, and XRD patterns of pristine powder, AS, TA, SM films were achieved (Fig. 7b and Fig. S19b, S20b, ESI†). By comparing the patterns of the thin films to that of powder, the TA film was most crystalline as small peaks were present and the AS film was partially crystalline. Smearing led to a phase transition to an amorphous state, demonstrated by the absence of diffraction peaks.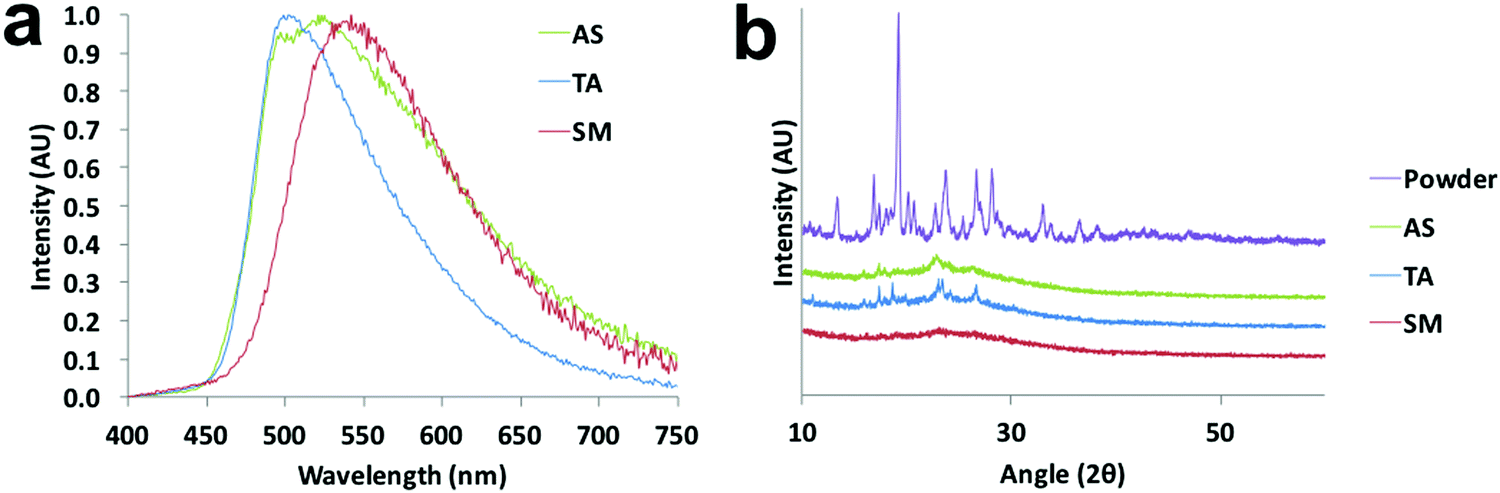 | ||
| Fig. 7 Solid-state characterization of L-Br: (a) normalized emission spectra of the as spun (AS), thermally annealed (TA) and smeared (SM) states (λex = 385 nm, annealing temperature = 100 °C). (b) Powder XRD patterns of pristine powder and spin cast films in the indicated states. | ||
To gain insight into molecular packing details, single crystals of L-H were grown by recrystallization from acetone/hexanes. Crystal structure analysis showed that L-H adopts a mostly planar conformation except for the out-of-plane azepane ring (Fig. 8a). Fig. 8b highlights the intermolecular interactions, including C–H⋯O hydrogen bonding, C–H⋯arene interactions and short H⋯H contacts. In the unit cell (Fig. 8c), molecules are arranged in a herringbone packing motif without dimer or aggregate formation. This may be due to steric effects of the out-of-plane azepane ring. Experimentally, L-H did not show dramatic ML. This observation likely results from the absence of face-to-face or offset dimers, which are commonly observed for ML-active bdk materials.21
 | ||
| Fig. 8 (a) Crystal structure of L-H shown in different perspectives. (b) Intermolecular interactions in L-H crystals. (c) Unit cell of L-H (hydrogens are deleted for clarity). | ||
Halochromic luminescence
Halochromism experiments were also conducted by exposing the ligand and dye as spun (AS) thin films to acid/base vapors, which were trifluoroacetic acid (TFA) and triethylamine (Et3N).20 The detailed procedure is presented in the ESI.† Emission spectra of as spun, acid annealed (AA) and base annealed (BA) films are shown in Fig. 9 and Fig. S21 (ESI†). For L-H (Fig. 9a), with successive TFA and Et3N vapor annealing, the emission color turned from green to blue and then back to green, and a large hypsochromic shift (114 nm) was observed upon TFA annealing. Once base vapor annealing was applied, almost identical emission maxima of the AS and BA films were attained, indicating a reversible color tuning process. For D-H (Fig. 9b), an even larger hypsochromic shift up to 209 nm was obtained, suggesting its potential application as a pH sensor. However, the BA film emission did not overlap with that of the AS film (Fig. 9b), suggesting it was not fully reversible for D-H. A possible mechanism of the acid/base vapor-responsive fluorescence switching was proposed in a previous study.20 As is shown in Fig. 9c, when acid/base vapor annealing was applied, protonation/deprotonation of the nitrogen atom led to FMO energy changes and emission wavelength shifts.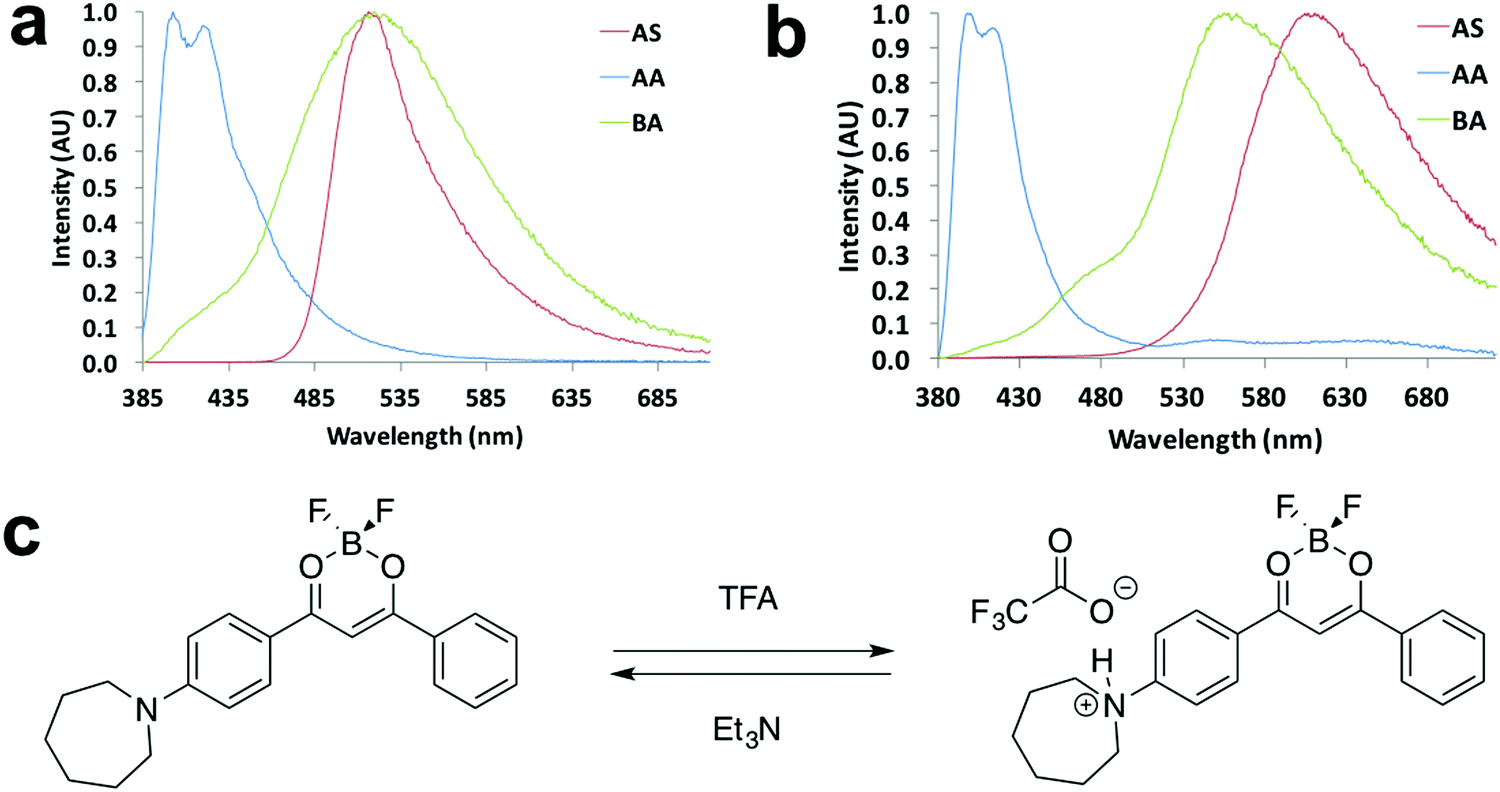 | ||
| Fig. 9 Halochromism experiments: normalized emission spectra of (a) L-H and (b) D-H in the indicated states (λex = 369 nm). (c) Representative drawing of halochromic mechanism proposed in a previous study.20 | ||
Conclusion
In summary, a series of azepane-substituted β-diketonates and their corresponding boron coordinated complexes were synthesized and studied. Methoxy and bromo substitutions were introduced to investigate internal electron donor and acceptor effects respectively. Methoxy substitution caused a notable enhancement in quantum yield, and the bromo-substituted ligand showed more dramatic mechanochromic luminescence. Compared to the β-diketone ligands, boron coordination resulted in a bathochromic shift in both absorption and emission, and the appearance of AIE. Although the boron complexes were not mechano-active, they still showed bright red emission in the solid state.All the azepane-substituted ligands and dyes exhibited solvatochromism in solution, where red-shifted emission was observed in more polar solvents. In addition, for viscochromism, two binary solvent systems were chosen, DMSO/acetonitrile for the ligands and dioxane/EtOAc for the boron complexes. All the synthesized compounds showed higher fluorescence intensity when viscosity increased. Due to their sensitivity to polarity and viscosity, the azepane-substituted β-diketonates and boronated complexes show potential as polarity and viscosity probes in biological systems. Moreover, the azepane substituent serves as an intramolecular rotating group, and restriction of intramolecular rotation gives rise to AIE.13 In THF/water mixtures, for the β-diketone ligands, the emission was quenched upon aggregation, which is typical ACQ. In contrast, the boron coordinated complexes showed enhanced emission when they aggregated, which is a typical AIE property. Furthermore, mechanochromic luminescence and halochromism properties in the solid state were investigated. The bromo-substituted ligand, L-Br, showed red-shifted emission when thin films were smeared. Powder XRD patterns of different states demonstrated a phase transition from crystalline to amorphous caused by smearing. For halochromism, reversible fluorescence switching with large emission wavelength shifts (blue to green/red) was achieved in all the bdk ligands and boron dyes using TFA/TEA vapor annealing, indicating potential application as pH sensors.
Acknowledgements
We thank the National Science Foundation (CHE 1213915) and National Institutes of Health (R01 CA167250) for support for this research. We thank Prof. Carl Trindle for his help with TD-DFT calculations and Tristan Butler for his advice and assistance.References
- L. D. Lavis and R. T. Raines, ACS Chem. Biol., 2008, 3, 142 CrossRef CAS PubMed.
- I. Johnson, Probes for Lipids and Membranes, The Molecular Probes Handbook, Life Technologies Corporation, 2010, pp. 547–589 Search PubMed.
- Z. R. Grabowski, K. Rotkiewicz and W. Rettig, Chem. Rev., 2003, 103, 3899 CrossRef PubMed.
- M. K. Kuimova, Phys. Chem. Chem. Phys., 2012, 14, 12671 RSC.
- A. S. Klymchenko, Acc. Chem. Res., 2017, 50, 366 CrossRef CAS PubMed.
- A. Marini, A. Munnoz-Losa, A. Biancardi and B. Mennucci, J. Phys. Chem. B, 2010, 114, 17128 CrossRef CAS PubMed.
- A. P. Demchenko, Y. Mély, G. Duportail and A. S. Klymchenko, Biophys. J., 2009, 96, 3461 CrossRef CAS PubMed.
- M. A. Haidekker and E. A. Theodorakis, Org. Biomol. Chem., 2007, 5, 1669 CAS.
- M. K. Kuimova, G. Yahioglu, J. A. Levitt and K. Suhling, J. Am. Chem. Soc., 2008, 130, 6672 CrossRef CAS PubMed.
- M. Shimizu and T. Hiyama, Chem. – Asian J., 2010, 5, 1516 CrossRef CAS PubMed.
- J. Luo, Z. Xie, J. W. Y. Lam, L. Cheng, B. Z. Tang, H. Chen, C. Qiu, H. S. Kwok, X. Zhan, Y. Liu and D. Zhu, Chem. Commun., 2001, 1740 RSC.
- Y. Hong, J. W. Y. Lam and B. Z. Tang, Chem. Soc. Rev., 2011, 40, 5361 RSC.
- H. Wang, E. Zhao, J. W. Y. Lam and B. Z. Tang, Mater. Today, 2015, 18, 365 CrossRef CAS.
- J. Mei, N. L. C. Leung, R. T. K. Kwok, J. W. Y. Lam and B. Z. Tang, Chem. Rev., 2015, 115, 11718 CrossRef CAS PubMed.
- R. T. K. Kwok, C. W. T. Leung, J. W. Y. Lam and B. Z. Tang, Chem. Soc. Rev., 2015, 44, 4228 RSC.
- C. W. T. Leung, Y. Hong, J. Hanske, E. Zhao, S. Chen, E. V. Pletneva and B. Z. Tang, Anal. Chem., 2014, 86, 1263 CrossRef CAS PubMed.
- C. Dou, L. Han, S. Zhao, H. Zhang and Y. Wang, J. Phys. Chem. Lett., 2011, 2, 666 CrossRef CAS.
- G. Zhang, J. Lu, M. Sabat and C. L. Fraser, J. Am. Chem. Soc., 2010, 132, 2160 CrossRef CAS PubMed.
- Y. Sagara and T. Kato, Nat. Chem., 2009, 1, 605 CrossRef CAS PubMed.
- R. Yoshii, A. Hirose, K. Tanaka and Y. Chujo, J. Am. Chem. Soc., 2014, 136, 18131 CrossRef CAS PubMed.
- X. Sun, X. Zhang, X. Li, S. Liu and G. Zhang, J. Mater. Chem., 2012, 22, 17332 RSC.
- J. B. Grimm, B. P. English, J. Chen, J. P. Slaughter, Z. Zhang, A. Revyakin, R. Patel, J. J. Macklin, D. Normanno, R. H. Singer, T. Lionnet and L. D. Lavis, Nat. Methods, 2015, 12, 244 CrossRef CAS PubMed.
- W. R. Legant, L. Shao, J. B. Grimm, T. A. Brown, D. E. Milkie, B. B. Avants, L. D. Lavis and E. Betzig, Nat. Methods, 2016, 13, 1 CrossRef PubMed.
- K. Tanaka and Y. Chujo, NPG Asia Mater., 2015, 7, 223 CrossRef.
- J. V. Frangioni, Curr. Opin. Chem. Biol., 2003, 7, 626 CrossRef CAS PubMed.
- G. S. He, L. S. Tan, Q. Zheng and P. N. Prasad, Chem. Rev., 2008, 108, 1245 CrossRef CAS PubMed.
- F. Helmchen and W. Denk, Nat. Methods, 2005, 2, 932 CrossRef CAS PubMed.
- R. W. Sinkeldam, N. J. Greco and Y. Tor, Chem. Rev., 2010, 110, 2579 CrossRef CAS PubMed.
- D. B. G. Williams and M. Lawton, J. Org. Chem., 2010, 75, 8351 CrossRef CAS PubMed.
- A. J. A. Watson and A. J. Fairbanks, Eur. J. Org. Chem., 2013, 6784 CrossRef CAS.
- C. A. Heller, R. A. Henry, B. A. McLaughlin and D. E. Bliss, J. Chem. Eng. Data, 1974, 19, 214 CrossRef CAS.
- W. H. Melhuish, J. Phys. Chem., 1961, 65, 229 CrossRef CAS.
- J. E. Saunders, C. Sanders, H. Chen and H.-P. Loock, Appl. Opt., 2016, 55, 947 CrossRef CAS PubMed.
- R. F. Kubin and A. N. Fletcher, J. Lumin., 1982, 27, 455 CrossRef.
- T. Liu, A. D. Chien, J. Lu, G. Zhang and C. L. Fraser, J. Mater. Chem., 2011, 21, 8401 RSC.
- W. A. Morris, T. Liu and C. L. Fraser, J. Mater. Chem. C, 2015, 3, 352 RSC.
- T. Butler, W. A. Morris, J. Samonina-Kosicka and C. L. Fraser, ACS Appl. Mater. Interfaces, 2016, 8, 1242 CAS.
- J. Hu, Z. He, Z. Wang, X. Li, J. You and G. Gao, Tetrahedron Lett., 2013, 54, 4167 CrossRef CAS.
- S. Xu, R. E. Evans, T. Liu, G. Zhang, J. N. Demas, C. O. Trindle and C. L. Fraser, Inorg. Chem., 2013, 52, 3597 CrossRef CAS PubMed.
- J. Zhao and Y. Yang, J. Mol. Liq., 2016, 220, 735 CrossRef CAS.
- J. A. Pople and M. Gordon, J. Am. Chem. Soc., 1967, 89, 4253 CrossRef CAS PubMed.
- R. Ghosh and D. K. Palit, Photochem. Photobiol. Sci., 2013, 12, 987 CAS.
- C. Cao, X. Liu, Q. Qiao, M. Zhao, W. Yin, D. Mao, H. Zhang and Z. Xu, Chem. Commun., 2014, 50, 15811 RSC.
- C. Grande, M. García and C. M. Marschoff, J. Chem. Eng. Data, 2008, 54, 652 CrossRef.
- T. C. Werner and D. B. Lyon, J. Phys. Chem., 1982, 86, 933 CrossRef CAS.
- C. Reichardt, Chem. Rev., 1994, 94, 2319 CrossRef CAS.
- G. Zhang, J. P. Singer, S. E. Kooi, R. E. Evans, E. L. Thomas and C. L. Fraser, J. Mater. Chem., 2011, 21, 8295 RSC.
- B. Xu, Z. Chi, X. Zhang, H. Li, C. Chen, S. Liu, Y. Zhang and J. Xu, Chem. Commun., 2011, 47, 11080 RSC.
- H. Ito, T. Saito, N. Oshima, N. Kitamura, S. Ishizaka, Y. Hinatsu, M. Wakeshima, M. Kato, K. Tsuge and M. Sawamura, J. Am. Chem. Soc., 2008, 130, 10044 CrossRef CAS PubMed.
- Y. Sagara, T. Mutai, I. Yoshikawa and K. Araki, J. Am. Chem. Soc., 2007, 129, 1520 CrossRef CAS PubMed.
Footnote |
| † Electronic supplementary information (ESI) available: Synthesis details and computational information. Additional absorption and emission spectra for all the compounds in CH2Cl2; solvatochromism, viscochromism, halochromism, AIE and ML images and spectra; Lippert–Mataga plots, DSC curves and XRD spectra. CCDC 1545451. For ESI and crystallographic data in CIF or other electronic format see DOI: 10.1039/c7qm00137a |
| This journal is © the Partner Organisations 2017 |