
Biocomposites from the reinforcement of a tung oil-based thermosetting resin with collagen†
Audrey
Scholz
,
Russell L.
Lewis
,
Michael A.
Bachan
,
Amanda L.
Stewart
and
Rafael L.
Quirino
 *
*
Chemistry Department, Georgia Southern University, USA. E-mail: rquirino@georgiasouthern.edu
First published on 2nd May 2017
Abstract
Collagen from three different sources has been added to a tung oil-based thermosetting resin in order to enhance its mechanical properties for possible applications in the biomedical field as materials directly derived from biological molecules. The thermosets prepared in this work are made using tung oil, divinylbenzene (DVB), n-butyl methacrylate (BMA), tert-butyl peroxide (TBPO), asolectin, and collagen types I and III. Composites containing up to 5.0 wt% of collagen have been successfully prepared and characterized by dielectric analysis (DEA), thermogravimetric analysis (TGA), and differential scanning calorimetry (DSC). The structure of the collagen samples used in this work was investigated through circular dichroism (CD) spectroscopy. Dynamic mechanical analysis (DMA) was used to assess composites' mechanical properties and revealed an improvement in the storage modulus at room temperature with increasing amounts of collagen, reaching an impressive increase of ∼100% for composites containing 5.0 wt% of collagen extracted from beef tendons in comparison to the unreinforced resin. The results indicate that collagen exhibits a reinforcing behavior similar to that obtained with nanostructured materials, such as carbon nanotubes for instance, therefore working as an effective reinforcement for the preparation of biocomposites.
Introduction
In the past decade, the synthesis of bio-based resins with good thermal stability and tunable mechanical properties over a broad spectrum has gained considerable attention. Previous works include the reinforcement of vegetable oil-derived cyanate esters,1 polyester amides,2 polyolefins,3–5 and polyurethanes6,7 with inorganic materials. In that context, varnishes, films, coatings, and resins have been prepared using plant oils,8–13 leading to low-cost, environmentally-friendly materials from renewable resources.14,15 Among the many different vegetable oils investigated to date, tung oil is of particular interest for the preparation of polymeric resins due to its highly unsaturated and naturally conjugated triene system.8,16,17 Indeed, tung oil can be easily crosslinked with other reactive olefins via cationic, thermal, or free radical polymerization, without the need of previous modification of the triglyceride structure.8,9,18–20 Additionally, tung oil resin's mechanical properties have been proven to be superior than those of other resins made from similar plant oils, with faster cure times.21In most of the aforementioned examples, however, there is an inherent incompatibility between the hydrophobic resin and a hydrophilic reinforcement, which prevents maximization of the reinforcing effect imparted by the reinforcing materials used. Asolectin, a mixture of phospholipids naturally formed and obtained from soybeans, has been successfully used as a bio-based reactive surfactant in the emulsion polymerization of tung oil,22 and as a bio-based compatibilizer in tung oil-based/cellulose composites.13 Asolectin contains both saturated and unsaturated phospholipids,23 which allow it to react with hydrophobic olefins, such as tung oil, and interact with hydrophilic groups, such as those present in collagen. Collagen is a fibrous and linear, triple helical protein24,25 that can be found in the majority of organic tissues, such as skin, tendons, and bones.25,26 It has been used in the medical field for tissue engineering,25 but so far, its use in the synthesis of bio-based composites has been scarcely reported, mainly as a reinforcement for castor oil-containing polyurethanes.27 It is believed that collagen's polar segments are stronger or more prevalent than its hydrophobic segments, making the addition of a compatibilizer necessary in order to maximize its reinforcing effect in a tung oil resin.
In this study, a collagen-reinforced biocomposite from tung oil was prepared using free radical initiation and thermal polymerization, leading to a polyolefinic tung oil-based matrix with properties and structure very different from those of the castor oil-containing polyurethanes reported in the literature,27 with a completely different chemistry involved, hence the relevance of this work in the arena of vegetable oil-based materials. The structure of collagen extracted from beef tendon was compared against purified type I collagen and a commercial mixture of types I and III collagen by circular dichroism (CD) spectroscopy. Cure time was determined through dielectric analysis (DEA). The thermal and mechanical properties of the composites were assessed by means of thermogravimetric analysis (TGA), differential scanning calorimetry (DSC), and dynamic mechanical analysis (DMA), showing impressive improvement in storage modulus upon addition of collagen. The primary goal of the work presented is to establish and study a bio-based composite system that shows promise for use in the biomedical field as an implant material. A full mechanical characterization of the tung oil/collagen composites prepared is beyond the originally intended scope of this manuscript. The discussion revolves around a description of this new composite system by providing its thermo-mechanical properties, including traditional characterization methods, such as dynamic mechanical analysis, TGA, and DSC.
Experimental
Materials
n-Butyl methacrylate (BMA), tung oil, asolectin, di-tert-butyl peroxide (TBPO), and type I collagen were purchased from Sigma-Aldrich (St. Louis, MO). Divinylbenzene (DVB) was procured from TCI America (Portland, OR), and the types I + III collagen mixture was obtained from NeoCell (Santa Ana, CA). Sodium dihydrogen phosphate (NaH2PO4), sodium hydrogen phosphate (Na2HPO4), ethylenediaminetetraacetic acid (EDTA), acetic acid, sodium chloride (NaCl), and pepsin were purchased from Fisher (Hampton, NJ). Dialysis membrane tubing was bought from Spectrum Laboratories, Inc. (Rancho Dominguez, CA) and was allowed to equilibrate in deionized water overnight before use. Bovine tendons were donated by Hunter Cattle Co. (Brooklet, GA).Extraction of collagen from beef tendons
Collagen extraction from beef tendons was adapted from a standard collagen purification protocol.28 Approximately 20 lbs of frozen bovine tendons were cut into ∼1.5 cm cubes and stored in a water bath at approximately 4 °C for three hours. The tendons were then blended with a mixer and dried under ambient conditions overnight (leading to 3.49 kg of dry mass) before being placed in 5.0 L of 0.05 M NaH2PO4 buffer solution and stirred at 4 °C for 24 hours. The container with the tendons was then decanted, the supernatant was removed, and 5.0 L of fresh 0.05 M Na2HPO4 buffer was added. The mixture was then stirred at 4 °C for 24 hours. This last step was repeated one more time, and after 24 hours the decanted sample was added to 8.0 L of a 0.5 M solution of acetic acid containing 5.0 mM EDTA. 0.8726 g of pepsin was added and the mixture was kept under stirring at 4 °C. After 12 hours, another addition of 0.8726 g of pepsin was performed and the mixture was once again stirred for another 12 hours at 4 °C. After decanting and removing the supernatant, the process was repeated twice. After final decantation, the supernatant rich in collagen was placed in centrifuge tubes and centrifuged at 4500 rpm for 15 min at 20 °C. Collagen was salted-out from the supernatants collected after centrifugation with 4.0 M NaCl over the period of 24 hours at 4 °C. The salted-out collagen was isolated and dissolved in 2.0 L of 1.0 M acetic acid solution, followed by centrifugation. The centrifuge tube was drained and the collagen precipitate was then washed into dialysis tubings with 0.02 M Na2HPO4 buffer solution at a pH of 7.4. The dialysis tubings were immersed in a 0.02 M Na2HPO4 solution and kept at 4 °C for 48 hours. The final contents of the dialysis tubings was placed in falcon tubes, frozen with liquid nitrogen, and then lyophilized. It is worth noting that the collagen extracted from beef tendons with the aforementioned protocol are primarily of type I.Synthesis of collagen-reinforced/tung oil polymer
Designated amounts of tung oil, BMA, DVB, and asolectin were added to a 20 mL scintillation vial resulting in 10.0 g of crude resin. After capping the vial, the mixture was manually agitated until all components were completely mixed. Appropriate amounts of collagen were added to the vial and manually agitated until an apparent homogeneous mixture was obtained. Lastly, 0.5 g of TBPO were added to the vial and the contents were again manually agitated. The 20 mL vial was placed in a convection oven and heated at 100–140 °C over a period of up to 24 hours, as described in the text.Characterization
Approximately 2.0 g of selected samples underwent Soxhlet extraction for 24 hours with dichloromethane. The solvent was removed from the extracts using a rotary evaporator. Soluble and insoluble materials were dried in a vacuum oven at 70 °C overnight for quantification of overall monomer conversion.DEA was run using an Epsilon DEA 230/1 cure monitor (Netzsch Instruments North America LLC, Burlington, MA) with frequencies ranging from 0.3 Hz to 10000.0 Hz to show the resin's cure behavior in the presence of collagen. A flexible probe was submersed in the resin for the duration of the cure schedule. The sample was heated in a convection oven for a total of 24 hours at temperatures ranging from 100 °C to 140 °C. The permittivity and loss factor of the composite were measured as a function of time. The results presented in the text correspond to a plot of ion viscosity (Ohm cm) versus time. The sample size was approximately 10 g.
Raman spectra and optical microscopy images were acquired with a DXR Raman Microscope (Thermo Fisher Scientific, Waltham, MA, USA) equipped with a digital camera. A total of 32 scans were collected per sample at an exposure time of 1 s for each scan. Laser power was set to 7.0 mW, and a 50 μm slit aperture was used.
FTIR spectra were collected using a Thermo Nicolet Avatar 370-FTIR spectrometer (Thermo Scientific, Waltham, MA) with an attenuated total reflectance (ATR) accessory. The spectra were obtained in the 400–4000 cm−1 spectral region, with 64 scans, and 4 cm−1 resolution.
Thermal stability was assessed using a Q50 TGA instrument (TA Instruments, New Castle, DE). Samples were heated from room temperature to 600 °C at a rate of 20 °C min−1 while the weight of the sample was measured under an air atmosphere as a function of time. All TGA experiments were carried out in triplicate to ensure consistency of the results reported. A Q20 DSC instrument (TA Instruments, New Castle, DE) was used under a N2 atmosphere with samples of approximately 10 mg being heated from −20 °C to 200 °C at a rate of 10 °C min−1.
The presence of collagen in the beef tendon extracts was confirmed through CD spectroscopy using a Jasco J-815 CD Spectrometer with an auto peltier 6 cell changer operated under nitrogen gas. All samples were prepared in 0.1 M acetic acid in 0.02 M Na2HPO4. The samples were kept at a constant temperature of 5 °C throughout the experiment. All collagen samples were also evaluated with respect to their fraction folded as the temperature increased from 0 °C to 100 °C to show denaturation patterns. These experiments were duplicated showing a maximum deviation of 1 °C between any two measurements for the same type of collagen investigated.
DMA experiments were performed on a Q800 instrument (TA Instruments, New Castle, DE) under tension mode. A multi-frequency strain method was used with an amplitude of 14.0 μm and a frequency of 1 Hz. The composite samples were cut into specimens of 10.00 mm × 4.00 mm × 2.20 mm (length, width, thickness) to examine their dynamic mechanical behavior between −60 °C and 150 °C. Storage modulus (MPa) and tan delta were measured as a function of temperature (°C) under a heating rate of 3 °C min−1. The DMA data reported corresponds to the average of 3–7 measurements per sample and includes the corresponding standard deviation.
SEM images were obtained in a JSM-760F Field Emission Scanning Electron Microscope (JEOL, Peabody, MA), using an accelerating voltage of 1.0 kV, lower detector scanning mode (LEI), and an emission current of approximately 81 μA.
Results and discussion
Initial composition and cure optimization
Based on previous work with tung oil-based composites,22 an initial resin composition containing 50 wt% of tung oil, 35 wt% of BMA, and 15 wt% of DVB was cured with 10–75 wt% of the commercial mixture of collagen I + III at 140 °C for 15 hours. In those preliminary trials, poor mixing of polymer matrix and collagen resulted in phase separation and a porous layer was observed above a tung oil-based polymer layer. Due to its long fatty acid chains and relative lower reactivity in comparison to DVB and BMA, tung oil can't be used in concentrations higher than 50 wt%. Preliminary tests are summarized on Table S1 (ESI†). In order to improve miscibility of collagen and the resin, 10 wt% of asolectin was added in detriment of tung oil. In order to compensate for the lower reactivity of asolectin, an additional 5 wt% of DVB was added to the resin composition in detriment of BMA, resulting in a resin composed of 40 wt% of tung oil, 30 wt% of BMA, 20 wt% of DVB, and 10 wt% of asolectin. The overall bio-based content in the resin corresponds to 50 wt% (40 wt% tung oil + 10 wt% asolectin). This resin was used for the preparation of composites containing 0–10 wt% collagen (Table S1 (ESI†), entry 2). Despite the absence of the porous layer upon cure, the resulting composites exhibited imperfections, such as bubbles and cracks, indicating a need of adjustment of the cure schedule employed.In order to avoid formation of bubbles and cracks in the composites upon cure, two new cure schedules were attempted, as described in Table 1. On cure schedule II, the introduction of an additional step at 120 °C for 4 hours and 30 minutes was meant to slow the polymerization rate and limit crack and bubble formation, as previously observed in similar systems.22 For practical reasons, it was desirable that the overall cure process lasted for no longer than 8 hours. The times at 120 °C and 140 °C were arbitrarily broken down into 4 h 30 min and 3 h 30 min, respectively, to allow for a longer time for the first step. Implementation of cure schedule II failed to produce good composites at 5 wt% and 10 wt% collagen loadings due to extensive bubble formation. A third cure sequence consisting of a 24 hour, multi-step temperature profile (cure schedule III, Table 1) was then implemented, producing composites with no imperfections at 0 wt%, 0.5 wt%, 1 wt%, 2 wt%, and 5 wt% collagen loadings. Because the radical formation rate for di-t-butyl peroxide peaks at 110–140 °C, it was decided that the times of those steps should be maximized and evenly spaced, while the initial step at 100 °C (when the polymerization process isn't occurring at an appreciable rate) and at 140 °C (when most of the polymerization has already completed) received lower times. Cure schedule III was employed in all following samples described in this manuscript.
| Cure schedule | 100 °C | 110 °C | 120 °C | 130 °C | 140 °C |
|---|---|---|---|---|---|
| I | — | — | — | — | 15 h |
| II | — | — | 4 h 30 min | — | 3 h 30 min |
| III | 2 h | 6 h | 6 h | 6 h | 4 h |
The polymer obtained by the bulk free radical co-polymerization of tung oil, BMA, DVB, and asolectin is a crosslinked thermoset and therefore doesn't exhibit a defined molecular weight as typical thermoplastics. Maldi-Tof has been previously employed to show evidence of the free radical polymerization reaction of a partially cured binary mixture of tung oil and asolectin heated under emulsion polymerization conditions.22 In this work, however, the bulk polymerization of the system leads to high crosslink densities, making the products insoluble. Several unsuccessful attempts have been made to date to obtain Maldi-Tof evidence for the bulk free radical polymerization reaction of the resin investigated in this work. In an effort to estimate the extent of monomer conversion, Soxhlet extraction experiments have been performed on the final cured resin and in composites prepared with 5.0 wt% of collagen I + III mixture and collagen from beef tendons. The results revealed that only 5.2 wt% of extractables were recovered after the polymerization of the resin, indicating an overall 96.8% monomer conversion. When the polymerization was carried out in the presence of 5.0 wt% of collagen, a higher amount of extractables was recovered (8.1 wt% for collagen from beef tendons and 9.1 wt% for type I + III collagen). These results confirm significant polymerization of the initial monomer mixture, with monomer conversions consistently higher than 90% for all samples reported in this manuscript.
The cure of a composite containing 1.0 wt% of collagen under schedule III was monitored through DEA (Fig. 1) in order to track the polymerization of the resin in the presence of collagen. The DEA results presented in Fig. 1 match the expected behavior for the cure of thermosetting resins. Indeed, the initial drop in ion viscosity (0–1 h, Fig. 1) corresponds to initial heating of the resin before the free radical initiator (TBPO) is significantly cleaved to trigger polymerization at an appreciable rate. In that stage, the increase in temperature from room temperature to 100 °C imparts greater mobility of all molecules in the system, resulting in a greater permittivity, which translates into lower ion viscosity.
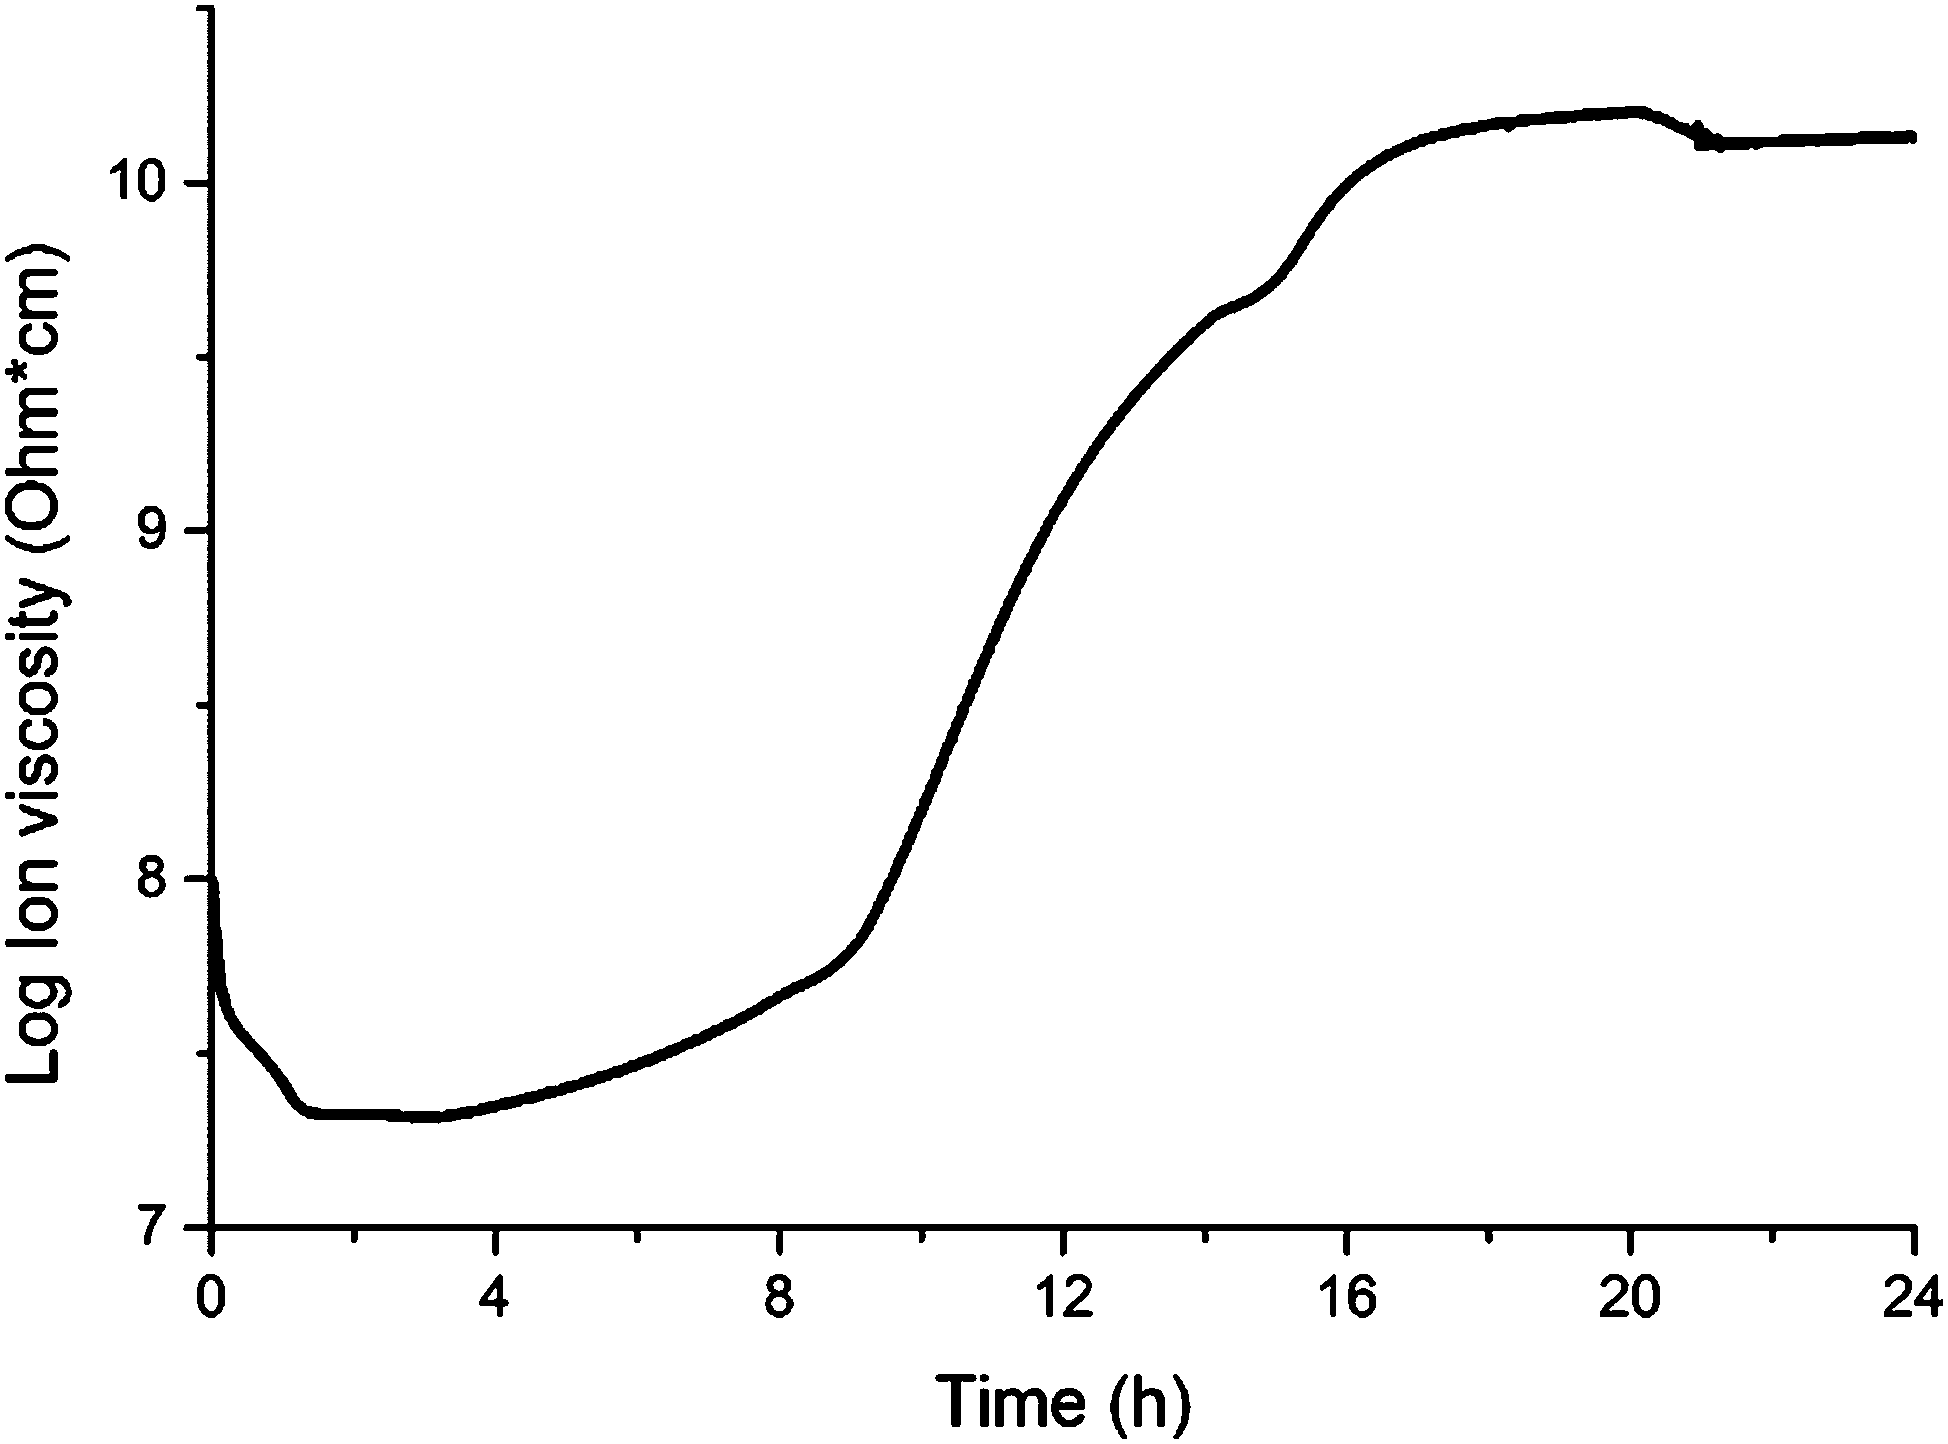 | ||
| Fig. 1 Dielectric analysis results for the cure of a composite containing 1.0 wt% of collagen I + III mixture following cure schedule III. | ||
After approximately 3 h (Fig. 1), the temperature reaches 110 °C (Table 1), and the resin experiences significant polymerization. As polymerization progresses, increases in polymer chain length and crosslink density result in lower chain mobility, resulting in a continuous increase of ion viscosity until approximately 20 h (Fig. 1). The change in polymerization rate upon each temperature change in that stage, according to cure schedule III (Table 1), can be appreciated by clear changes in the slope of the ion viscosity curve in Fig. 1 (∼8 h, 14 h, 20 h). After 20 h, when the temperature reaches 140 °C, the resin attains cure completion and, after a slight drop in ion viscosity (20–21 h, Fig. 1), no further changes are observed, indicating completion of the cure process after 21 h. The completion of the cure process can also be verified by Raman and FTIR spectroscopies (Fig. 2 and 3, respectively).
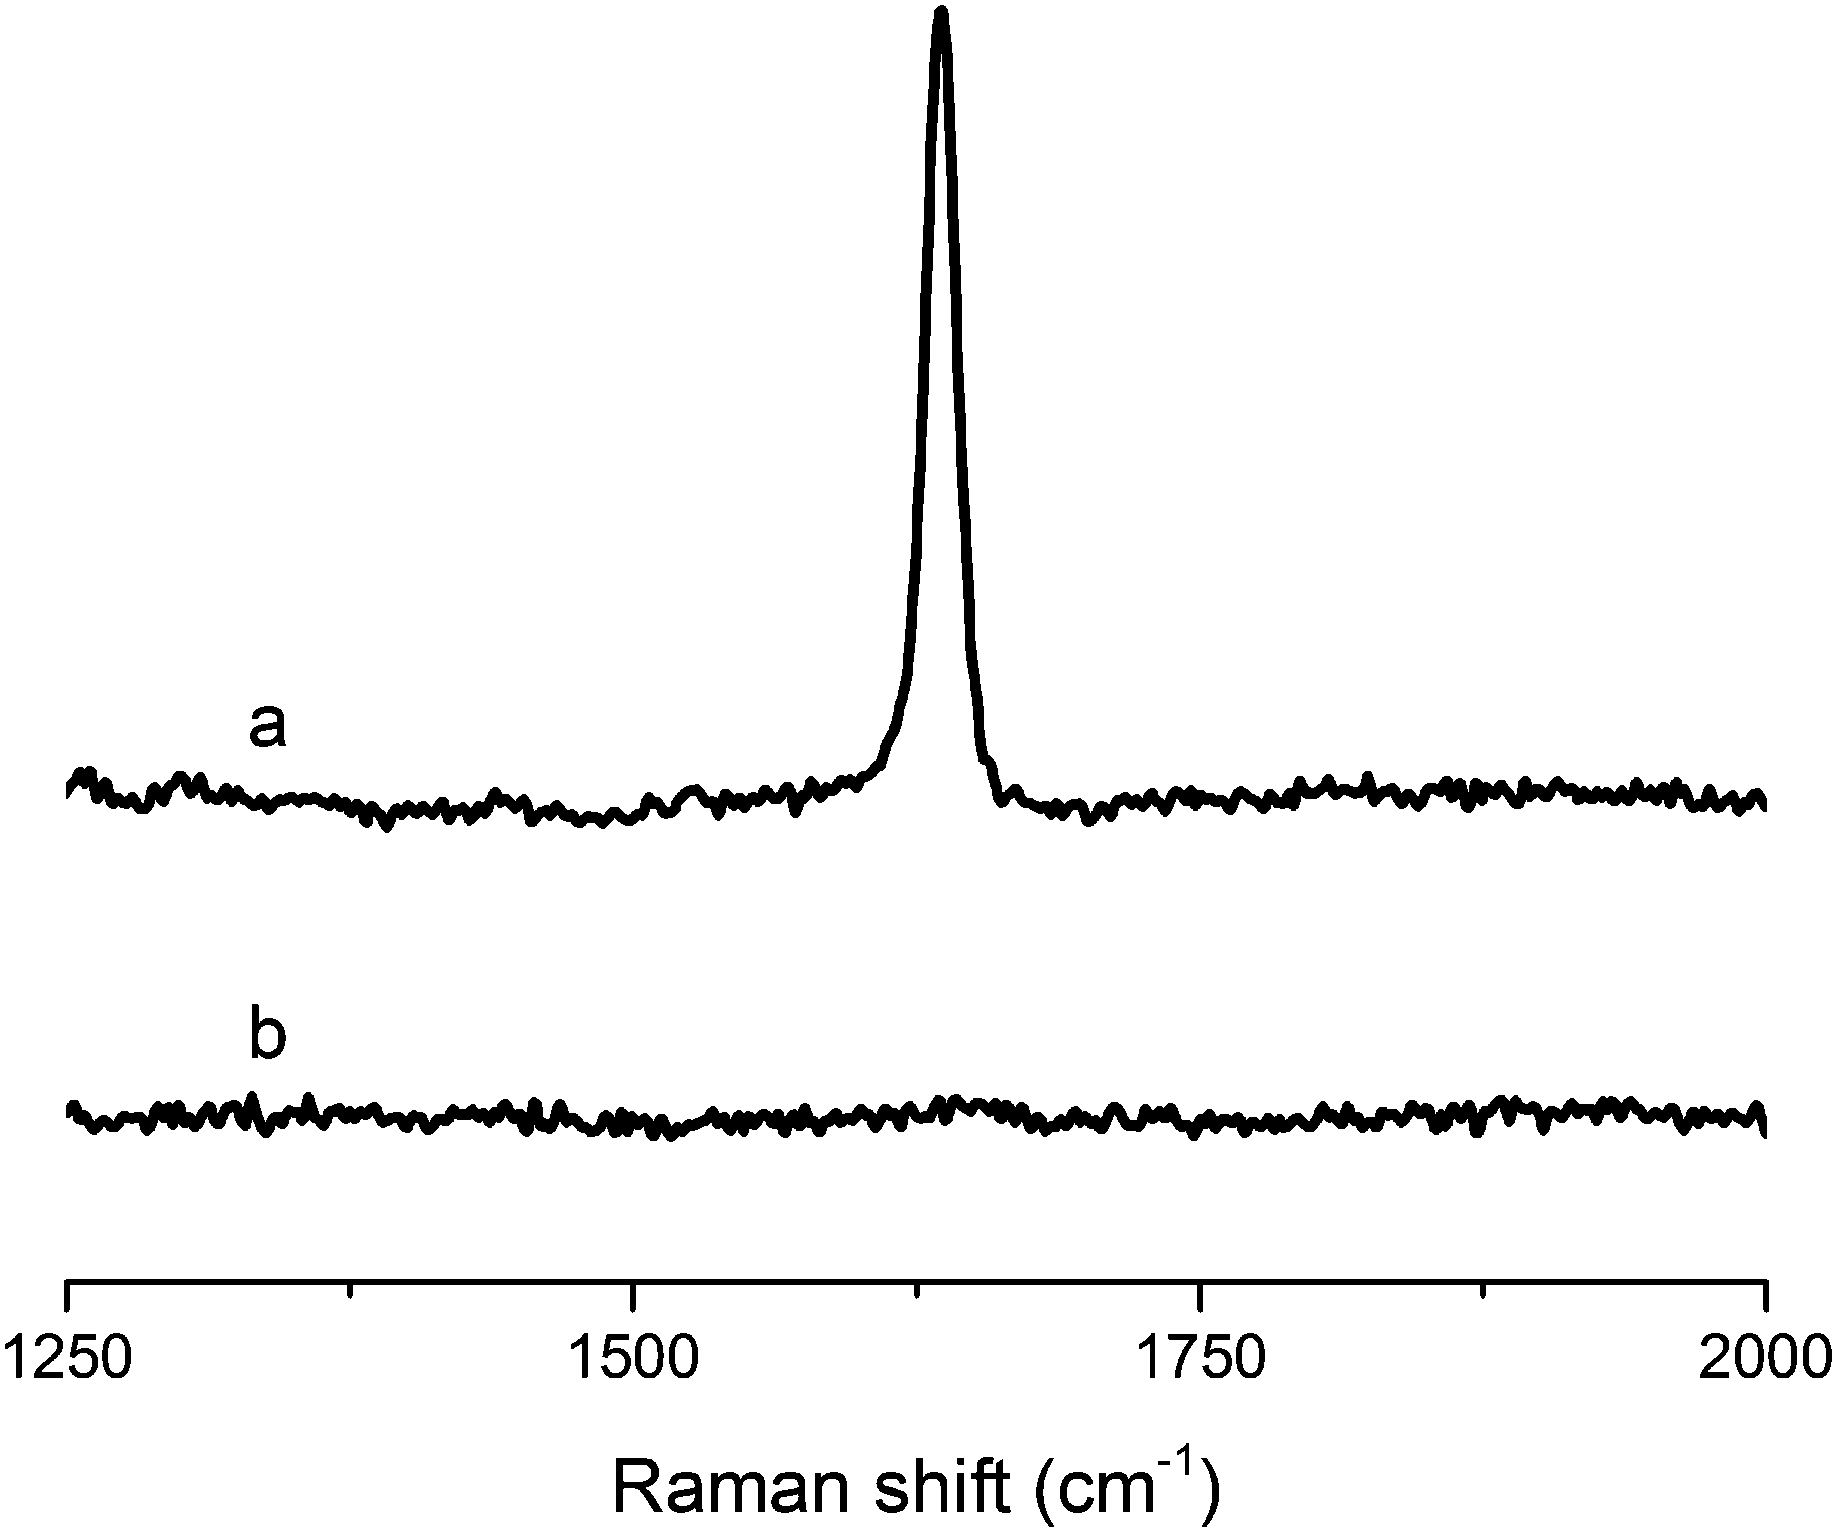 | ||
| Fig. 2 Raman spectra of (a) tung oil and (b) resin containing 40 wt% of tung oil, 30 wt% of BMA, 20 wt% of DVB, and 10 wt% of asolectin, subjected to cure schedule III. | ||
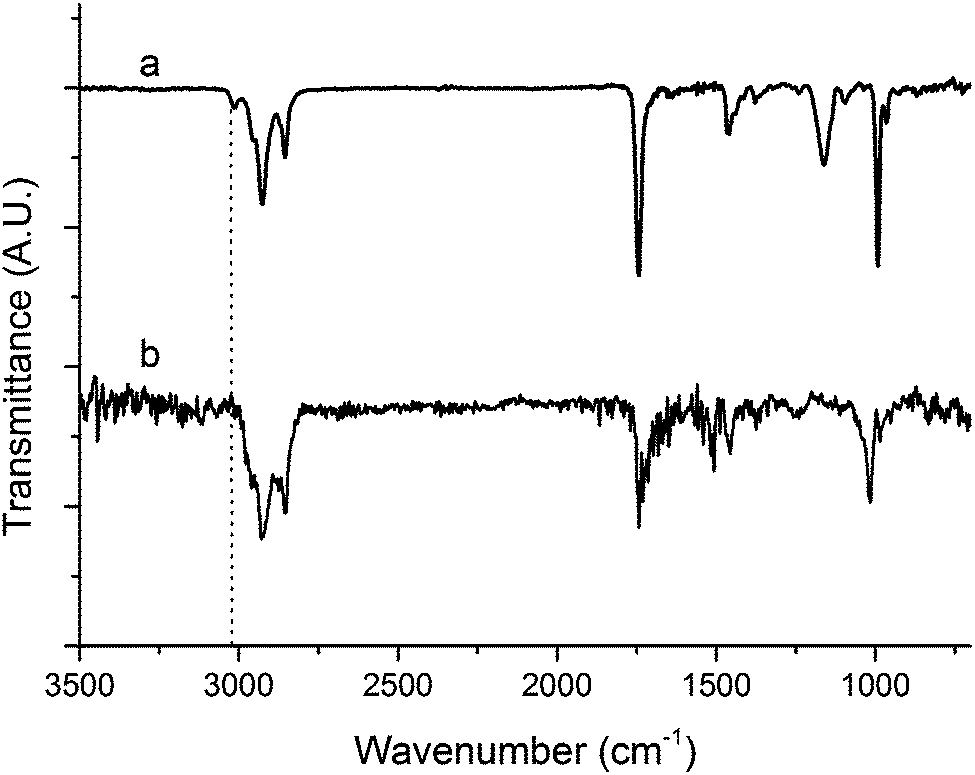 | ||
| Fig. 3 FTIR spectra of (a) tung oil and (b) resin containing 40 wt% of tung oil, 30 wt% of BMA, 20 wt% of DVB, and 10 wt% of asolectin, subjected to cure schedule III. The dotted line is a guide to the eye emphasizing the peak corresponding to C–H vibrations of sp2 hybridized carbons. | ||
On Fig. 2, a comparison of the Raman spectrum of tung oil (Fig. 2a) with that of the optimized resin subjected to cure schedule III (Fig. 2b) clearly shows that after the cure, the peak corresponding to C![[double bond, length as m-dash]](https://www.rsc.org/images/entities/char_e001.gif) C vibrations at approximately 1650 cm−1 can't be detected, suggesting that the vast majority of the carbon–carbon double bonds in the system react fully during the cure process. A similar situation is observed when comparing the FTIR spectrum of tung oil and that of the optimized resin subjected to cure schedule III (Fig. 3). Indeed after cure, the fully polymerized resin doesn't exhibit the characteristic peak of C(sp2)–H vibrations at 3011 cm−1. All other major peaks in tung oil are also present in the resin, as can be clearly seen in Fig. 3.
C vibrations at approximately 1650 cm−1 can't be detected, suggesting that the vast majority of the carbon–carbon double bonds in the system react fully during the cure process. A similar situation is observed when comparing the FTIR spectrum of tung oil and that of the optimized resin subjected to cure schedule III (Fig. 3). Indeed after cure, the fully polymerized resin doesn't exhibit the characteristic peak of C(sp2)–H vibrations at 3011 cm−1. All other major peaks in tung oil are also present in the resin, as can be clearly seen in Fig. 3.
The evolution of bubbles during the cure of collagen composites can be associated to the presence of about 10 wt% of water in the collagen I + III mixture, confirmed through TGA (Fig. S1, ESI†). Despite drying the collagen I + III mixture prior to its incorporation in composites, its ability to quickly adsorb moisture present in the air significantly limits the possibility of preparing composites with collagen loadings higher than 10 wt% in a practical manner.
Thermal properties of composites
TGA was also used in order to compare the thermal stability of the unreinforced tung oil-based resin and the collagen I + III mixture with that of a composite prepared with 5 wt% collagen loading. As shown in Fig. 4A, the unreinforced resin begins degrading at approximately 300 °C and the maximum degradation rates occurred at approximately 400 °C and 430 °C, as revealed by the corresponding derivative of the TGA curve (DTG). As observed in Fig. S1 (ESI†), the main degradation of collagen I + III mixture following the initial loss of water at 100 °C starts at approximately 250 °C, with a single maximum degradation rate step at 340 °C. When 5.0 wt% collagen I + III mixture is incorporated in a composite (Fig. 4B), no signs of water desorption are visible through TGA/DTG. Indeed, at that stage, most of the water present on collagen has been desorbed during the initial curing of the composite. As observed in Fig. 4B, the composite exhibits one major degradation step starting at approximately 350 °C with a temperature of maximum degradation of ∼480 °C. When compared to the thermal degradation profile of the unreinforced resin (Fig. 4A) and the collagen I + III mixture (Fig. S1, ESI†), it becomes clear that the composite exhibits higher thermal stability than both isolated materials, with higher temperatures for the onset of the main degradation step and maximum degradation rate. The greater thermal stability of the composite, when compared to the individual components, suggests strong interactions between resin and reinforcement, confirmed by the DMA data presented later in the text.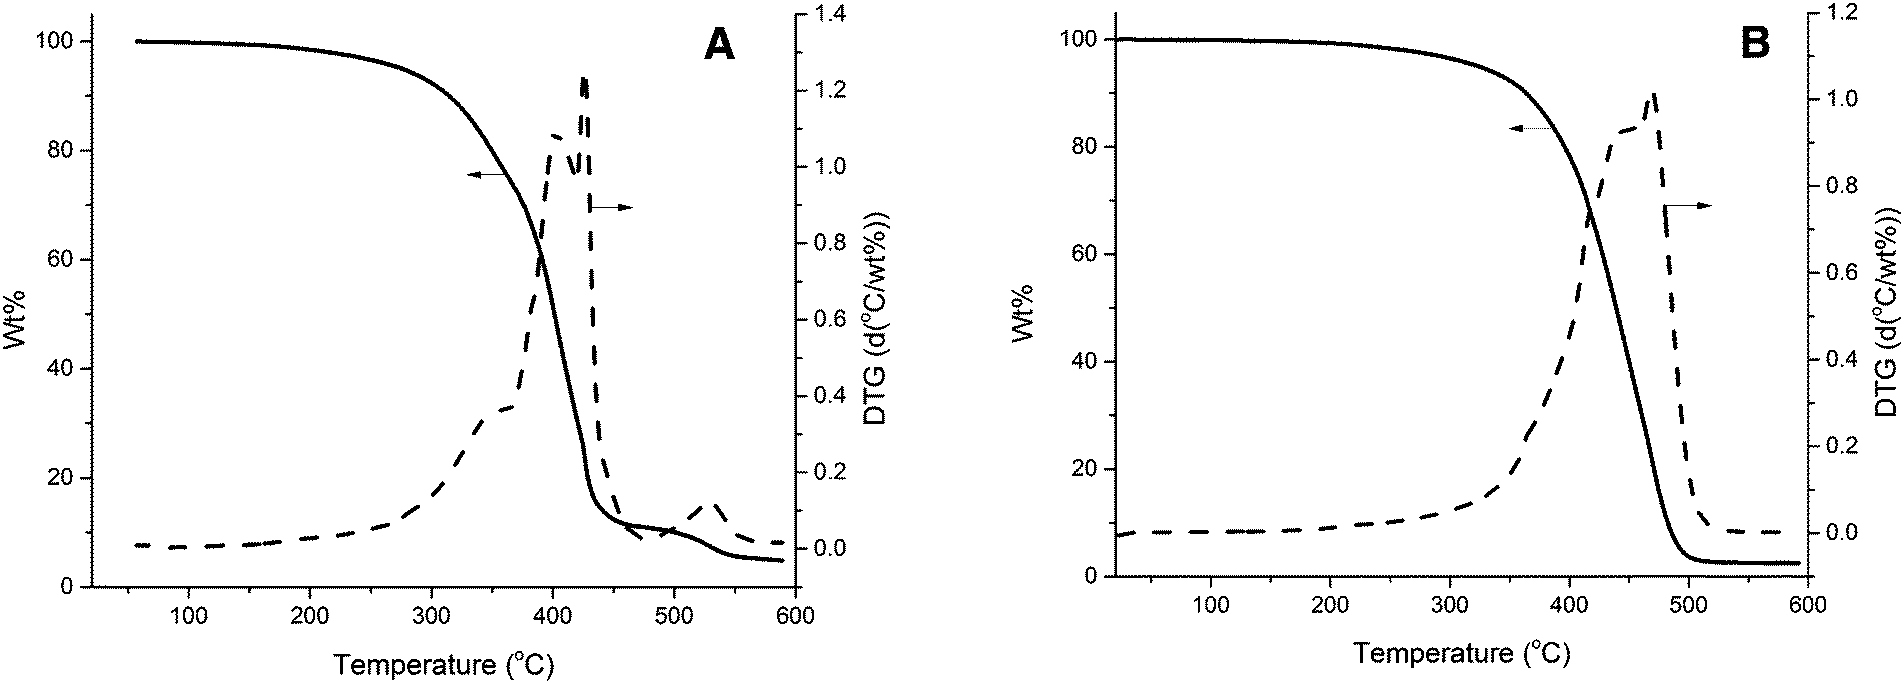 | ||
| Fig. 4 (A) TGA and DTG curves for the unreinforced resin cured under cure schedule III, and (B) TGA and DTG curves for a composite prepared with 5.0 wt% of the collagen I + III mixture. Resin composition is 40 wt% of tung oil, 30 wt% of BMA, 20 wt% of DVB, and 10 wt% of asolectin. | ||
Upon a comparison of the thermal degradation profiles of composites reinforced with different loadings of collagen (Fig. 5), an overall trend of increase in thermal stability can be seen for increasing collagen load. The initial degradation of the unreinforced resin and the composite reinforced with 1.0 wt% collagen I + III mixture coincide until approximately 320 °C. After that temperature, the unreinforced resin exhibits a significantly faster degradation rate. The composite reinforced with 5.0 wt% of collagen I + III mixture exhibits a markedly higher stability than the other two samples in Fig. 5, with an onset degradation temperature of ∼350 °C. This trend confirms that the interaction between collagen and resin results in an increased thermal stability of the composite when compared to the individual components.
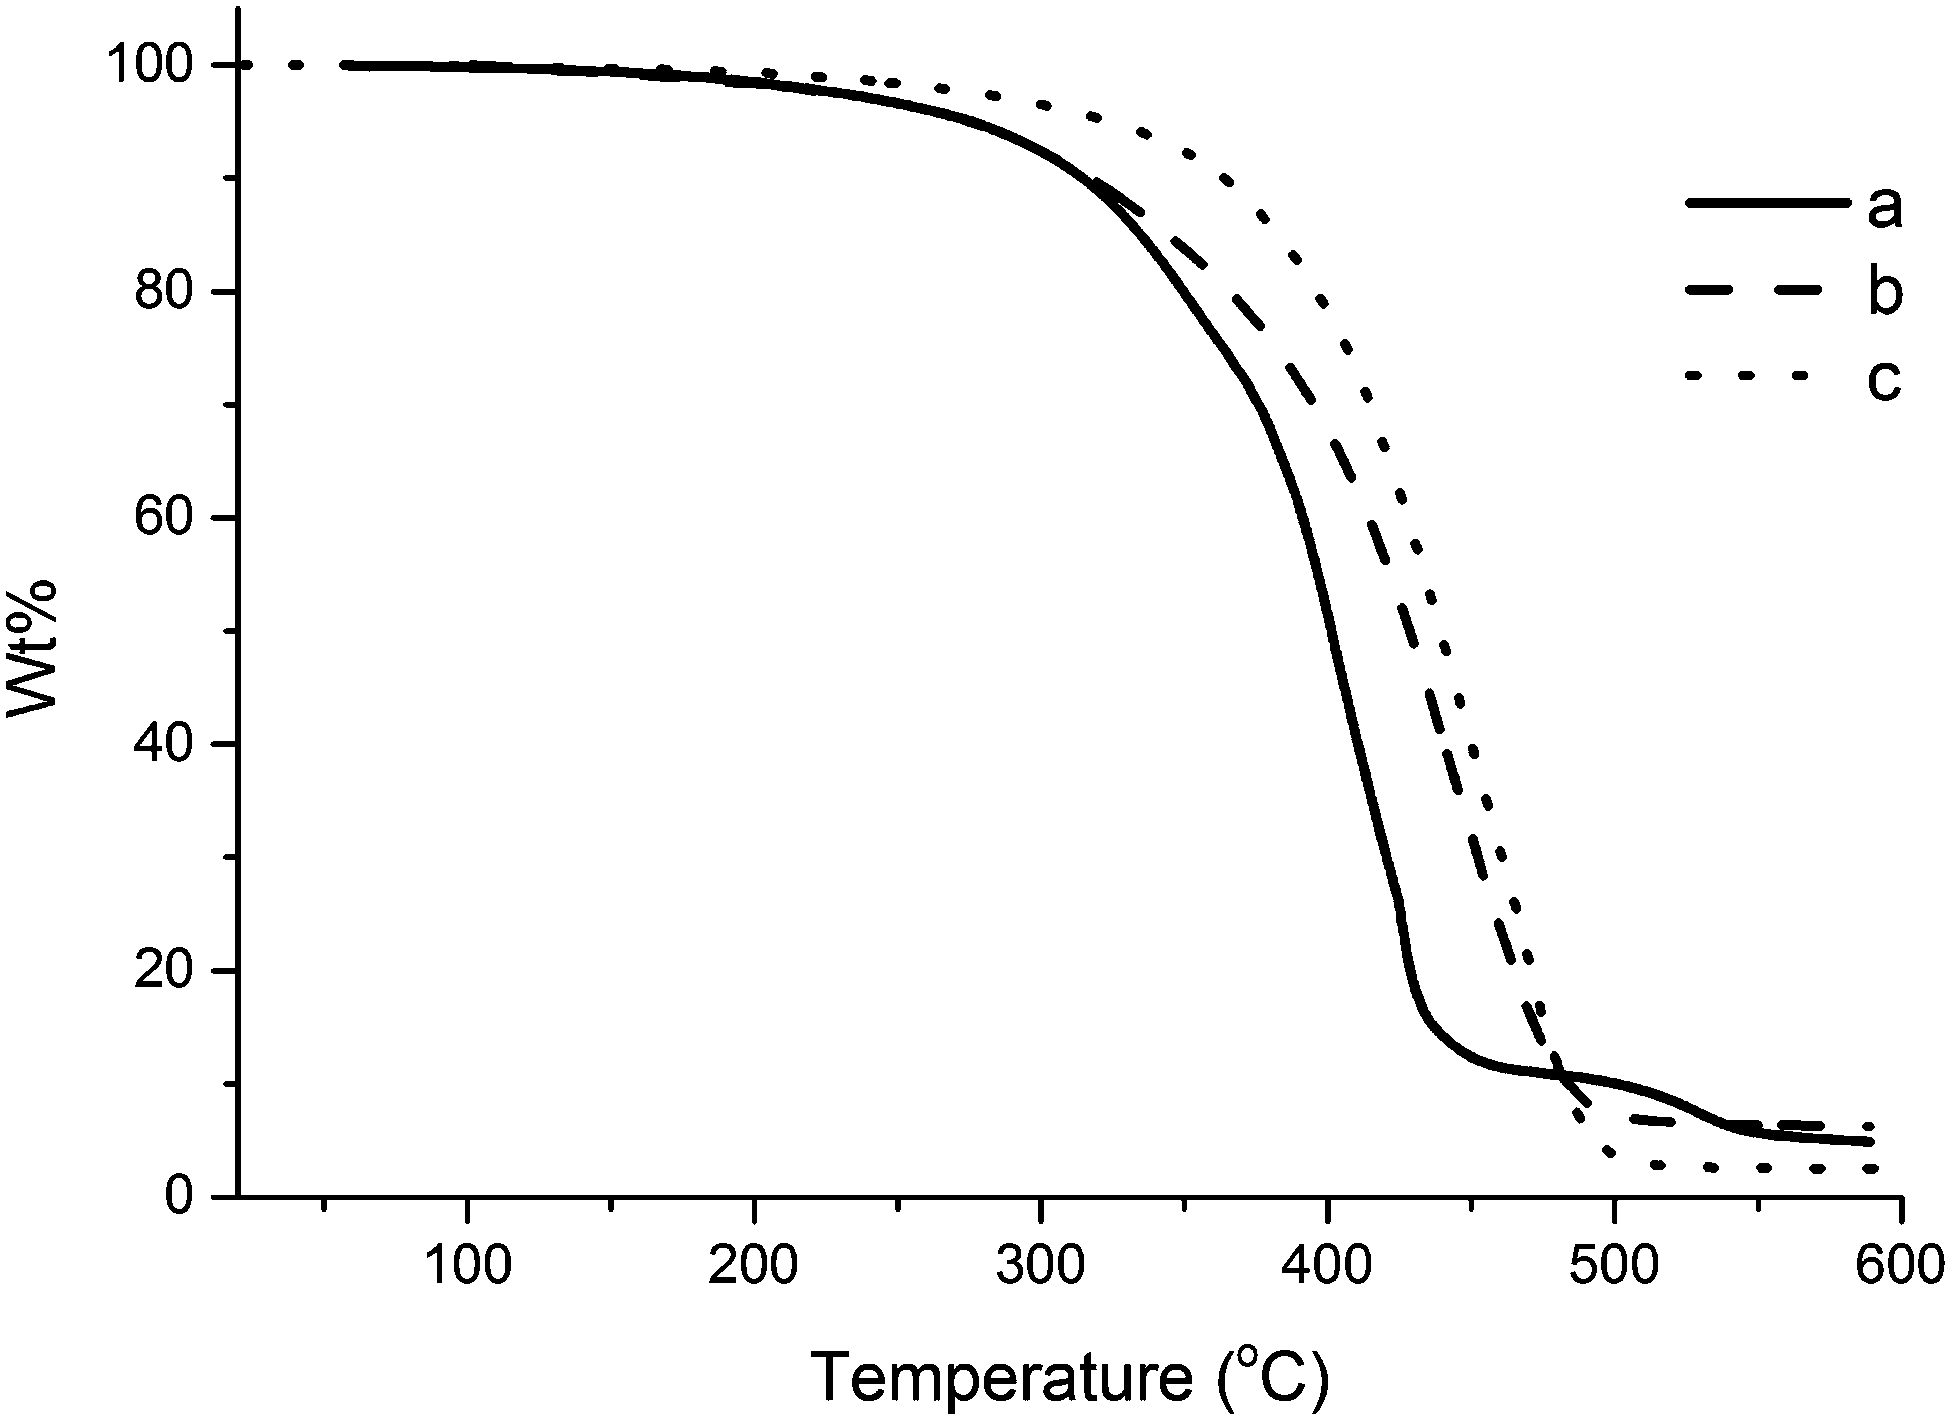 | ||
| Fig. 5 TGA curve for composites containing (a) 0.0 wt%, (b) 1.0 wt%, and (c) 5.0 wt% of collagen I + III mixture. | ||
When comparing the DSC curves of the unreinforced tung oil-based resin, the collagen I + III mixture, and a composite containing 5 wt% collagen I + III mixture (Fig. 6), no visible peaks are detected for the resin and for the composite (Fig. 6b and c), indicating cure completion for both materials when subjected to cure schedule III. The DSC curve of the collagen I + III mixture reveals a broad peak centered at 110 °C and compatible with loss of water from the collagen mixture sample (Fig. S1, ESI† and Fig. 6a).
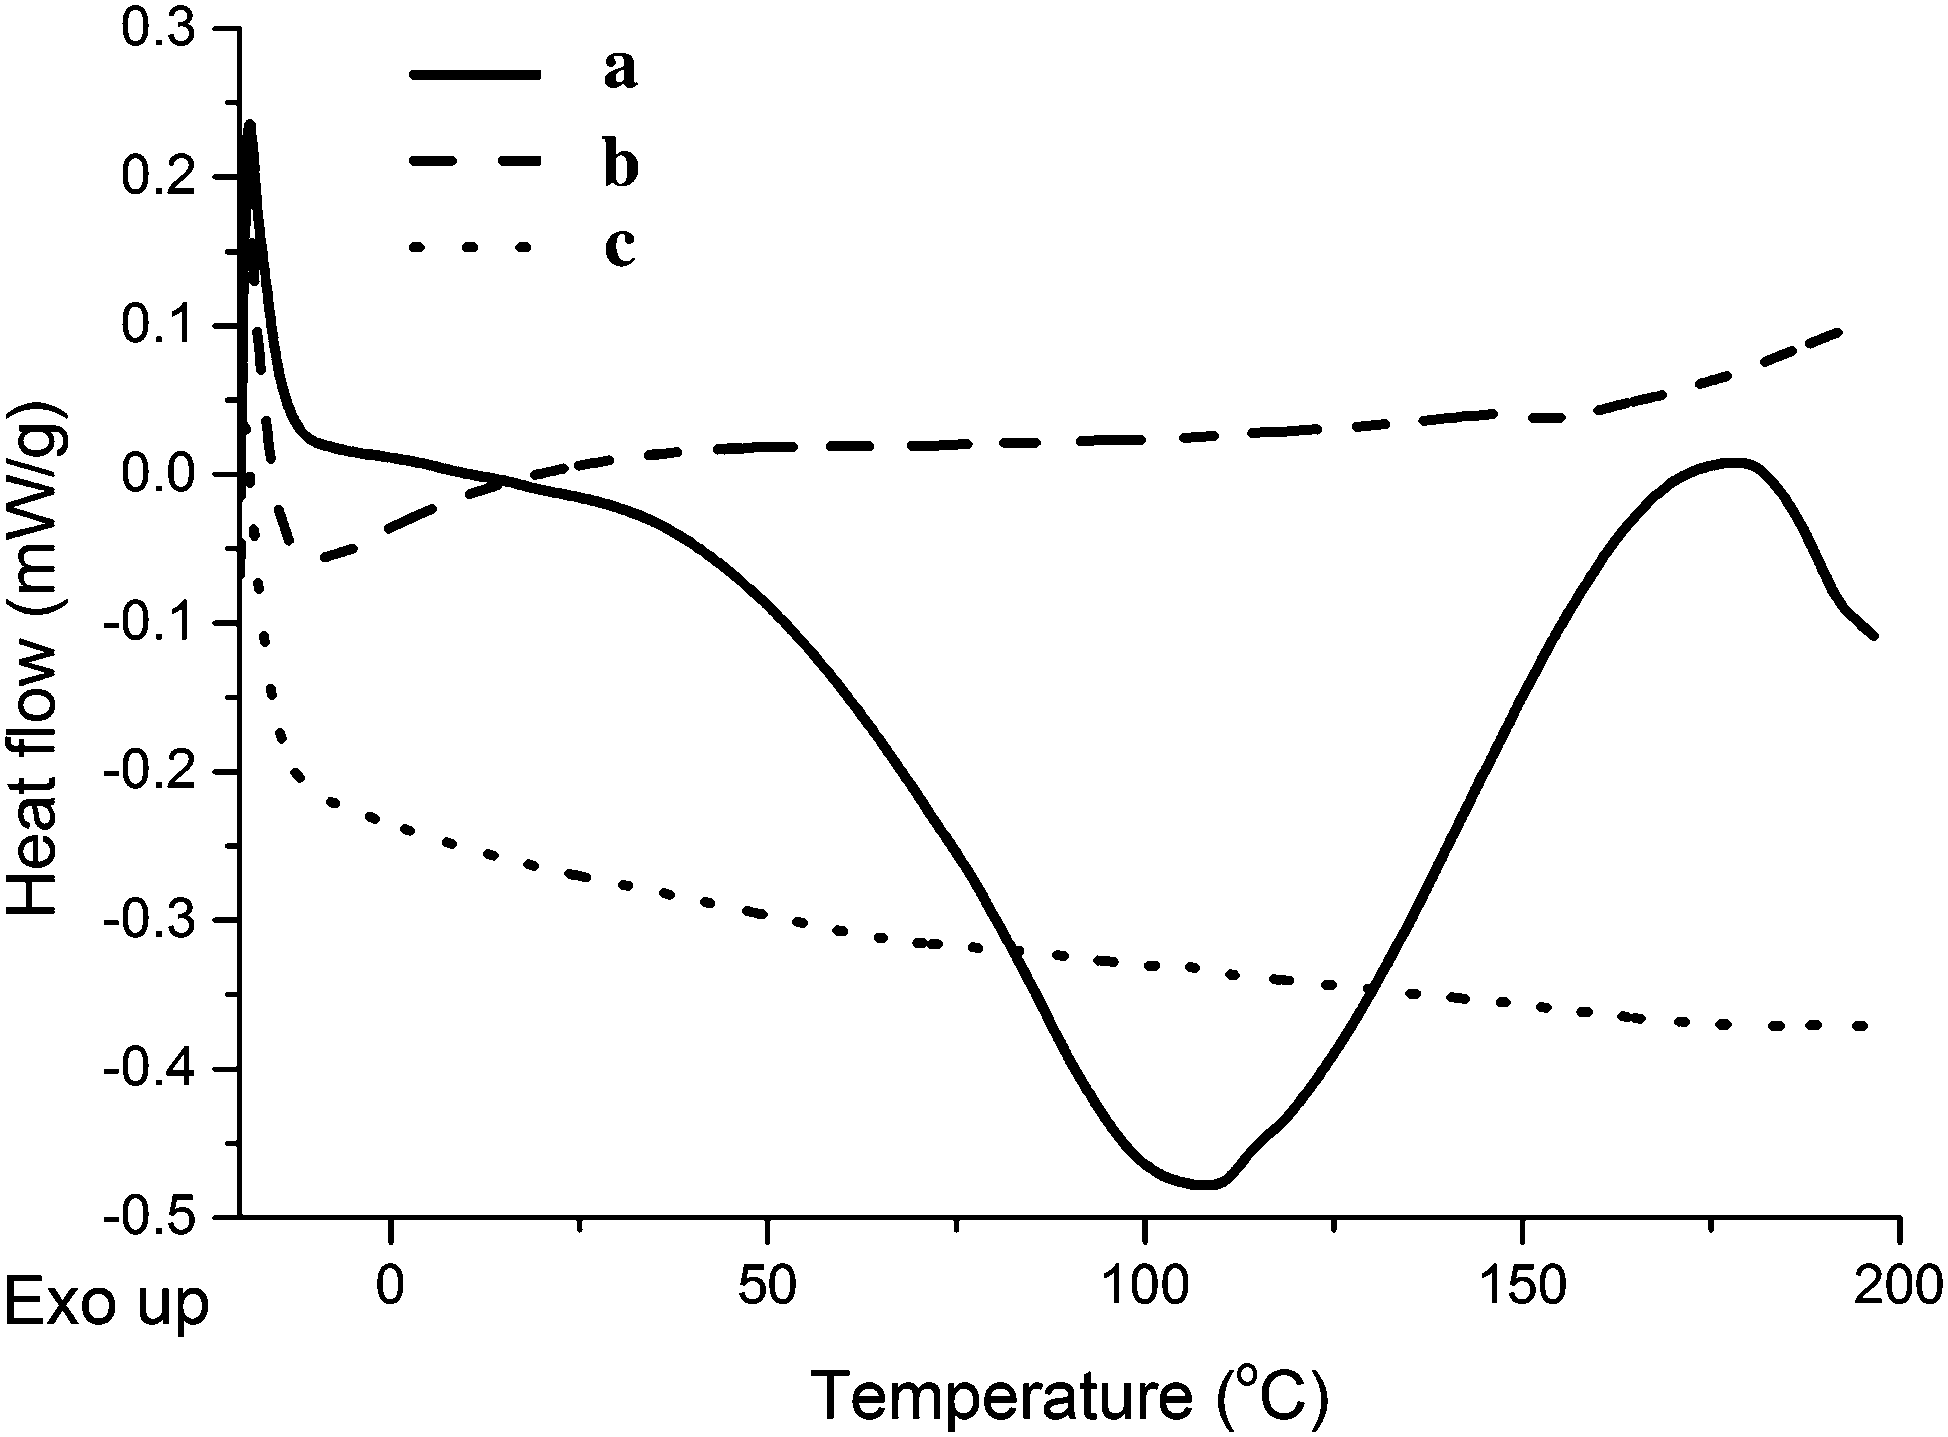 | ||
| Fig. 6 DSC curves of (a) collagen I + III mixture, (b) unreinforced tung oil-based resin, and (c) a composite reinforced with 5.0 wt% collagen I + III mixture. The resin composition is 40 wt% of tung oil, 30 wt% of BMA, 20 wt% of DVB, and 10 wt% of asolectin. | ||
As shown in Fig. S2 (ESI†), the three different kinds of collagen used in this work had a similar DSC profile with characteristic peaks for loss of water centered at 105–110 °C. The collagen extracted from beef tendons exhibit several peaks overlapping with the broad loss of water centered at 110 °C (Fig. S2C, ESI†). In order to confirm the reversibility of these peaks, a heat–cool–heat DSC experiment was carried-out (Fig. S3, ESI†).
Upon initial heating, the collagen extracted from beef tendons exhibits the already discussed DSC profile with the evident loss of water predominating over narrower overlapping peaks, possibly related to collagen conformation changes. On Fig. S3 (ESI†), no peaks are detected during either the cooling of the sample, or the second heating cycle, suggesting that the loss of water during the experiment and any accompanying changes are irreversible. It is worth mentioning, however, that dry samples, upon exposure to ambient conditions, re-adsorb moisture quickly, making it impractical to prepare composites in the absence of water.
Characterization of collagen through CD analysis
The unique secondary structure of proteins lead to specific interactions with circularly polarized light. These interactions are analyzed by means of circular dichroism (CD) spectroscopy. The interpretation of a CD spectrum gives information about characteristic features, such as helices, β-sheets, or random coils. For example, collagen's characteristic triple helix results in a maximum at approximately 222 nm and a minimum at approximately 195 nm in the CD spectrum. Fig. S4 (ESI†) presents the CD spectra for all three types of collagen used in this work.As observed in Fig. S4b (ESI†), collagen type I has the signature curve expected from the dominant triple helix structure of collagen with a maximum at approximately 222 nm and a minimum at approximately 200 nm. The collagen extracted from beef tendons (Fig. S4a, ESI†) does not show a maximum at 222 nm, indicating lack of a triple helix structure. Likewise, the collagen I + III mixture also lack the triple helix characteristic signals in the CD spectrum. A detailed study of the loss of the triple helix during collagen extraction/purification will be carried-out in the near future.
Based on the results shown in Fig. S4 (ESI†), at 5 °C, the triple helix structure of collagen type I would ensure a better mechanical performance than the other two collagen samples investigated. However, since the cure of the composites requires heating up to 140 °C over 24 hours, it is necessary to evaluate the thermal denaturation behavior of the different types of collagen employed (Fig. 7). Fig. 7 presents a graph of the collagen fraction folded (determined from the intensity of the triple helix peak in the CD spectrum) as a function of the temperature. From the results presented, the temperatures traditionally referred to as melting points (Tm) can be determined. At 0.5 fraction folded, the corresponding Tm is 42 °C for the collagen extracted from beef tendons, 39 °C for collagen type I, and 47 °C for the collagen I + III mixture. This suggests that the collagen I + III mixture is slightly more thermally stable than the other two collagen samples. Nevertheless, it is evident from Fig. 7c that the collagen I + III mixture does not exhibit the typical sigmoidal curve expected for the thermal denaturation graph of a regular helical protein. This indicates that either the combination of two types of collagen or a side effect of the preparation method of the mixture impacted its final structure.
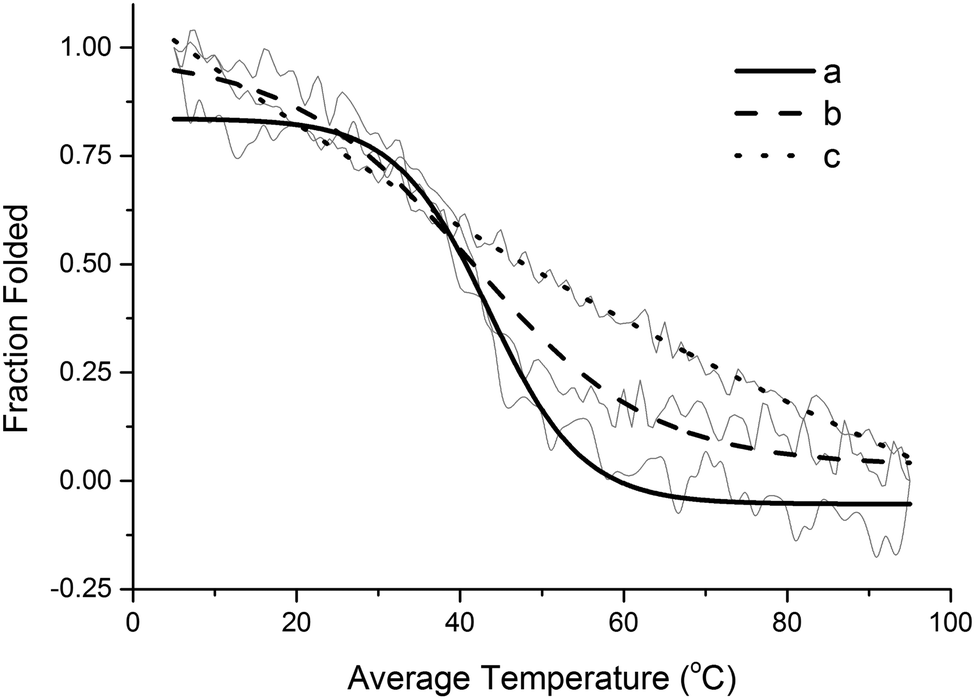 | ||
| Fig. 7 Sigmoidal fit over original CD data for the thermal denaturation of (a) collagen extracted from beef tendons, (b) type I collagen, and (c) collagen I + III mixture. | ||
Dynamic mechanical behavior of composites
DMA was used to compare the mechanical response of resin and composites to an oscillatory stress as a function of temperature. Table 2 summarizes the results obtained for glass transition temperature (Tg), as determined from the peak of the tan Delta curve, and storage moduli at 25 °C and at Tg + 50 °C for composites containing 0.5–5.0 wt% of collagen. Since the Tg is a phenomenon intrinsically related to the resin, the addition of reinforcement should not significantly affect it unless the resin itself is somehow modified by the reinforcement. This can be clearly noticed when comparing the unreinforced resin with composites prepared with collagen extracted from beef tendons (Table 2, entries 1–4). Indeed, an erratic maximum change of 2 °C in the Tg was detected upon addition of collagen extracted from beef tendons (Table 2, entries 1–4).| Entry | Source | Collagen load (wt%) | T g (°C) | E′ at 25 °C (MPa) | E′ at Tg + 50 °C (MPa) |
|---|---|---|---|---|---|
| a The resin yielded prematurely at 70 °C. b http://https://www.plasticsintl.com/datasheets/HDPE.pdf. c http://https://www.marleypipesystems.co.za/images/pdfdownloads/productbrochures/hdpe-physical-properties.pdf. d Material melts at 126 °C. | |||||
| 1 | — | — | 29 ± 2 | 122.2 ± 12.4 | —a |
| 2 | Beef tendon | 0.5 | 27 ± 3 | 120.7 ± 3.7 | 37.4 ± 2.4 |
| 3 | Beef tendon | 1 | 27 ± 3 | 143.0 ± 19.5 | 40.0 ± 1.3 |
| 4 | Beef tendon | 5 | 31 ± 3 | 247.6 ± 6.3 | 50.4 ± 3.4 |
| 5 | Type I | 0.5 | 35 ± 2 | 98.9 ± 1.3 | 19.8 ± 8.9 |
| 6 | Type I | 1 | 36 ± 3 | 132.8 ± 17.5 | 26.0 ± 2.9 |
| 7 | Type I | 5 | 30 ± 3 | 104.1 ± 12.2 | 28.8 ± 3.8 |
| 8 | Types I + III | 0.5 | 36 ± 3 | 129.0 ± 17.0 | 23.0 ± 3.7 |
| 9 | Types I + III | 1 | 37 ± 1 | 131.0 ± 15.0 | 27.0 ± 6.4 |
| 10 | Types I + III | 5 | 35 ± 4 | 152.5 ± 3.3 | 37.0 ± 5.7 |
| 11 | HDPE | — | 67b | 1150.0c | —d |
The similarity in tan Delta behavior between the unreinforced resin and a composite reinforced with 5.0 wt% of collagen extracted from beef tendons can be further evaluated in Fig. 8. As will be discussed later in the text, the lack of a premature break of the composite shows that the addition of collagen extracted from beef tendons increases the mechanical properties of the resin.
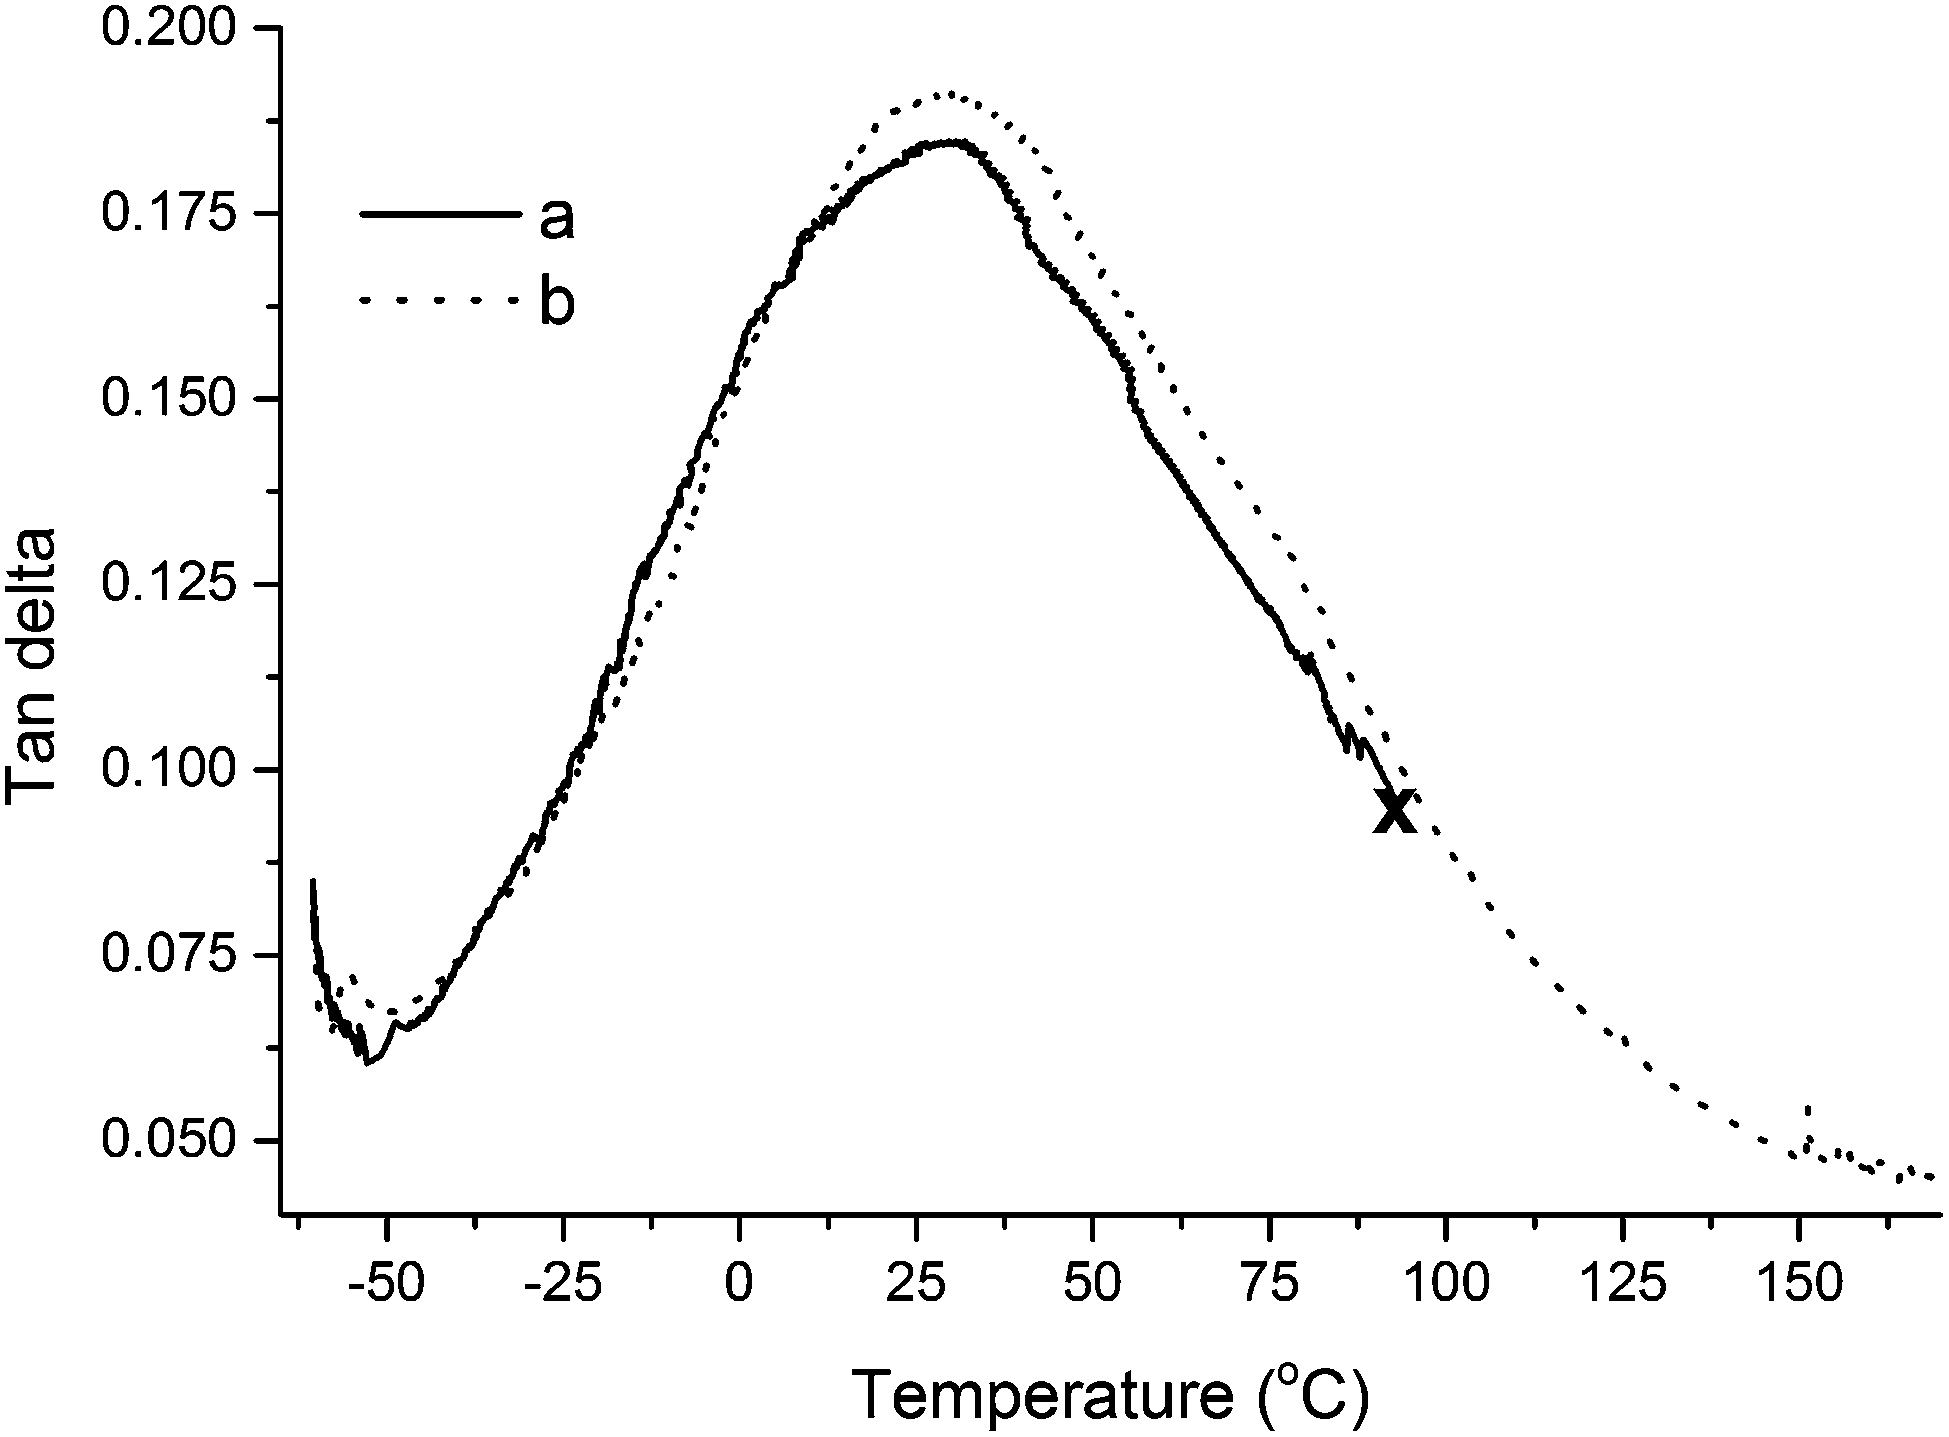 | ||
| Fig. 8 Tan delta curves of (a) unreinforced resin and (b) composite reinforced with 5.0 wt% collagen extracted from beef tendons. The resin composition is 40 wt% of tung oil, 30 wt% of BMA, 20 wt% of DVB, and 10 wt% of asolectin. Premature yielding of the sample is indicated with the symbol “X”. | ||
A more significant increase of the Tg (up to 8 °C) is noticed when the resin is reinforced with type I collagen or collagen I + III mixture (Table 2, entries 5–10), indicating that the flow of resin segments is more significantly impacted by these collagen samples. It is interesting to note that these trends do not necessarily imply a stronger interaction between resin and reinforcement for type I collagen and collagen I + III mixture as one would expect. Indeed, little change in Tg is noticed with changes in collagen loading, suggesting that collagen is simply dispersed amongst the resin. The only deviation observed occurs for the sample reinforced with 5.0 wt% of type I collagen, which exhibits a Tg very similar to that of the unreinforced resin. Furthermore, the reverse trend is observed when comparing the results for storage moduli, with collagen extracted from beef tendons resulting in overall higher values than composites prepared with type I collagen or collagen I + III mixture (Table 2). The only exception to that trend occurs with the composite reinforced with 0.5 wt% of collagen I + III mixture, which exhibits a slightly higher storage modulus at 25 °C than the equivalent composite prepared with collagen extracted from beef tendons. Such deviation from the predominant trend could be related to the low reinforcement load used.
According to the results for storage modulus at 25 °C in Table 2, the reinforcing effect of adding collagen to the resin can only be observed at higher collagen loadings. The only composite that exhibits an improvement of the storage modulus at 25 °C at a 0.5 wt% load, in comparison to the pure resin, is the one prepared with collagen I + III mixture (Table 2, entry 8). Likewise, with the exception of the sample reinforced with 1.0 wt%, all composites prepared with type I collagen exhibited a decrease in E′ at 25 °C in comparison to the unreinforced resin. Regardless of the collagen type used, an increase in storage modulus at 25 °C is clearly observed with increasing collagen loading (Table 2), with an impressive ∼100% improvement for the sample reinforced with 5.0 wt% of collagen extracted from beef tendons in comparison to the unreinforced resin (Table 2, entry 4). Along the same lines, an increase from 129.0 MPa to 152.5 MPa in E′ at 25 °C is observed for the composite prepared with collagen I + III mixture as the collagen load increases from 0.5 wt% to 5.0 wt%, also resulting in an increase in E′ at Tg + 50 °C from 23.0 MPa to 37.0 MPa.
The oscillations in storage modulus at 25 °C pointed out for composites prepared with lower collagen loadings and with type I collagen can be the result of these values being taken at a temperature immediately preceding the Tg of the resin, affecting E′ and deviating from the expected trend. Indeed, the standard deviations calculated for E′ at 25 °C are overall significantly higher than those for E′ at Tg + 50 °C. When E′ is measured at a temperature 50 °C higher than Tg, a more consistent trend is observed, with a clear improvement in E′ for all reinforced samples with respect to the unreinforced resin, and increasing E′ with collagen loading for all types of collagen investigated (Table 2).
As can be seen in Table 2, entry 11, the bio-based composites prepared in this work exhibit inferior properties than HDPE, one of the most widely used material for knee-cap replacements. It is worth noting, however, that a diverse range of properties are desirable for materials used for implants in the biomedical field due to the variety of soft and hard tissues that may need replacement. For example, the properties required for cartilage are very different than those desired for knee-caps. One advantage of the system investigated in this work is the potential tuning of properties by changing the concentration of specific resin components, as explored previously.15
The predominant trends in storage modulus can be fully appreciated for composites containing 5.0 wt% collagen in Fig. 9. The sample prepared with collagen extracted from beef tendons exhibits higher E′ than all other samples up until approximately 90 °C, when the sample prepared with collagen I + III mixture surpasses it briefly before yielding prematurely at ∼120 °C (Fig. 9). When comparing E′ for the unreinforced resin and the composite containing type I collagen, no significant differences are clearly observed, with the exception of the premature yielding of the unreinforced resin at ∼70 °C. The premature yielding of these samples is an indication of their brittleness. Such samples exhibit a shorter temperature range of operation that limits their applicability. It is worth noting that all composites reach the rubbery plateau at approximately 100 °C. Based on the results presented in this report, the purification method employed for the extraction of collagen from beef tendons results in a collagen sample with superior properties than the collagen I + III mixture, which is, in turn, superior than the commercially sourced collagen type I used in this study.
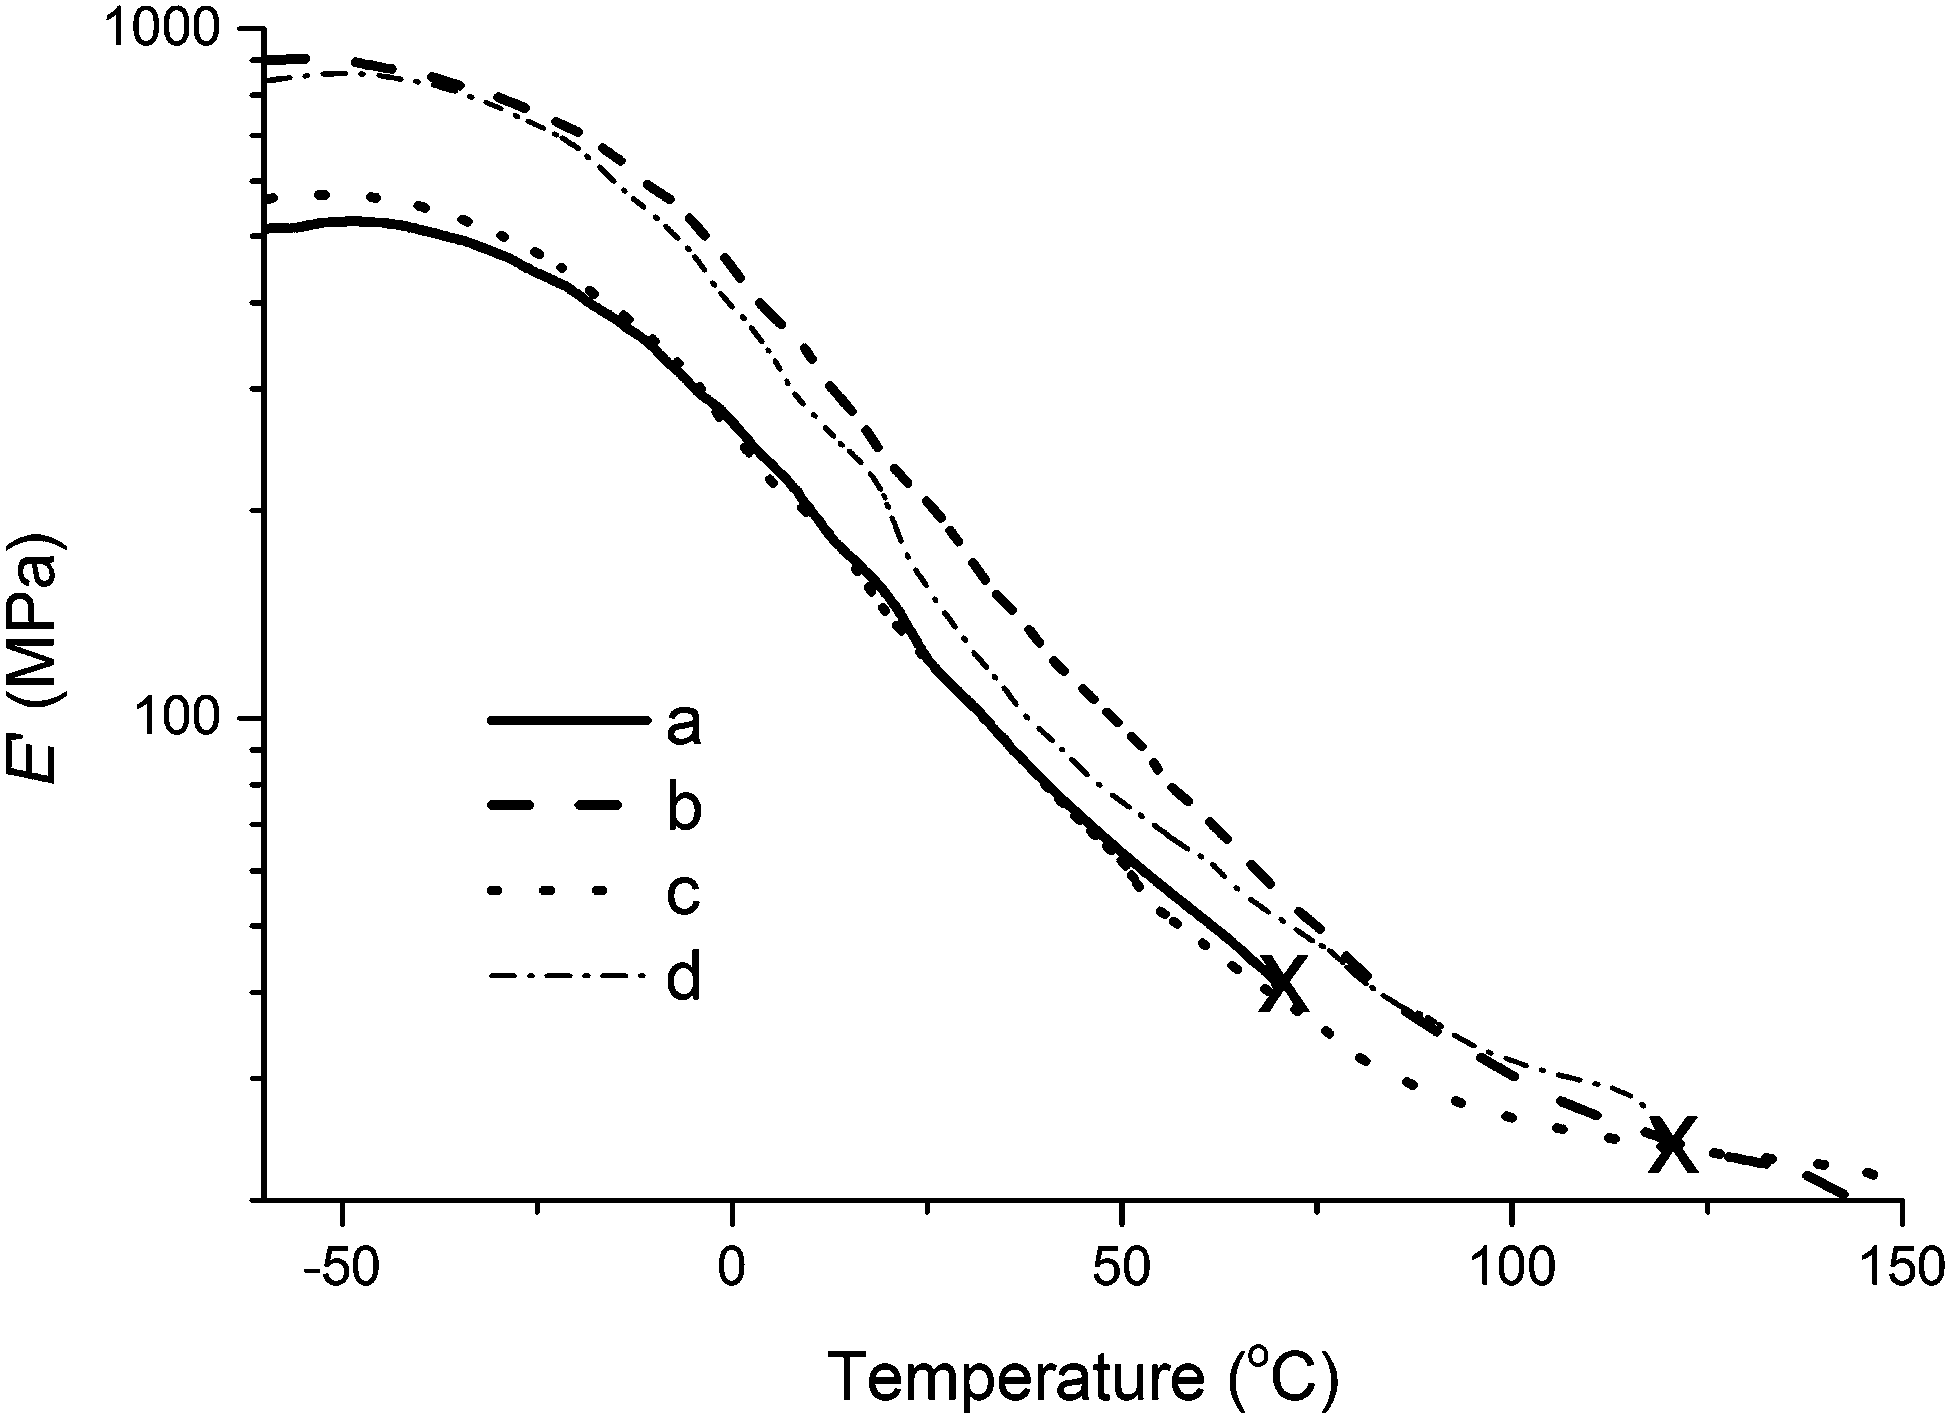 | ||
| Fig. 9 Storage modulus vs. temperature of (a) tung oil-based resin, and tung oil-based resin reinforced with 5.0 wt% of (b) collagen extracted from beef tendons, (c) type I collagen, and (d) collagen I + III mixture. The resin composition is 40 wt% of tung oil, 30 wt% of BMA, 20 wt% of DVB, and 10 wt% of asolectin. Premature yielding of the samples is indicated with the symbol “X”. | ||
Collagen dispersity in the matrix
Several methods have been used in order to evaluate the collagen dispersity in the matrix. Phase separation isn't visually detectable in composites with collagen loading below 5.0 wt%, setting the limiting point for collagen concentration in the composites. Under that limit, collagen appears completely miscible with the matrix as can be observed in the picture of a composite's cross-section (Fig. 10a) and the corresponding sample imaged under optical microscopy (Fig. 10b). Due to the similar electron densities of resin and collagen, it is impossible to distinguish the two components under SEM (Fig. 10c).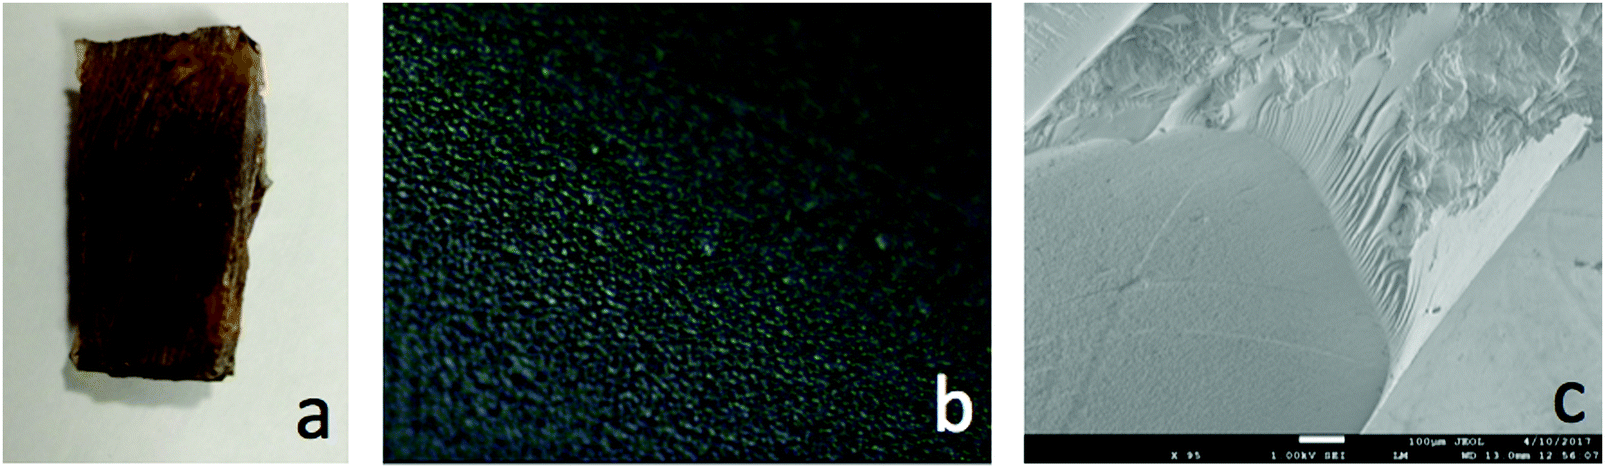 | ||
| Fig. 10 (a) Cross-section of a composite containing 5.0 wt% collagen from beef tendons, (b) optical microscopy image of a composite containing 5.0 wt% collagen from beef tendons (10× magnification), and (c) SEM micrograph of a composite containing 5.0 wt% collagen from beef tendons (95× – the scale bar corresponds to 100 μm). | ||
Conclusion
Based on previous work on the reinforcement of tung oil-based thermosetting resins and preliminary trials of fabricating composites reinforced with a collagen I + III mixture, an ideal resin composition containing 40 wt% of tung oil, 30 wt% of BMA, 20 wt% of DVB, and 10 wt% of asolectin was established. Initial tests also concluded that continuous samples could only be achieved for composites containing ≤10.0 wt% of collagen I + III mixture. DEA was used to monitor the cure of collagen I + III mixture composites when submitted to three distinct cure schedules, revealing that a step-wise temperature increase over a total of 21 hours was required to ensure cure completion. Bubble evolution during collagen composite cure was attributed to inevitable moisture belonging to collagen, which was confirmed by TGA. TGA of collagen composites also revealed an interesting increase in thermal stability for the composite in comparison to its individual components, and also a logical increase in thermal stability with increasing collagen I + III load. Cure completion and the presence of water in all types of collagen used in this work have been confirmed by DSC. Further investigation of the change in collagen's secondary structure has been carried out through CD spectroscopy, and suggests that the different types of collagen used in this study unfold at 37–44 °C. A comparison of composites prepared with different types of collagen at different loads has been conducted through DMA, revealing that samples containing collagen extracted from beef tendons exhibit higher storage modulus but similar Tg to the unreinforced resin. Overall, the thermal and mechanical properties of the tung oil-based resin is improved upon reinforcement with collagen, exhibiting an impressive maximum improvement of ∼100% for the sample reinforced with 5.0 wt% of collagen extracted from beef tendons. With the results presented in this work, it is conclude that improvements in mechanical strength and bio-compatibility tests are necessary before collagen/tung oil biocomposites can be used as a replacement for HDPE in medical implants. In the near future, a closer look will be taken on the effect of the secondary structure of collagen on the composites' mechanical properties.Conflict of interest
The authors declare no conflict of interest.Acknowledgements
The authors thank the financial support received from the National Science Foundation (Award Number: NSF-CHE (REU) 1359229).References
- G. Zhang, L. Zhao, S. Hu, W. Gan, Y. Yu and X. Tang, Polym. Eng. Sci., 2008, 48, 1322–1328 Search PubMed.
- H. O. Sharma, M. Alam, U. Riaz, S. Ahmad and S. M. Ashraf, Int. J. Polym. Mater., 2007, 56, 437–451 CrossRef CAS.
- S. Bhuyan, L. S. Holden, S. Sundararajan, D. Andjelkovic and R. C. Larock, Wear, 2007, 263, 965–973 CrossRef CAS.
- V. Sharma, J. S. Banait and P. P. Kundu, J. Appl. Polym. Sci., 2009, 114, 446–456 CrossRef CAS.
- M. Zhan and R. P. Wool, J. Appl. Polym. Sci., 2010, 118, 3274–3283 CrossRef CAS.
- S. M. Ashraf, S. Ahmad and U. Riaz, Polym. Int., 2007, 56, 1173–1181 CrossRef CAS.
- C. Wang, L. Yang, B. Ni and G. Shi, J. Appl. Polym. Sci., 2009, 114, 125–131 CrossRef CAS.
- C. Liu, X. Yang, J. Cui, Y. Zhou, L. Hu, M. Zhang and H. Liu, Bioresources, 2012, 7, 447–463 CAS.
- L. Montero de Espinosa and M. Meier, Eur. Polym. J., 2010, 47, 837–852 CrossRef.
- N. Thanamongkollit, K. R. Miller and M. D. Soucek, Prog. Org. Coat., 2012, 73, 425–434 CrossRef CAS.
- M. Samadzadeh, S. H. Boura, M. Peikari, A. Ashrafi and M. Kasiriha, Prog. Org. Coat., 2011, 70, 383–387 CrossRef CAS.
- Q. Ge, H. Wang, Y. She, S. Jiang, M. Cao, L. Zhai and S. Jiang, J. Appl. Polym. Sci., 2015, 132 DOI:10.1002/app.41608.
- A. Johns, S. Morris, K. Edwards and R. L. Quirino, J. Appl. Polym. Sci., 2015, 132 DOI:10.1002/app.41833.
- U. Biermann, U. Bornscheuer, M. A. Meier, J. O. Metzger and H. Schafer, J. Angew. Chem. Int. Ed., 2011, 50, 3854–3871 CrossRef CAS PubMed.
- Y. Xia, R. L. Quirino and R. C. Larock, J. Renewable Mater., 2013, 1, 3–27 CrossRef CAS.
- K. Das, D. Ray, C. Banerjee, N. Bandyopadhyay, A. K. Mohanty and M. Misra, J. Appl. Polym. Sci., 2011, 119, 2174–2182 CrossRef CAS.
- Y. Xia and R. C. Larock, Green Chem., 2010, 12, 1893–1910 RSC.
- D. P. Pfister, J. R. Baker, P. H. Henna, Y. S. Lu and R. C. Larock, J. Appl. Polym. Sci., 2008, 108, 3618–3625 CrossRef CAS.
- S. Park, F. Jin and J. Lee, Mater. Sci. Eng., A, 2004, 374, 109–114 CrossRef.
- Y. Huang, L. Pang, H. Wang, R. Zhong, Z. Zeng and J. Yang, Prog. Org. Coat., 2013, 76, 654–661 CrossRef CAS.
- N. Thanamongkollit and M. D. Soucek, Prog. Org. Coat., 2012, 73, 382–391 CrossRef CAS.
- J. Ashley, K. Edwards, S. Inglesby and R. L. Quirino, Coatings, 2016, 6, 56–68 CrossRef.
- T. Navratil, I. Sestakova and V. Marecek, Int. J. Electrochem. Sci., 2011, 6, 6032–6046 CAS.
- H. P. Bachinger, P. Bruckner, R. Timpl, D. J. Prockop and J. Engel, Eur. J. Biochem., 1980, 106, 619–632 CrossRef CAS PubMed.
- P. Xu, J. Huang, P. Cebe and D. L. Kaplan, Biomacromolecules, 2008, 9, 1551–1557 CrossRef CAS PubMed.
- K. Yoshimura, M. Terashima, D. Hozan and K. Shirai, J. Agric. Food Chem., 2000, 48, 685–690 CrossRef CAS PubMed.
- S. Oprea, J. Compos. Mater., 2010, 44, 2179–2189 CrossRef CAS.
- E. Mocan, O. Tagadiuc and V. Nacu, Medical Courier, 2011, 320, 3–5 Search PubMed.
Footnote |
| † Electronic supplementary information (ESI) available. See DOI: 10.1039/c7qm00112f |
| This journal is © the Partner Organisations 2017 |