Synthesis and investigation of layered GeS as a promising large capacity anode with low voltage and high efficiency in full-cell Li-ion batteries†
Yaqing
Wei
a,
Jun
He
a,
Qing
Zhang
a,
Chang
Liu
a,
Ameng
Wang
a,
Huiqiao
Li
*ab and
Tianyou
Zhai
 a
a
aState Key Laboratory of Material Processing and Die & Mould Technology, School of Materials Science and Engineering, Huazhong University of Science and Technology (HUST), Wuhan 430074, Hubei, P. R. China. E-mail: hqli@hust.edu.cn
bKey Laboratory of Advanced Energy Materials Chemistry (Ministry of Education), Nankai University, Tianjin 300071, P. R. China
First published on 6th April 2017
Abstract
GeS with a layered structure is expected to be a promising anode material for lithium ion batteries by the theoretical prediction of its excellent ion intercalation response. However, its experimental investigation is limited because of its low yield and complicated synthesis procedure. In this work, we successfully synthesize pure GeS and its carbon composite on a large scale by a simple and facile ball milling method. When serving as a novel anode material, GeS/C delivers a high reversible capacity of 1768 mA h g−1 with a high initial coulombic efficiency of 94% for lithium-ion batteries. The ex situ XRD patterns and CV tests confirm that GeS undergoes firstly a conversion reaction followed by an alloying type of lithium storage mechanism, in which the electrochemical performance controlled within the alloying reaction region is very stable and highly reversible, with a low and safe potential of 0.35 V vs. Li+/Li. When further applied in a full cell by coupling commercial LiCoO2 as the cathode, the assembled LiCoO2//GeS full cell can offer a high capacity of 736 mA h g−1, with a high flat discharge plateau of 3.4 V, showing a high utilization efficiency of the GeS anode. These results demonstrate that the layered GeS is a potential anode for high-energy lithium-ion batteries.
Introduction
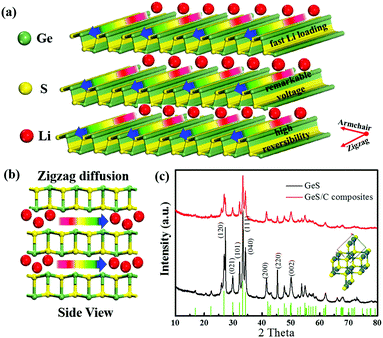
Two-dimensional (2D) sulfide materials are attracting increasing interest in lithium-ion batteries (LIBs) due to their promising ion-intercalation capability and high electrical conductivity, such as layered WS21–4 and MoS2.5–7 However, W and Mo elements are inactive for Li storage, which greatly reduces the Li storage-specific capacity.8,9 The recently discovered group IV–VI materials (e.g. GeS, SnS, GeSe, SnSe)10–13 are also found to possess a similar layered structure like WS2 and MoS2, in which Ge and Sn can further alloy with Li thus providing additional capacity for Li storage compared to W and Mo.14,15 It is noteworthy that the Ge element is lighter than Sn and the S element is lighter than Se, which indicates that GeS should have the highest theoretical capacity among the above-mentioned sulfide materials.As shown in Fig. 1a and b, GeS belongs to an orthorhombic system, where chemically bonded Ge–S layers are stacked by van der Waals forces.16–18 The activation barriers of Li ions along the zigzag direction between GeS layers are calculated to be about 0.19 eV, which is much lower than that of 1.05 eV of the armchair direction, indicating that the insertion of Li+ preferably occurs along the zigzag direction.19 First-principles calculations predicted that the energy barriers for Li diffusion in the GeS structure and the Li adsorption energy for GeS are also lower than the above-mentioned sulfides, suggesting that Li ions can rapidly insert and extract between the GeS layers; the interconnection between Li+ and layered GeS is strong enough to prevent the clustering of Li ions, which can help to maintain the structural integrity.20 In addition, the semiconductive GeS would turn to a conductor after lithiation, which may further facilitate electron transport in the layered GeS.21 With these unique properties, GeS is expected to serve as a potential anode with a high capacity for LIBs.
However, the experimental utilization of GeS as an anode material has rarely been investigated until now. Recently, most attention regarding GeS has been paid to its photoelectric and electromagnetic applications as a semiconductor.22–24 And to achieve the high crystallization and thin layer morphology desired by these semiconductor applications, the reported synthesis of GeS usually involves the solution-chemistry route,25,26 chemical vapor deposition (CVD) methods27,28 or the chemical vapor transport (CVT) approach,29 which often give rise to a very low yield and cannot be applied to the preparation of LIB materials.30–32 Besides, these synthesis procedures are complicated and mostly need surfactant or annealing treatment.33–36 Therefore, it is imperative to develop a simple, facile and controllable method to synthesize GeS with high yield, low cost and environmental friendliness for the sake of using it in LIBs.
In this work, we for the first time successfully synthesize GeS and its carbon nanocomposite on a large scale by simple mechanical milling of Ge and low-cost S powder. GeS holds a layered structure similar to WS2 and MoS2. When used as an anode material, the GeS electrode delivers a discharge and charge capacity of 1675 and 1505 mA h g−1, and a high initial coulombic efficiency of 90%, but with fast deterioration of cycle stability. After being composited with carbon, GeS/C delivers a large specific capacity of 1768 mA h g−1, 6 times higher than that of graphite, with a high initial coulombic efficiency of 94%, which is one of the highest values among the reported sulphide anode materials to date, to the best of our knowledge. Besides, GeS obtained by high-energy mechanical ball milling possesses a high density of 3.78 g cm−3, which suggests a high volume capacity of the GeS electrode. The ex situ XRD patterns and CV tests confirm that GeS undergoes an integrated conversion and alloying type of lithium storage mechanism. It is found that when the electrode was controlled within the alloying reaction region, GeS/C can demonstrate a large capacity with a very stable cycle performance. More importantly, the discharge plateau of the alloying reaction is 0.35 V, lower than that of other anode materials, but still higher than the plating voltage of lithium, preventing the generation of lithium dendrite at the same time.37 Attributed to this superior performance, a full cell was further assembled by coupling LiCoO2 as the cathode and GeS as the anode. The LiCoO2//GeS full cell offers a high capacity of 736 mA h g−1, which is close to the full utilization of the alloying capacity. Besides, the discharge plateau of the full cell reaches up to 3.4 V, which is much higher than the reported cell voltages of full cells based on metal oxides/phosphide and insertion-type Ti-based anodes. These results demonstrate that GeS is a potential anode material for high-energy LIBs.
Experimental details
Preparation and characterization of materials
The pure phase GeS and GeS/C nanocomposites were synthesized by the high-energy mechanical milling (HEMM) method. Typically, Ge powder and S powder in an equal molar ratio of 1![[thin space (1/6-em)]](https://www.rsc.org/images/entities/char_2009.gif) :
:![[thin space (1/6-em)]](https://www.rsc.org/images/entities/char_2009.gif) 1 were added to a stainless steel jar in a glove box under an Ar atmosphere. After sealing and fixing to the instrument, the mixture was milled with a rotational speed of 400 rpm for 10 hours to get pure GeS powder. Similarly, the GeS/C nanocomposite was synthesized in the same way by milling the pure GeS and carbon in a mass ratio of 7
1 were added to a stainless steel jar in a glove box under an Ar atmosphere. After sealing and fixing to the instrument, the mixture was milled with a rotational speed of 400 rpm for 10 hours to get pure GeS powder. Similarly, the GeS/C nanocomposite was synthesized in the same way by milling the pure GeS and carbon in a mass ratio of 7![[thin space (1/6-em)]](https://www.rsc.org/images/entities/char_2009.gif) :
:![[thin space (1/6-em)]](https://www.rsc.org/images/entities/char_2009.gif) 2 for 10 hours. X-ray diffraction (XRD, PANalytical X’pert PRO-DY2198), X-ray photoelectron spectroscopy (XPS, AXIS-ULTRA DLD-600W) and confocal Raman spectrometer (Raman, JobinYvon HR800) with a 532 nm excitation laser were used to characterize the synthesized samples. The morphology and microstructure of the products were obtained using a scanning electron microscope (SEM, FEI Quanta650 FEG) and a transmission electron microscope (TEM, FEI Tecnai JEL 2100).
2 for 10 hours. X-ray diffraction (XRD, PANalytical X’pert PRO-DY2198), X-ray photoelectron spectroscopy (XPS, AXIS-ULTRA DLD-600W) and confocal Raman spectrometer (Raman, JobinYvon HR800) with a 532 nm excitation laser were used to characterize the synthesized samples. The morphology and microstructure of the products were obtained using a scanning electron microscope (SEM, FEI Quanta650 FEG) and a transmission electron microscope (TEM, FEI Tecnai JEL 2100).
Electrochemical measurements
For electrochemical characterization, the active material GeS/C was firstly mixed with LiOH–poly(acrylic acid) binder (denoted as Li–PAA) in a weight ratio of 9![[thin space (1/6-em)]](https://www.rsc.org/images/entities/char_2009.gif) :
:![[thin space (1/6-em)]](https://www.rsc.org/images/entities/char_2009.gif) 1, then the slurry was coated onto a copper foil and dried under vacuum at 80 °C for 12 h. The obtained electrode films were pressed to enhance the contact between the active material and the Cu foil after drying. For comparison, the bare GeS electrode was prepared in the same way by mixing with carbon conductive and Li–PAA at a weight ratio of 7
1, then the slurry was coated onto a copper foil and dried under vacuum at 80 °C for 12 h. The obtained electrode films were pressed to enhance the contact between the active material and the Cu foil after drying. For comparison, the bare GeS electrode was prepared in the same way by mixing with carbon conductive and Li–PAA at a weight ratio of 7![[thin space (1/6-em)]](https://www.rsc.org/images/entities/char_2009.gif) :
:![[thin space (1/6-em)]](https://www.rsc.org/images/entities/char_2009.gif) 2
2![[thin space (1/6-em)]](https://www.rsc.org/images/entities/char_2009.gif) :
:![[thin space (1/6-em)]](https://www.rsc.org/images/entities/char_2009.gif) 1. The mass loading of the material on the working electrode was about 2.6–3.8 mg cm−2. A 2032 coin-type cell was assembled at room temperature in a glove box under argon with a water–oxygen content below 1 ppm. A commercialized LiCoO2 electrode coated on an Al current collector was used as the cathode and the GeS/C nanocomposite was used as the anode to assemble full cells. In order to control the GeS anode within the alloying reaction region in the full cell, pre-lithiation of GeS was firstly conducted in a half-cell over the voltage range of 0.005–0.75 V. Then the pre-lithiated GeS electrode was disassembled from the half-cell and used to fabricate the GeS//LiCoO2 full cell. The electrolyte was 1.0 mol L−1 LiPF6 dissolved in ethylene carbonate (EC), dimethyl carbonate (DMC) and ethyl methyl carbonate (EMC) (EC
1. The mass loading of the material on the working electrode was about 2.6–3.8 mg cm−2. A 2032 coin-type cell was assembled at room temperature in a glove box under argon with a water–oxygen content below 1 ppm. A commercialized LiCoO2 electrode coated on an Al current collector was used as the cathode and the GeS/C nanocomposite was used as the anode to assemble full cells. In order to control the GeS anode within the alloying reaction region in the full cell, pre-lithiation of GeS was firstly conducted in a half-cell over the voltage range of 0.005–0.75 V. Then the pre-lithiated GeS electrode was disassembled from the half-cell and used to fabricate the GeS//LiCoO2 full cell. The electrolyte was 1.0 mol L−1 LiPF6 dissolved in ethylene carbonate (EC), dimethyl carbonate (DMC) and ethyl methyl carbonate (EMC) (EC![[thin space (1/6-em)]](https://www.rsc.org/images/entities/char_2009.gif) :
:![[thin space (1/6-em)]](https://www.rsc.org/images/entities/char_2009.gif) DMC
DMC![[thin space (1/6-em)]](https://www.rsc.org/images/entities/char_2009.gif) :
:![[thin space (1/6-em)]](https://www.rsc.org/images/entities/char_2009.gif) EMC = 1
EMC = 1![[thin space (1/6-em)]](https://www.rsc.org/images/entities/char_2009.gif) :
:![[thin space (1/6-em)]](https://www.rsc.org/images/entities/char_2009.gif) 1
1![[thin space (1/6-em)]](https://www.rsc.org/images/entities/char_2009.gif) :
:![[thin space (1/6-em)]](https://www.rsc.org/images/entities/char_2009.gif) 1 vol%) solution. The galvanostatic discharge/charge profiles and cycle stability were performed at a current rate of 0.1 A g−1 in the voltage range of 0.005 and 3.0 V vs. Li+/Li on an automatic battery testing system of Hokuto Denko (HJ1001SD8). The high rate performance of the GeS/C electrodes was examined at different current densities of 0.1, 0.2, 0.5, 0.8, 1.0, 1.5 and 2.0 A g−1. The cyclic voltammetry (CV) over voltage ranges of 0.005–0.75 V, 0.75–3.0 V and 0.005–3.0 V at a scanning rate of 0.1 mV s−1 was recorded by a CHI660E electrochemical workstation.
1 vol%) solution. The galvanostatic discharge/charge profiles and cycle stability were performed at a current rate of 0.1 A g−1 in the voltage range of 0.005 and 3.0 V vs. Li+/Li on an automatic battery testing system of Hokuto Denko (HJ1001SD8). The high rate performance of the GeS/C electrodes was examined at different current densities of 0.1, 0.2, 0.5, 0.8, 1.0, 1.5 and 2.0 A g−1. The cyclic voltammetry (CV) over voltage ranges of 0.005–0.75 V, 0.75–3.0 V and 0.005–3.0 V at a scanning rate of 0.1 mV s−1 was recorded by a CHI660E electrochemical workstation.
Results and discussion
Material characterization and structural analysis
The pure phase GeS powder was synthesized on a large scale via a facile and controllable high-energy mechanical milling method. Fig. 1c shows the XRD patterns of the synthesized samples after 10 h of ball milling, whose diffraction peaks agree well with the GeS (JCPDS Card No. 51-1168) phase with the lattice constants of a = 4.298 Å, b = 10.470 Å and c = 3.641 Å. The Raman measurement shown in Fig. S1 (ESI†) further demonstrates the formation of the GeS phase by the ball milling method, in which the peak position is consistent with the literature report.25,38 The layered structure of GeS is illustrated in Fig. 1b, where the chemical bonded Ge–S layers are stacked by van der Waals forces like SnS.39 Li ions can spontaneously and rapidly insert into the layer spacing along the zigzag direction (the arrow direction). After being composited with carbon by further ball-milling for another 10 hours, the obtained GeS/C sample shows the same diffraction peaks as the pure phase GeS, except that its peak intensity is lower and its peak width is also broader than that of the pure phase GeS. This suggests the decreased crystallinity and reduced particle size of GeS after being composited with carbon. According to the calculation using the Scherrer formula, the particle size of GeS has decreased from 42 nm for the pure phase to 24 nm for the GeS/C composite.The surface composition and chemical states of pure phase GeS and the GeS/C composite were further characterized by X-ray photoelectron spectroscopy (XPS). As shown in Fig. 2a, both GeS and GeS/C mainly contain C, Ge, S and O elements. Fig. 2b shows the high-resolution C 1s spectrum of the GeS/C composite, whose detected peaks can be deconvoluted into three peaks; the carbon in C–C, C–O–C, and O–C![[double bond, length as m-dash]](https://www.rsc.org/images/entities/char_e001.gif) O appeared at 284.68, 285.85 and 288.96 eV, respectively.40 As shown in Fig. 2c of the high-resolution Ge 3d spectrum, the binding energies located at 29.78, 31.16 and 32.42 eV can be ascribed to the Ge 3d5/2, Ge–S bonding and Ge 3d photoelectron emissions.41 The Ge 3d5/2 and Ge–S bonding correspond to the oxidation state of Ge2+. According to the fitting results, the Ge2+ valence state accounts for the main part, revealing that Ge exists primarily in the oxidation state of Ge2+. In Fig. 2d, the S 2p3/2 and S 2p1/2 located at 162 and 163.15 eV suggest an oxidation state of S2−.42 Besides, the elemental ratio of Ge
O appeared at 284.68, 285.85 and 288.96 eV, respectively.40 As shown in Fig. 2c of the high-resolution Ge 3d spectrum, the binding energies located at 29.78, 31.16 and 32.42 eV can be ascribed to the Ge 3d5/2, Ge–S bonding and Ge 3d photoelectron emissions.41 The Ge 3d5/2 and Ge–S bonding correspond to the oxidation state of Ge2+. According to the fitting results, the Ge2+ valence state accounts for the main part, revealing that Ge exists primarily in the oxidation state of Ge2+. In Fig. 2d, the S 2p3/2 and S 2p1/2 located at 162 and 163.15 eV suggest an oxidation state of S2−.42 Besides, the elemental ratio of Ge![[thin space (1/6-em)]](https://www.rsc.org/images/entities/char_2009.gif) :
:![[thin space (1/6-em)]](https://www.rsc.org/images/entities/char_2009.gif) S in the GeS/C composite is 1
S in the GeS/C composite is 1![[thin space (1/6-em)]](https://www.rsc.org/images/entities/char_2009.gif) :
:![[thin space (1/6-em)]](https://www.rsc.org/images/entities/char_2009.gif) 1, as demonstrated by the energy dispersive spectroscopy (EDS) measurement shown in Fig. S2 (ESI†), which is well consistent with the stoichiometry of GeS.
1, as demonstrated by the energy dispersive spectroscopy (EDS) measurement shown in Fig. S2 (ESI†), which is well consistent with the stoichiometry of GeS.
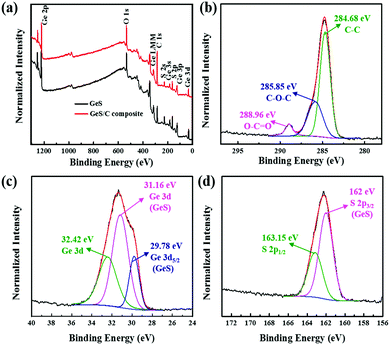 | ||
| Fig. 2 XPS spectra of the prepared GeS and GeS/C composites: (a) survey, (b) C 1s, (c) Ge 3d, and (d) S 2p. | ||
The SEM images of the synthesized pure GeS sample and the GeS/C composite are shown in Fig. 3a–d. Both of them exhibit similar morphology and comparable particle size, which are made of a large number nano-sized irregular primary particles. And these primary nanoparticles have further agglomerated into secondary micrograins with a random size distribution from dozens of nanometers to a few micrometers. Elemental mapping analysis in Fig. 3e–g reveals that Ge, S and C elements are uniformly distributed with each other in the GeS/C composite, which indicates the GeS particles and carbon material have effectively formed a nanocomposite rather than simply mixing under the high-energy mechanical ball milling method.
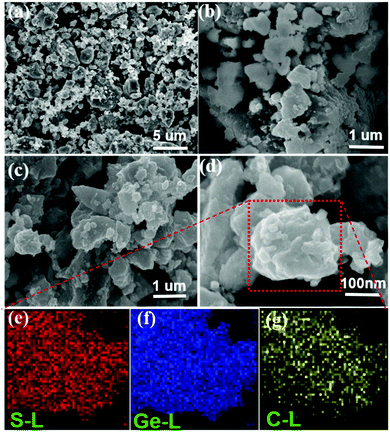 | ||
| Fig. 3 SEM images of GeS (a and b) and the GeS/C composite (c and d); elemental mappings of the GeS/C composite (e–g). | ||
Fig. 4a shows the low-resolution TEM image of the GeS/C nanocomposite. It reveals that GeS/C is composed of irregular primary particles with an average size of about dozens of nanometers. The GeS nanoparticles are dispersed uniformly in the carbon matrix. Fig. 4b and c show the HRTEM images of the typical GeS particle and GeS/C nanocomposite, respectively. Highly ordered periodical lattice fringes with a d-spacing of 0.33 nm can be well observed for the GeS particle, which matches well with the interplanar spacing of the (120) plane of the GeS phase. After being composited with carbon, the GeS/C nanocomposites still maintain some crystallinity. The observed lattice fringes in Fig. 4c are calculated to be about 0.33 nm and 0.28 nm, corresponding to the interplanar spacing of the (120) plane and (101) plane of GeS. The XRD patterns in Fig. 1b and the inset fast-Fourier transform (FFT) images of Fig. 4c further reveal that GeS nanoparticles keep their crystallinity after being composited and dispersed in the carbon matrix.
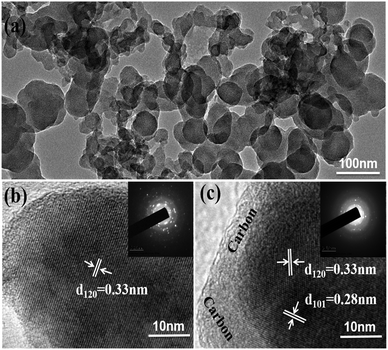 | ||
| Fig. 4 TEM of the GeS/C composite (a); HRTEM and inset FFT images of GeS (b) and the GeS/C composite (c). | ||
Electrochemical characterization
GeS possesses an orthorhombic layered structure, which is regarded as very beneficial to ion intercalation and suitable for use in energy storage. Fig. 5a presents the discharge/charge profile of GeS at a current density of 100 mA g−1. When used as an anode electrode, GeS delivers a discharge and charge capacity of 1675 and 1505 mA h g−1, corresponding to a high initial coulombic efficiency of 90%. However, the charge capacity of pure GeS rapidly decreases to 808 mA h g−1 after only 4 cycles. In comparison, the GeS/C nanocomposite (Fig. 5b) shows much enhanced cycle stability with a first discharge/charge capacity of 1767.7 and 1663.6 mA h g−1, respectively, 6 times higher than graphite. What is more, the GeS/C nanocomposite exhibits a high initial coulombic efficiency of 94%, which is one of the highest values among the reported anode materials up to now. Similarly, the layered phosphorus GeP5 also exhibited a high initial coulombic efficiency up to 95% and high electrical conductivity endowed by the layered structure.8 After 4 cycles, a specific charge capacity of 1628 mA h g−1 can still be obtained for the GeS/C sample. The much enhanced cycle stability of the GeS/C nanocomposite profits from the good combination and homogeneous distribution of GeS with carbon.43 It is noteworthy that there are two discharge platforms for both the GeS and GeS/C electrodes, corresponding to 1.25 V and 0.35 V, respectively. The fast capacity decay of the GeS electrode is mainly related to the rapid attenuation of the discharge platform of 1.25 V. Li2S produced by the conversion reaction of pure GeS may suffer from polysulfide shuttling and solubility problems as well as low conductivity, which resulted in the fast deterioration of cycle stability. After being composited with carbon, the discharge platform of 1.25 V can be better maintained, thus the cycle performance of the GeS/C nanocomposite is improved. Fig. 5c and d shows the dQ/dV curves of the pure GeS and GeS/C composite, respectively. It is obvious to find two bands of pronounceable redox peaks for both samples, which correspond to the conversion reaction (0.75–3.0 V) and alloying reaction (0.005–0.75 V) respectively. For pure GeS (Fig. 5c), the reduction peaks at 0.2 V were gradually decreased during cycling. Besides, the sharp irreversible reduction peaks between 1.1–1.5 V disappear after only 3 cycles, suggesting the instability of the conversion reaction. In contrast, after being composited with carbon, the GeS/C composites (Fig. 5d) keep the reduction peaks at 1.25 V and an oxidation peak at 2.15 V well even after several cycles, corresponding to the reversible reaction (e.g. the formation and decomposition of Li2S). It is noted that both the peak shape and peak area of the GeS/C nanocomposite show little change upon cycling, indicating a superior cycle stability. This phenomenon reveals that the combination of GeS with carbon can greatly improve its cycle stability. On the one hand, decreasing the size of GeS particles at the nanoscale can mitigate physical strain, provide additional capacity by surface adsorption and increase the reversibility of the reaction to obtain a high coulombic efficiency.44–46 On the other hand, the carbon matrix with high electrical conductivity, flexibility and chemical stability can buffer the large volume changes, facilitate the electronic transportation, and effectively relieve the solubility problem of the conversion reaction.47,48 Therefore, the GeS/C composite can well maintain the electrode integrity and exhibit large capacity with superior cycle performance to pure GeS.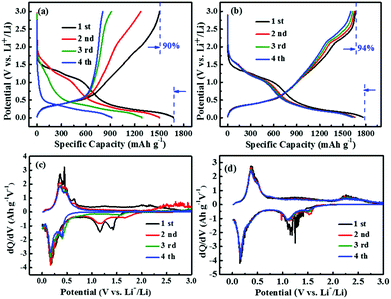 | ||
| Fig. 5 The discharge/charge profiles and the corresponding dQ/dV curves of GeS (a and c) and the GeS/C composite (b and d). | ||
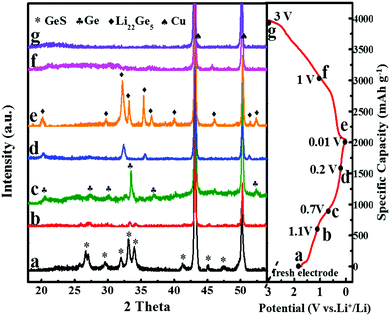
To investigate the lithium storage mechanism of GeS, ex situ XRD tests on the discharged and charged electrodes were performed. As shown in Fig. 6, when discharged to 1.1 V, the peak intensity of the GeS phase drastically decreases and the XRD peak of Ge slowly appears. After being discharged to 0.7 V, the XRD peaks of Ge can be clearly observed. Soon after discharging to 0.2 V, the XRD peaks of Ge are gradually replaced by the XRD peaks of LixGe. After further discharge to 0.01 V, the XRD peaks of the Li22Ge5 (Li4.4Ge) phase appear, which evidences that the large capacity of GeS comes from the contribution of both Ge and S. According to this, the electrochemical reaction mechanism between GeS and lithium ions is proposed by the following equations:
| 2Li+ + 2e− + GeS → Ge + Li2S | (1) |
| 4.4Li+ + 4.4e− + Ge → Li4.4Ge | (2) |
| In total: 6.4Li+ + 6.4e− + GeS → Li4.4Ge + Li2S | (3) |
If all the Ge and S atoms in the material can take part in the Li storage reaction as eqn (3), the theoretical capacity of GeS can be calculated to be 1635 mA h g−1, in which the S component contributes 501 mA h g−1 according to eqn (1) and the Ge component contributes the remaining capacity of 1134 mA h g−1 based on eqn (2). As obtained by the experimental electrochemical performance of GeS, the first charge capacity of GeS/C is 1663.6 mA h g−1, close to the theoretical value, suggesting a nearly 100% reaction efficiency of GeS for lithium storage as shown in eqn (3). It is generally considered that the first step of the conversion reaction (eqn (1)) is irreversible. However, the high capacity of GeS together with its ultrahigh first coulombic efficiency proves that it can deliver a high reaction reversibility for Li storage. This may be attributed to its unique layered structure which accounts for not only a low energy barrier for Li+ insertion but also feasible paths for Li+ diffusion, as predicted by the previous theoretical calculations.18–20
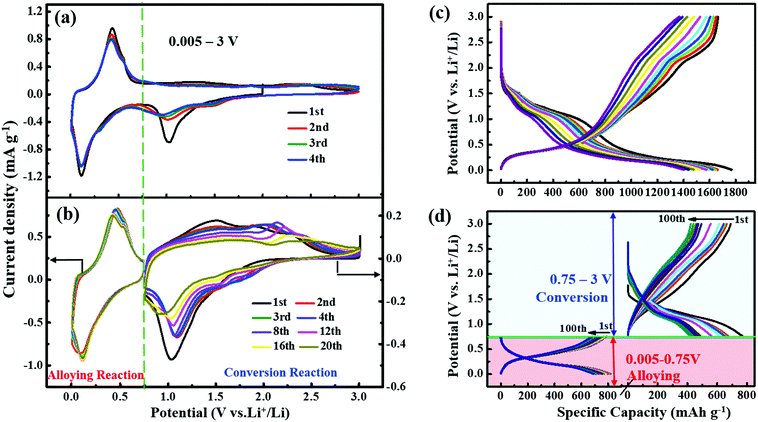
CV measurements on the GeS/C nanocomposite shown in Fig. 7a further confirm the above Li storage mechanism. There were two pairs of redox peaks over a voltage range of 0.005–3.0 V at a scanning rate of 0.1 mV s−1, corresponding to the conversion reaction and alloying reaction, respectively. The reduction peak at 1.02 V during the negative scan is related to the conversion reaction between Li and GeS to form Li2S as denoted in eqn (1). While the reduction peak at 0.13 V can be assigned to the further alloying of Li into Ge by forming Li22Ge5 (Li4.4Ge) as shown in eqn (2). According to the peak symmetry of positive and negative scans, the oxidation peaks at 0.44 V and 1.5 V can be assigned to the delithiation from Li4.4Ge and Li2S, respectively. It is noted that the cyclic voltammetry (CV) curves in Fig. 7b cycled with restriction in the alloying reaction region between 0.005–0.75 V show little changes in the curve shape and peak area even after 20 cycles, indicating a stable cycle stability of the alloying reaction. In comparison, when the CV measurement was controlled within the conversion region over the voltage range of 0.75–3.0 V, the reduction peak at about 1.02 V gradually shifts to a lower potential during 20 cycles, while the oxidation peak at about 1.5 V shifts to a higher potential. And both the peak intensity and peak area decay obviously upon the cycling process, suggesting a fast deterioration of the conversion reaction. Fig. 7c shows the discharge/charge profiles of GeS/C at the full discharge/charge depth between 0.005–3.0 V during 10 cycles. At a current density of 100 mA g−1, it can deliver a large discharge capacity of 1767.7 mA h g−1, 6 times higher than that of graphite.49 After 10 cycles, a specific capacity of 1403 mA h g−1 can still be obtained. From the discharge curves, it is observed that the loss of capacity mainly occurs at the first discharge plateau, which is associated with the deterioration of the conversion reaction. The corresponding Nyquist impedance plots after 10 cycles are shown in Fig. S3 (ESI†), which has a higher charge transfer resistance than the previous fresh cell. This can be attributed to the slower Li+ ion transfer rate and the deterioration of the reaction. Fig. 7d further presents the discharge/charge profiles of the GeS/C composite upon 100 cycles with the electrode reaction depth controlled at a conversion range of 0.75–3.0 V and an alloying range of 0.005–0.75 V. When cycled in the range of 0.005–0.75 V, the charge/discharge curves show an extremely superior stability, retaining a high capacity of 692 mA h g−1 after 100 cycles. It is worth mentioning that the discharge platform of the alloying reaction is 0.35 V. This value of 0.35 V is comparable to the potential (vs. Li+/Li) of Ge (∼0.45 V),14 Si (∼0.4 V),37,50 GeO2 (∼0.4 V),42 and GeS2 anodes (∼0.45 V),51 and lower than that of the Sn anode (∼0.6 V),39 suggesting its potential of high output voltage and energy density. Besides, 0.35 V is higher than the potential of graphite (∼0.05 V),48 which can avoid the formation of Li dendrites and improve the safety of LIBs. In comparison, the capacity of the conversion reaction over the voltage range of 0.75–3.0 V gradually decreases from 772 mA h g−1 at the first cycle to 469 mA h g−1 after 100 cycles. This capacity loss at the conversion reaction region well interprets the origin of the capacity decay in Fig. 7c at full charge/discharge depth over the voltage range of 0.005–3.0 V.
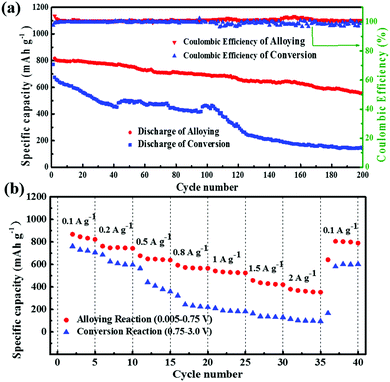
Fig. 8a shows the cycle performance of GeS/C controlled at different voltage ranges at a current density of 0.1 A g−1. When cycled at the alloying reaction region, it exhibits very stable reversible capacity with a high coulombic efficiency. After 200 cycles, the discharge capacity still remains at 557 mA h g−1, with a capacity retention of 70%. In comparison, only 150 mA h g−1 of the capacity can be retained after cycling for 200 cycles in the conversion reaction region, revealing the lower stability of the conversion reaction. The rate capabilities of GeS/C at different reaction regions from 0.1 A g−1 to 2 A g−1 are shown in Fig. 8b. The conversion reaction conducted at the voltage range of 0.75–3.0 V exhibits a dramatic decrease from 761 mA h g−1 to 115 mA h g−1 when the current density increased to 2 A g−1, revealing the poor rate performance of the conversion reaction. The possible reason is that Li2S produced by the conversion reaction suffers from polysulfide shuttling and low conductivity as well as the solubility problem.51 In contrast, the Li2S sheath may endow a synergistic effect with carbon to buffer the volume expansion of alloying, which will maintain the electrode integrity and improve the cycle stability and high rate performance of the alloying reaction.15,42,52 As shown in Fig. 8b, even at a high current density of 2 A g−1, a specific capacity of 420 mA h g−1 can still be obtained for the alloying reaction controlled at the voltage range of 0.005–0.75 V. When the current density is changed back to 100 mA g−1, the capacity recovers to 805 mA h g−1 again, revealing the high rate performance of the alloying reaction.
From Fig. 7d, it can be seen that when the electrode was controlled within the alloy reaction region, GeS/C can exhibit a charge platform of 0.35 V with a large reversible capacity of 790 mA h g−1 as well as superior cycle stability. These good performances promise the feasibility to design a full battery to further evaluate its practical uses.53,54Fig. 9a shows the charge/discharge profile of a full cell assembled by GeS/C as the anode and commercial LiCoO2 as the cathode at a current density of 100 mA g−1 over the voltage range of 2.5–4.3 V. The typical charge/discharge curves of commercial LiCoO2 are showed in Fig. S4 (ESI†), with a specific capacity of 157 mA h g−1. To better evaluate the performance of the anode in the full cell application, excessive cathode was used in the full cell. According to the specific capacity of the LiCoO2 cathode (157 mA h g−1) and the specific capacity of GeS within the alloying region (790 mA h g−1) in the half-cell, the mass ratio of 5.5![[thin space (1/6-em)]](https://www.rsc.org/images/entities/char_2009.gif) :
:![[thin space (1/6-em)]](https://www.rsc.org/images/entities/char_2009.gif) 1 of the LiCoO2 cathode to the GeS anode was used in the full cell assembly. As shown in Fig. 9a, the LiCoO2//GeS full cell delivers a flat voltage plateau with an unprecedented high capacity of 736 mA h g−1 based on the mass of anode, which is nearly close to the reversible capacity of the alloying reaction obtained in the half-cell. It suggests a high utilization efficiency of the alloying capacity of the anode when the cathode is sufficient. Besides, a discharge cell voltage plateau of 3.4 V and a charge platform of 3.7 V can be observed for the full cell, which is much higher than the reported cell voltages of full cells based on metal oxides/phosphide and insertion-type Ti-based anodes, e.g. 2.5 V for the Se4P4//Na3(VO0.5)2(PO4)2F2/C full cell,55 2.9 V for the LiFePO4//CuP2 full cell,21 2.8 V for the Na0.3MoO2//Na0.8Ni0.4Ti0.6O2 full cell56 or 2.86 V for the Na2Ti3O7//VOPO4 full cell.57 The dQ/dV curves of the LiCoO2//GeS full cell in Fig. 9c show a charge/discharge peak couple at 3.7 V and 3.4 V, corresponding well to the flat charge/discharge plateaus. Fig. 9b and d show the voltage curves of the LiCoO2 cathode and the GeS/C anode, respectively, both of which can keep a stable working potential range upon cycling in the charge/discharge process. The observed discharge voltage of the full cell is well referred to the difference between the discharge potential of the individual LiCoO2 cathode (3.85 V) and the charge potential of the individual GeS/C anode (0.35 V). With a large cell capacity, a high output voltage at 3.4 V as well as a flat charge/discharge plateau, the LiCoO2//GeS full cell can serve as a promising alternative for LIBs, especially in terms of high voltage and high capacity applications.
1 of the LiCoO2 cathode to the GeS anode was used in the full cell assembly. As shown in Fig. 9a, the LiCoO2//GeS full cell delivers a flat voltage plateau with an unprecedented high capacity of 736 mA h g−1 based on the mass of anode, which is nearly close to the reversible capacity of the alloying reaction obtained in the half-cell. It suggests a high utilization efficiency of the alloying capacity of the anode when the cathode is sufficient. Besides, a discharge cell voltage plateau of 3.4 V and a charge platform of 3.7 V can be observed for the full cell, which is much higher than the reported cell voltages of full cells based on metal oxides/phosphide and insertion-type Ti-based anodes, e.g. 2.5 V for the Se4P4//Na3(VO0.5)2(PO4)2F2/C full cell,55 2.9 V for the LiFePO4//CuP2 full cell,21 2.8 V for the Na0.3MoO2//Na0.8Ni0.4Ti0.6O2 full cell56 or 2.86 V for the Na2Ti3O7//VOPO4 full cell.57 The dQ/dV curves of the LiCoO2//GeS full cell in Fig. 9c show a charge/discharge peak couple at 3.7 V and 3.4 V, corresponding well to the flat charge/discharge plateaus. Fig. 9b and d show the voltage curves of the LiCoO2 cathode and the GeS/C anode, respectively, both of which can keep a stable working potential range upon cycling in the charge/discharge process. The observed discharge voltage of the full cell is well referred to the difference between the discharge potential of the individual LiCoO2 cathode (3.85 V) and the charge potential of the individual GeS/C anode (0.35 V). With a large cell capacity, a high output voltage at 3.4 V as well as a flat charge/discharge plateau, the LiCoO2//GeS full cell can serve as a promising alternative for LIBs, especially in terms of high voltage and high capacity applications.
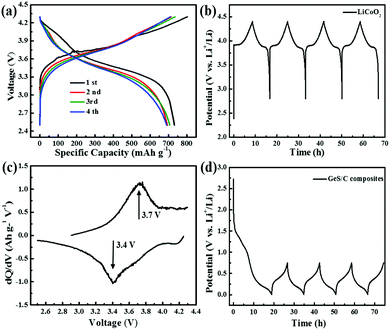 | ||
| Fig. 9 (a) The charge/discharge profiles and (c) the dQ/dV curves of LiCoO2//GeS full cells; (b and d) show the voltage curves of the LiCoO2 cathode and the GeS/C anode, respectively. | ||
Conclusions
In summary, we successfully synthesize pure GeS and GeS/C nanocomposites on a large scale through a simple, facile and controllable method of high-energy mechanical ball milling at ambient temperature and pressure for the first time. As an anode for LIBs, the GeS electrode delivers a discharge/charge capacity of 1675 and 1505 mA h g−1, and a high initial coulombic efficiency of 90%, but with fast deterioration of cycle stability. After being composited with carbon, the GeS/C nanocomposite shows much enhanced cycle stability with a high reversible capacity of 1780 mA h g−1 and a high initial coulombic efficiency of 94%, much larger than the reported data for Ge and graphite. This may be attributed to the effective combination between GeS and the carbon matrix in which carbon can buffer the volume changes, and the nanosized GeS particle can mitigate the structure stress during the insertion/retraction of Li ions. The ex situ XRD patterns and CV tests demonstrate that GeS undergoes firstly a conversion reaction followed by an alloying reaction. It is found that when the electrode was controlled within the alloy reaction region, GeS/C can demonstrate a large capacity and a low and safe voltage at 0.35 V, with a very stable cycle performance. Attributed to this superior performance, a full cell was further assembled by coupling LiCoO2 as the cathode and GeS as the anode. With a high output voltage at 3.4 V, the LiCoO2//GeS full cell delivers an unprecedented high capacity of 736 mA h g−1, which is nearly close to the reversible capacity of the alloying reaction obtained in the half-cell. It suggests a high utilization efficiency of the alloying reaction and a high potential of GeS in full-cell applications. The large capacity, high first coulombic efficiency, safe voltage, and excellent rate performance demonstrate that GeS is a promising anode material for next-generation, high-performance energy storage applications.Acknowledgements
We acknowledge the support from the National Nature Science Foundation of China (21571073), the Hubei Provincial Natural Science Foundation of China (2016CFA031), the Program for HUST Interdisciplinary Innovation Team (2015ZDTD038) and the Fundamental Research Funds for the Central University. We thank the Analytical and Testing Center of the Huazhong University of Science and Technology.Notes and references
- C. Tan and H. Zhang, Chem. Soc. Rev., 2015, 44, 2713–2731 RSC.
- M. Chhowalla, H. S. Shin, G. Eda, L. J. Li, K. P. Loh and H. Zhang, Nat. Chem., 2013, 5, 263–275 CrossRef PubMed.
- X. Cao, C. Tan, X. Zhang, W. Zhao and H. Zhang, Adv. Mater., 2016, 28, 6167–6196 CrossRef CAS PubMed.
- S. Zhou, J. Chen, L. Gan, Q. Zhang, Z. Zheng, H. Li and T. Zhai, Sci. Bull., 2016, 61, 227–235 CrossRef CAS.
- Z. Hu, L. Wang, K. Zhang, J. Wang, F. Cheng, Z. Tao and J. Chen, Angew. Chem., 2014, 126, 13008–13012 CrossRef.
- J. Wang, J. Liu, D. Chao, J. Yan, J. Lin and Z. X. Shen, Adv. Mater., 2014, 26, 7162–7169 CrossRef CAS PubMed.
- L. Zhang, H. B. Wu, Y. Yan, X. Wang and X. W. Lou, Energy Environ. Sci., 2014, 7, 3302–3306 CAS.
- W. Li, H. Li, Z. Lu, L. Gan, L. Ke, T. Zhai and H. Zhou, Energy Environ. Sci., 2015, 8, 3629–3636 CAS.
- S. Xu, C. M. Hessel, H. Ren, R. Yu, Q. Jin, M. Yang, H. Zhao and D. Wang, Energy Environ. Sci., 2014, 7, 632–637 CAS.
- S. Zhang, N. Wang, S. Liu, S. Huang, W. Zhou, B. Cai, M. Xie, Q. Yang, X. Chen and H. Zeng, Nanotechnology, 2016, 27, 274001 CrossRef PubMed.
- L. Huang, F. Wu and J. Li, J. Chem. Phys., 2016, 144, 114708 CrossRef PubMed.
- Z. Fang, Q. Wang, X. Wang, F. Fan, C. Wang and X. Zhang, Mater. Res. Bull., 2013, 48, 4935–4941 CrossRef CAS.
- D. D. Vaughn II, O. D. Hentz, S. Chen, D. Wang and R. E. Schaak, Chem. Commun., 2012, 48, 5608–5610 RSC.
- C. Yang, Y. Jiang, X. Liu, X. Zhong and Y. Yu, J. Mater. Chem. A, 2016, 4, 18711–18716 CAS.
- J. Zhang, H. Ren, J. Wang, J. Qi, R. Yu, D. Wang and Y. Liu, J. Mater. Chem. A, 2016, 4, 17673–17677 CAS.
- A. A. Khan, I. Khan, I. Ahmad and Z. Ali, Mater. Sci. Semicond. Process., 2016, 48, 85–94 CrossRef.
- J. Chao, Z. Wang, X. Xu, Q. Xiang, W. Song, G. Chen, J. Hu and D. Chen, RSC Adv., 2013, 3, 2746–2753 RSC.
- G.-K. Sung and C.-M. Park, J. Mater. Chem. A, 2017, 5, 5685–5689 CAS.
- F. Li, Y. Qu and M. Zhao, J. Mater. Chem. A, 2016, 4, 8905–8912 CAS.
- Y. Zhou, J. Mater. Chem. A, 2016, 4, 10906–10913 CAS.
- S. Karmakar, C. Chowdhury and A. Datta, J. Phys. Chem. C, 2016, 120, 14522–14530 CAS.
- X. Zhou, Q. Zhang, L. Gan, H. Li, J. Xiong and T. Zhai, Adv. Sci., 2016, 3, 1600177 CrossRef PubMed.
- G. Qin, Z. Qin, W. Z. Fang, L. C. Zhang, S. Y. Yue, Q. B. Yan, M. Hu and G. Su, Nanoscale, 2016, 8, 11306–11319 RSC.
- M. Wu and X. C. Zeng, Nano Lett., 2016, 16, 3236–3241 CrossRef CAS PubMed.
- P. Ramasamy, D. Kwak, D.-H. Lim, H.-S. Ra and J.-S. Lee, J. Mater. Chem. C, 2016, 4, 479–485 RSC.
- M. Nath, A. Choudhury and C. N. Rao, Chem. Commun., 2004, 2698–2699 RSC.
- C. Li, L. Huang, G. P. Snigdha, Y. Yu and L. Cao, ACS Nano, 2016, 6, 8868–8877 CrossRef PubMed.
- J. Gao, L. Li, J. Tan, H. Sun, B. Li, J. C. Idrobo, C. V. Singh, T. M. Lu and N. Koratkar, Nano Lett., 2016, 16, 3780–3787 CrossRef CAS PubMed.
- R. K. Ulaganathan, Y. Y. Lu, C. J. Kuo, S. R. Tamalampudi, R. Sankar, K. M. Boopathi, A. Anand, K. Yadav, R. J. Mathew, C. R. Liu, F. C. Chou and Y. T. Chen, Nanoscale, 2016, 8, 2284–2292 RSC.
- C. Lan, C. Li, Y. Yin, H. Guo and S. Wang, J. Mater. Chem. C, 2015, 3, 8074–8079 RSC.
- D. D. Vaughn II, R. J. Patel, M. A. Hickner and R. E. Schaak, J. Am. Chem. Soc., 2010, 132, 15170–15172 CrossRef PubMed.
- J. Wang, N. Yang, H. Tang, Z. Dong, Q. Jin, M. Yang, D. Kisailus, H. Zhao, Z. Tang and D. Wang, Angew. Chem., Int. Ed., 2013, 52, 6417–6420 CrossRef CAS PubMed.
- Y. J. Cho, H. S. Im, Y. Myung, C. H. Kim, H. S. Kim, S. H. Back, Y. R. Lim, C. S. Jung, D. M. Jang, J. Park, E. H. Cha, S. H. Choo, M. S. Song and W. I. Cho, Chem. Commun., 2013, 49, 4661–4663 RSC.
- H. Li, H. Ma, M. Yang, B. Wang, H. Shao, L. Wang, R. Yu and D. Wang, Mater. Res. Bull., 2017, 87, 224–229 CrossRef CAS.
- H. Ren, J. Sun, R. Yu, M. Yang, L. Gu, P. Liu, H. Zhao, D. Kisailus and D. Wang, Chem. Sci., 2016, 7, 793–798 RSC.
- H. Ren, R. Yu, J. Wang, Q. Jin, M. Yang, D. Mao, D. Kisailus, H. Zhao and D. Wang, Nano Lett., 2014, 14, 6679–6684 CrossRef CAS PubMed.
- W. Li, X. Sun and Y. Yu, Small Methods, 2017, 1, 1600037 CrossRef.
- J. D. Wiley, W. J. Buckel and R. L. Schmidt, Phys. Rev. B: Solid State, 1976, 13, 2489–2496 CrossRef CAS.
- K. Li, S. Yan, Z. Lin and Y. Shi, J. Alloys Compd., 2016, 681, 486–491 CrossRef CAS.
- F. Zhang, C. Xia, J. Zhu, B. Ahmed, H. Liang, D. B. Velusamy, U. Schwingenschlögl and H. N. Alshareef, Adv. Energy Mater., 2016, 6, 1601188 CrossRef.
- R. B. Shalvoy, G. B. Fisher and P. J. Stiles, Phys. Rev. B: Solid State, 1977, 15, 1680–1697 CrossRef CAS.
- Y. Kim, H. Hwang, K. Lawler, S. W. Martin and J. Cho, Electrochim. Acta, 2008, 53, 5058–5064 CrossRef CAS.
- D. J. Xue, S. Xin, Y. Yan, K. C. Jiang, Y. X. Yin, Y. G. Guo and L. J. Wan, J. Am. Chem. Soc., 2012, 134, 2512–2515 CrossRef CAS PubMed.
- X. Zhou, Y.-X. Yin, L.-J. Wan and Y.-G. Guo, Adv. Energy Mater., 2012, 2, 1086–1090 CrossRef CAS.
- F. Wang, J. Wang, H. Ren, H. Tang, R. Yu and D. Wang, Inorg. Chem. Front., 2016, 3, 365–369 RSC.
- J. Wang, H. Tang, H. Wang, R. Yu and D. Wang, Mater. Chem. Front., 2017, 1, 414–430 RSC.
- Z. Yu, J. Song, M. L. Gordin, R. Yi, D. Tang and D. Wang, Adv. Sci., 2015, 2, 1400020 CrossRef PubMed.
- Y. Saito, X. Luo, C. Zhao, W. Pan, C. Chen, J. Gong, H. Matsumoto, J. Yao and H. Wu, Adv. Funct. Mater., 2015, 25, 5683–5690 CrossRef CAS.
- S. Liu, J. Feng, X. Bian, Y. Qian, J. Liu and H. Xu, Nano Energy, 2015, 13, 651–657 CrossRef CAS.
- J. Lang, B. Ding, T. Zhu, H. Su, H. Luo, L. Qi, K. Liu, K. Wang, N. Hussain, C. Zhao, X. Li, H. Gao and H. Wu, Adv. Mater., 2016, 28, 10236–10243 CrossRef CAS PubMed.
- G. K. Sung, K. J. Jeon and C. M. Park, ACS Appl. Mater. Interfaces, 2016, 8, 29543–29550 CAS.
- Z. Li, J. Ding and D. Mitlin, Acc. Chem. Res., 2015, 48, 1657–1665 CrossRef CAS PubMed.
- G. A. Li, C. Y. Wang, W. C. Chang and H. Y. Tuan, ACS Nano, 2016, 10, 8632–8644 CrossRef CAS PubMed.
- J. Wang, H. Tang, L. Zhang, H. Ren, R. Yu, Q. Jin, J. Qi, D. Mao, M. Yang, P. Liu, Y. Zhang, Y. Wen, L. Gu, G. Ma, Z. Tang, H. Zhao and D. Wang, Nat. Energy, 2016, 1, 16050 CrossRef CAS.
- Y. Lu, P. Zhou, K. Lei, Q. Zhao, Z. Tao and J. Chen, Adv. Energy Mater., 2016, 10, 1601973 Search PubMed.
- K. Zhu, S. Guo, J. Yi, S. Bai, Y. Wei, G. Chen and H. Zhou, J. Mater. Chem. A, 2015, 3, 22012–22016 CAS.
- H. Li, L. Peng, Y. Zhu, D. Chen, X. Zhang and G. Yu, Energy Environ. Sci., 2016, 9, 3399–3405 CAS.
Footnote |
| † Electronic supplementary information (ESI) available: Raman, EDS, and impedance spectra of GeS and GeS/C. See DOI: 10.1039/c7qm00060j |
| This journal is © the Partner Organisations 2017 |

