Nanoparticles of a Pt3Ni alloy on reduced graphene oxide (RGO) as an oxygen electrode catalyst in a rechargeable Li–O2 battery†
Surender
Kumar
 * and
N.
Munichandraiah
Department of Inorganic and Physical Chemistry, Indian Institute of Science, Bangalore, India. E-mail: surenderjanagal@gmail.com
First published on 1st December 2016
Abstract
Nanoparticles of a Pt3Ni alloy distributed on graphene sheets are studied as a catalyst for the oxygen reduction reaction in non-aqueous Li–O2 cells. The preparation involves simultaneous reduction of graphene oxide and Pt4+ and Ni2+ ions by hydrazine in an ethylene glycol medium. Pt nanoparticles are also prepared separately on reduced graphene oxide (RGO) sheets (Pt–RGO) in addition to Pt3Ni–RGO for studies of comparison. Samples are characterized with various physicochemical techniques. The oxygen reduction reaction (ORR) is studied in a non-aqueous electrolyte by using cyclic voltammetry and rotating disk electrode (RDE) techniques. Pt3Ni–RGO exhibits greater catalytic activity for the ORR when compared with Pt–RGO. O2 reduction follows a one e− pathway (O2 + e− = O2−) in a non-aqueous electrolyte. The catalytic performances of the samples are investigated in non-aqueous Li–O2 cells. The discharge plateau appears at 2.86 V with the Pt3Ni–RGO catalyst at 0.10 mA cm−2 current density, which is close to the theoretical value of 2.96 V. The overpotential of charging is lower with Pt3Ni–RGO, in comparison to that of Pt–RGO.
1. Introduction
The oxygen reduction reaction (ORR) is one of the most important reactions, useful in metal–air batteries, such as the Li–air system, where O2 present in the atmosphere undergoes reduction at the cathode during discharge.1 The Li–air battery has a high theoretical specific energy (11.68 kW h kg−1). In rechargeable Li–air batteries, both the ORR and the oxygen evolution reaction (OER) are expected to take place reversibly. In order to realize the ORR and the OER with fast kinetics, a suitable catalyst is essential.1,2Platinum is known as the most appropriate catalyst for the ORR in aqueous electrolytes. However, Pt resources are limited.3,4 So there is a need to reduce the amount of Pt by various synthesis strategies. The amount of Pt in a catalyst can be reduced by forming alloys with various metals such as Ir, V, Cr, Ni, Co, Fe and Mn.5,6 The ORR activity of Pt-based alloys is greater compared to that of pure Pt.7–9 Alloys of Pt such as PtV, PtCr, Pt3Ni, Pt3Co and Pt3Fe have been reported.10–16 The greater activity of these alloys for the ORR compared to Pt is due to changes in the electronic structure of the Pt 5d-orbital that occur upon alloying. Stamenkovic et al.17 reported DFT calculations, which showed that the ORR activity of Pt3Ni in aqueous electrolytes is 10-fold greater than that of the corresponding Pt(111) surface. Zhang et al.18 reported the effect of acid treatment on the catalytic activity of Pt3Nix@graphene alloys. Lima et al.19 prepared Pt3Ni and Pt3Co and studied the ORR in an alkaline medium. It was confirmed that Pt based alloys catalyze the ORR in a 4-electron reduction pathway. Xu et al.20 prepared Pt3Ni alloys by an ethylene glycol assisted synthetic route and showed that Pt3Ni/C is 8.4 times more active than Pt/C in 0.5 M H2SO4. The ORR is extensively studied with various core–shell type Pt–Fe, PtNi and Pt–Co–Ni catalysts on carbon nitride in acidic electrolytes, in view of its applications in fuel cells.21–23
In the present work, Pt3Ni porous particles are synthesized on RGO nanosheets by the in situ reduction of graphene oxide (GO) and the corresponding metal ions using hydrazine in an ethylene glycol (EG) medium, for the first time. RGO nanosheets are used as a support for the nanoparticles for synthesis, instead of KB-carbon. In addition to the Pt3Ni alloy, Pt nanoparticles are prepared on RGO sheets and characterized for the purpose of comparison. Pt3Ni–RGO and Pt–RGO are studied as catalysts for the ORR in non-aqueous electrolytes. Li–O2 cells are assembled and studied for charge–discharge cycling.
2. Experimental
Graphite powder was oxidized to graphite oxide in concentrated H2SO4 containing NaNO3 and KMnO4 and then exfoliated to graphene oxide (GO) by sonication.24 The procedure for the preparation of Pt3Ni particles anchored on RGO nanosheets is as follows: 100 mg GO, 5 mM H2PtCl6 (188 mg), and 101 mg NiCl2·6H2O were dispersed in 150 mL ethylene glycol by ultrasonication for 30 min. Subsequently, under N2 protection, the obtained yellow dispersion was heated to 110 °C, and 25 mL hydrazine hydrate with 1 g of dissolved NaOH was slowly added into the mixture. The mixture was then refluxed at 110 °C for 1 h. After natural cooling of the flask, the product, Pt3Ni decorated RGO, was separated by centrifugation, washed with double distilled water and ethanol, and dried at 60 °C for 12 h. Hydrazine hydrate is a mild reducing agent. This reduction process is used to give rise to a slow process using a mild reducing agent, which is why the reduction product is alloyed Pt3Ni rather than separated Pt and Ni nanoparticles. We did not get alloy formation with NaBH4, a strong reducing agent. For the preparation of Pt–RGO, the procedure was the same except that the corresponding metal salt was taken as a precursor. The synthesis procedure was repeated three times to confirm the reproducibility of the synthesis method. The amount of Pt present in Pt3Ni was evaluated by ICP-OES and the results show 74 wt% of Pt in Pt3Ni, which closely matches the theoretical value (75 wt%). The procedure for the electrode preparation for the RDE and Li–O2 cell studies has already been reported in our previous report.243. Results and discussion
3.1. XRD and microscopy studies
Powder XRD patterns of Pt–RGO and Pt3Ni–RGO are shown in Fig. 1a. The XRD pattern of Pt–RGO (Fig. 1a, curve i) is characterized by reflections at 40.0, 46.2 and 67.8° which are indexed as the (111), (200) and (220) planes of an fcc structure (JCPDS 04-0802). The lattice parameter calculated from the (111) peak is 4.010 Å. The XRD pattern of the Pt3Ni alloy particles is similar to the pattern of Pt, but with a small increase in the positions of the (111), (200) and (220) peaks (Fig. 1b). The shift in peak positions indicates the formation of an alloy instead of separate phases of Pt and Ni.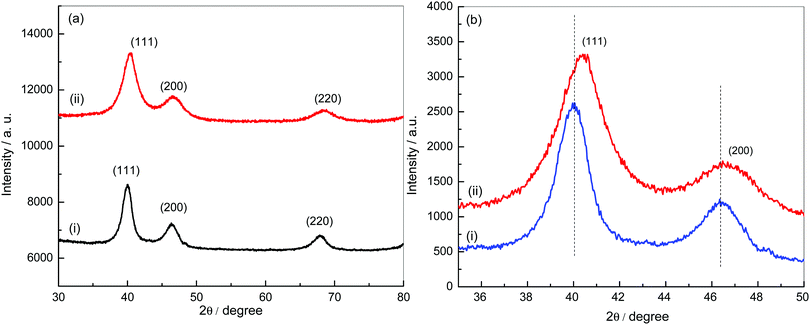 | ||
| Fig. 1 (a) XRD patterns of Pt–RGO (i) and Pt3Ni–RGO (ii), and (b) comparison of the XRD patterns of Pt–RGO (i) and Pt3Ni–RGO (ii) in the 2θ range 35–50°. | ||
The lattice parameter calculated using the (111) peak of Pt3Ni (3.889 Å) is between the values of the lattice parameters of Pt and Ni. These results confirm the formation of a Pt3Ni alloy on RGO sheets. The crystallite size calculated from the Pt3Ni (111) reflection using Scherrer's formula is 112 nm.
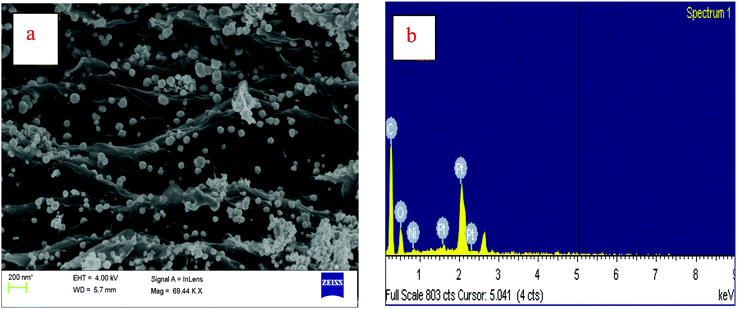
An SEM image of Pt3Ni–RGO is presented in Fig. 2a. The SEM image indicates the layer morphology of the RGO sheets. The layers of RGO and the distribution of the Pt3Ni nanoparticles on the RGO sheets are clearly seen. The size of the nanoparticles varies over a wide range. The range of particle sizes of Pt3Ni is 30–140 nm. The preparation of these nanoparticles involves the simultaneous reduction of metal ions and graphene oxide by hydrazine in an ethylene glycol medium. It is interesting to note that the nanoparticles are anchored over the sheets of RGO, instead of existing as a separate phase. The difference in shape and distribution is attributed to the different reducing agents used for the preparation of these nanoparticles anchored onto RGO. An SEM image of Pt–RGO is given in the ESI.† The images of Pt–RGO resemble those of Pt3Ni–RGO and the metallic particles are porous. The EDAX spectrum of Pt3Ni–RGO is presented in Fig. 2b and signals corresponding to C, O, Ni and Pt are identified. From the peak ratio, the atomic ratio of Pt/Ni is found to be 2.96, which is close to the expected composition of Pt3Ni.
3.2. Electrochemistry of Pt3Ni–RGO in 0.1 M TBAP–DMSO electrolyte
Cyclic voltammograms of a Pt3Ni–RGO coated GC electrode were recorded in O2/N2 gas saturated electrolyte, 0.1 M TBAP–DMSO electrolyte (Fig. 3a). When scanned from −0.233 V to −2.000 V, at 10 mV s−1 there is a cathodic current peak at −1.04 V, which is attributed to the reduction of O2. In the reverse direction, there is an anodic current peak, which is due to the oxidation of the discharge products (Li2O and Li2O2) formed during the forward sweep.25,26 There is an increase in peak currents when increasing the sweep rate (Fig. 3b). The increase in peak current with an increase in the square root of the sweep rate (Fig. S4, ESI†) suggests that the reactions follow the Randles–Sevcik equation (eqn (1)).27| ipc = (2.69 × 10⁵)n3/2D1/2ν1/2C0 | (1) |
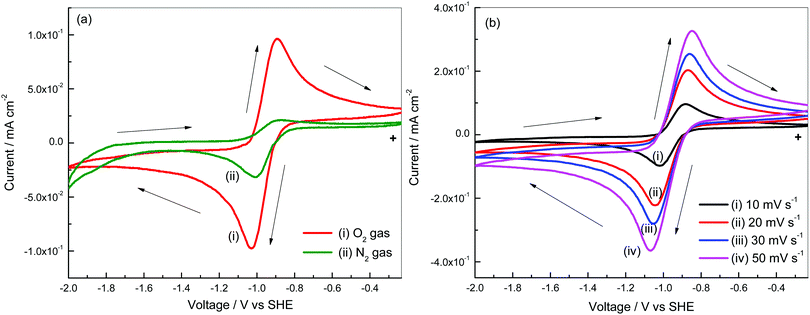 | ||
| Fig. 3 (a) Cyclic voltammograms of Pt3Ni–RGO in 0.1 M TBAP–DMSO with and without O2 gas, and (b) cyclic voltammograms of Pt3Ni–RGO at various scan rates. | ||
The number of electrons involved in oxygen reduction, calculated from a Randles–Sevcik plot (Fig. S4, ESI†), is 0.9. Oxygen (O2) gains one electron and forms the superoxide (O2−) ion in the presence of the tetrabutyl ammonium (TBA+) ion. The formation of TBAO2 is due to reduction of O2 in the non-aqueous electrolyte in the forward sweep and the subsequent oxidation of TBAO2 in the reverse sweep.
Linear sweep voltammograms of a Pt3Ni–RGO coated GC RDE electrode recorded in an O2 saturated 0.1 M TBAP–DMSO solution at several speeds are presented in Fig. 4a. The data presented in Fig. 4a suggest that the limiting current is a steady value between −1.20 and −2.05 V at low rpm values of the RDE. The diffusion-limited steady current density (iL) is related to the velocity of the RDE (ω = 2πf, f being the frequency in revolutions per second) by the Levich equation (eqn (2)):27
| iL = 0.62nFD2/3η−1/6C0ω1/2 | (2) |
 | (3) |
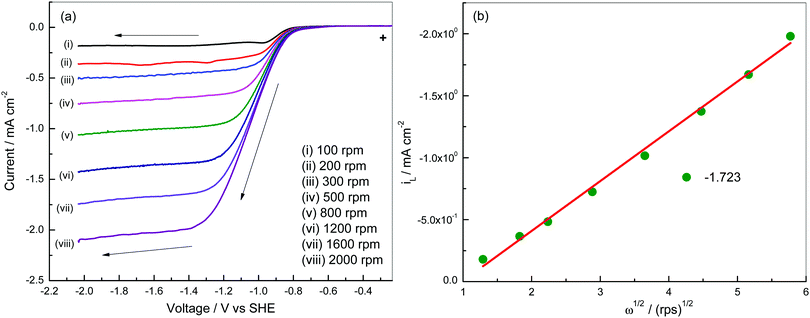 | ||
| Fig. 4 (a) Linear sweep voltammetry of a Pt3Ni–RGO coated GC electrode at 10 mV s−1 in O2 gas saturated 0.1 M TBAP–DMSO electrolyte at various speeds and (b) Levich plot at −1.723 V. | ||
3.3. Comparison of the catalytic activity of Pt–RGO and Pt3Ni–RGO
Cyclic voltammetry and RDE studies of Pt–RGO are presented in the ESI† (Fig. S7 and S8). A comparison of the two catalysts is discussed below. Cyclic voltammograms of the Pt–RGO and Pt3Ni–RGO catalysts are shown in Fig. 5a for the purpose of comparison. The cathodic peak potentials are −0.92 and −0.91 V, respectively, on Pt–RGO and Pt3Ni–RGO. The cathodic peak potentials and also the cathodic peak current are nearly similar for the two catalysts. The oxidation peak potentials are also similar. The anodic peak currents are smaller for the Pt–RGO electrodes compared to those of the Pt3Ni–RGO electrode.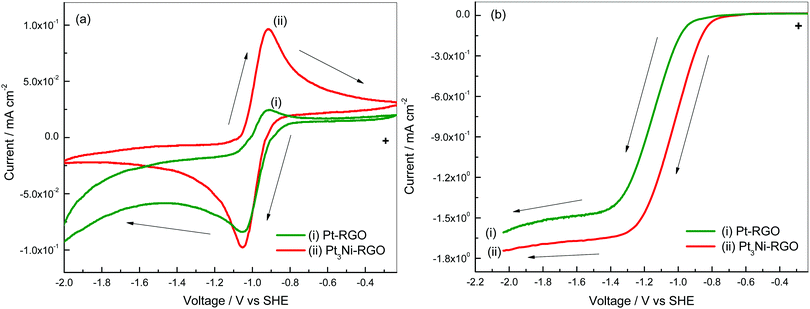 | ||
| Fig. 5 (a) Cyclic voltammograms at 10 mV s−1 and (b) linear sweep voltammograms at a rotation speed of 1600 rpm of Pt–RGO (i) and Pt3Ni–RGO (ii) in O2 saturated 0.1 M TBAP–DMSO. | ||
Interestingly, the anodic peak current of Pt3Ni–RGO is nearly equal to the cathodic peak current, thus indicating a high degree of reversibility. The peak potential separation is 130 mV at 10 mV s−1 (Fig. 5a). The anodic and cathodic currents are different because of the differences in the kinetics of the ORR and the OER on Pt3Ni–RGO and Pt–RGO.
The linear sweep voltammograms of the two catalysts are compared at 1600 rpm as shown in Fig. 5b. The limiting current density is highest for Pt3Ni–RGO. These studies indicate that Pt3Ni–RGO has greater catalytic activity than Pt–RGO.
It is known that the catalytic activity of Pt alloys towards the ORR is superior in comparison with Pt. The factors that influence the kinetics of the ORR on a Pt alloy include changes in the Pt–Pt bond distance, the number of Pt nearest neighbours, the electron density of states in the Pt 5d band, the nature and coverage of the surface oxide layers, etc.19 It has been theoretically shown that the catalytic activity of the metals can be rationalized in terms of the d-band center.28 The calculations were based on a general principle of chemical bond formation at a surface, such that a strong bond occurs when its antibonding states are shifted up through the Fermi level, and the opposite occurs if they are shifted down. The position of the d-band center for Pt monolayers depends on the strain and also on the electronic interaction between the Pt monolayer and its substrate. These factors cause variation in the d-band broadness, leading to a shift of the d-band center. It has also been demonstrated that variation of the d-band center can occur by alloying two or more metals, or in surface segregated phases of a given metal on metal nanoparticles. It has been shown for the ORR that a downshift of the d-band center is conducive to the formation of occupied antibonding orbitals. This phenomenon results in weaker Pt–O adsorption.29 As the first step in the mechanism is adsorption of O2, a low energy of adsorption facilitates faster kinetics of the ORR. Thus, the Pt3Ni–RGO catalyst exhibits superior ORR and also OER kinetics as reported above in comparison to Pt–RGO catalyst.
3.4. Li–O2 cells with Pt–RGO and Pt3Ni–RGO catalysts
Li–O2 cells were assembled and subjected to charge–discharge cycling (Fig. 6). The discharge capacity values with Pt3Ni–RGO and Pt–RGO are 14![[thin space (1/6-em)]](https://www.rsc.org/images/entities/char_2009.gif) 091 and 11
091 and 11![[thin space (1/6-em)]](https://www.rsc.org/images/entities/char_2009.gif) 518 mA h g−1, respectively at 0.1 mA cm−2 (Fig. 6a). The potential difference between charge and discharge is 1.46 and 1.79 V for Pt3Ni–RGO and Pt–RGO, respectively at 0.1 mA cm−2 (Fig. 6a). Ideally charge–discharge should occur at the theoretical value of 2.96 V. The discharge plateau appears at 2.86 V in Pt3Ni–RGO at 0.1 mA cm−2 (Fig. 6a); the discharging potential is nearly equal to the theoretical value of 2.96 V.
518 mA h g−1, respectively at 0.1 mA cm−2 (Fig. 6a). The potential difference between charge and discharge is 1.46 and 1.79 V for Pt3Ni–RGO and Pt–RGO, respectively at 0.1 mA cm−2 (Fig. 6a). Ideally charge–discharge should occur at the theoretical value of 2.96 V. The discharge plateau appears at 2.86 V in Pt3Ni–RGO at 0.1 mA cm−2 (Fig. 6a); the discharging potential is nearly equal to the theoretical value of 2.96 V.
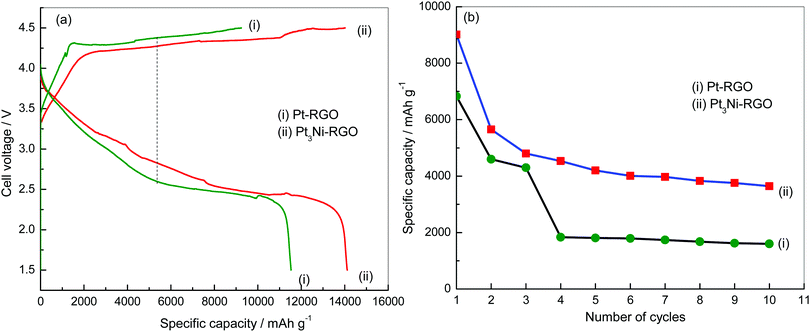 | ||
| Fig. 6 (a) Charge–discharge curves of Li–O2 cells at 0.1 mA cm−2 and (b) cycle-life tests of Li–O2 cells at 0.3 mA cm−2. | ||
The overpotential for discharge was 100 mV in the case of the Pt3Ni–RGO catalyst. The overpotential value was very low compared to reported catalysts.30–32 The discharging overpotential was more than 500 mV in the case of Pt–RGO (Fig. 6a). The results show that the potential difference between charge–discharge was less and that the specific capacity was more in the case of Pt3Ni–RGO, compared to the results for Pt–RGO. The results of the cycle-life test are shown in Fig. 6b. The discharge capacity values up to the 10th cycle are compared at 0.3 mA cm−2 for the Pt–RGO and Pt3Ni–RGO catalysts. These results also confirm that the Pt3Ni–RGO catalyst is better than the Pt–RGO catalyst.
4. Conclusions
Nanoparticles of Pt and Pt3Ni were prepared on reduced graphene oxide sheets and their physicochemical and electrochemical properties were studied. The oxygen reduction reaction (ORR) was studied in a non-aqueous electrolyte by the use of cyclic voltammetry and rotating disk electrode (RDE) techniques. The results indicate that Pt3Ni–RGO exhibits superior catalytic activity towards the reversible O2 electrode reaction in a non-aqueous electrolyte and also in Li–O2 cells. The catalysts are compared for use in a non-aqueous Li–O2 cell in the below table.| Catalyst | Discharge capacity/mA h g−1 | Overpotential/mV | Voltage gap/V |
|---|---|---|---|
| Pt–RGO | 11![[thin space (1/6-em)]](https://www.rsc.org/images/entities/char_2009.gif) 518 518 |
350 | 1.79 |
| Pt3Ni–RGO | 14![[thin space (1/6-em)]](https://www.rsc.org/images/entities/char_2009.gif) 091 091 |
100 | 1.46 |
References
- M. K. Debe, Nature, 2012, 486, 43–51 CrossRef CAS PubMed.
- J. S. Lee, S. T. Kim, R. Cao, N. S. Choi, M. Liu, K. T. Lee and J. Chao, Adv. Energy Mater., 2011, 1, 34–50 CrossRef CAS.
- K. B. Liew, W. R. W. Daud, M. Ghasemi, J. X. Leong, S. S. Lim and M. Ismail, Int. J. Hydrogen Energy, 2014, 39, 4870–4883 CrossRef.
- K. Sopian and W. R. W. Daud, Renewable Energy, 2006, 31, 719–727 CrossRef CAS.
- V. R. Stamenkovic, B. S. Mun, M. Arenz, K. J. J. Mayrhofer, C. A. Lucas, G. Wang, P. N. Ross and N. M. Markovic, Nat. Mater., 2007, 6, 241–247 CrossRef CAS PubMed.
- T. Ghosh, B. M. Leonard, Q. Zhou and F. J. DiSalvo, Chem. Mater., 2010, 22, 2190–2202 CrossRef CAS.
- T. Toda, H. Igarashi, H. Uchida and M. Watanabe, J. Electrochem. Soc., 1999, 146, 3750–3756 CrossRef CAS.
- S. Mukerjee, S. Srinivasan and M. P. Soriaga, J. Electrochem. Soc., 1995, 142, 1409–1422 CrossRef CAS.
- V. R. Stamenkovic, B. S. Mun, K. J. J. Mayrhofer, P. N. Ross, N. M. Markovic, J. Rossmeisl, J. Greeley and J. K. Norskov, Angew. Chem., Int. Ed., 2006, 45, 2897–2901 CrossRef CAS PubMed.
- M. K. Jeon and P. J. McGinn, Electrochim. Acta, 2012, 64, 147–153 CrossRef CAS.
- M. K. Jeon, Y. Zhang and P. J. McGinn, Electrochim. Acta, 2010, 55, 5318–5325 CrossRef CAS.
- M. C. S. Escano and H. Kasai, J. Power Sources, 2014, 247, 562–571 CrossRef.
- N. Jin, J. Han, H. Wang, X. Zhu and Q. Ge, Int. J. Hydrogen Energy, 2015, 40, 5126–5134 CrossRef CAS.
- J. Luoa, N. Kariuki, L. Hana, L. Wang, C. J. Zhonga and T. Heb, Electrochim. Acta, 2006, 51, 4821–4827 CrossRef.
- T. Jacob and W. A. Goddard III, ChemPhysChem, 2006, 7, 992–1005 CrossRef CAS PubMed.
- A. Politano, M. Caputo, A. Goldoni, P. Torelli and G. Chiarello, J. Phys. Chem. C, 2013, 117, 27007–27011 CrossRef CAS.
- V. R. Stamenkovic, B. Fowler, B. S. Mun, G. Wang, P. N. Ross, C. A. Lucas and N. M. Markovic, Science, 2007, 315, 493–497 CrossRef CAS PubMed.
- K. Zhang, Q. Yue, G. Chen, Y. Zhai, L. Wang, H. Wang, J. Zhao, J. Liu, J. Jia and H. Li, J. Phys. Chem. C, 2011, 115, 379–389 CrossRef CAS.
- F. H. B. Lima, J. R. C. Salgado, E. R. Gonzalez and E. A. Ticianelli, J. Electrochem. Soc., 2007, 154, A369–A375 CrossRef CAS.
- Y. Xu, S. Hou, Y. Liu, Y. Zhang, H. Wang and B. Zhang, Chem. Commun., 2012, 48, 2665–2667 RSC.
- S. Diodati, E. Negro, K. Vezzu, V. Di Noto and S. Gross, Electrochim. Acta, 2016, 215, 398–409 CrossRef CAS.
- E. Negro, K. Vezz, F. Bertasi, P. Schiavuta, L. Toniolo, S. Polizzi and V. Di Noto, ChemElectroChem, 2014, 1, 1359–1369 CrossRef CAS.
- E. Negro, S. Polizzi, K. Vezzu, L. Toniolo, G. Cavinato and V. Di Noto, Int. J. Hydrogen Energy, 2014, 39, 2828–2841 CrossRef CAS.
- S. Kumar, C. Selvaraj, L. G. Scanlon and N. Munichandraiah, Phys. Chem. Chem. Phys., 2014, 16, 22830–22840 RSC.
- S. Kumar, C. Selvaraj, N. Munichandraiah and L. G. Scanlon, RSC Adv., 2013, 3, 21706–21714 RSC.
- S. Kumar, S. Chinnathambi and N. Munichandraiah, New J. Chem., 2015, 39, 7066–7075 RSC.
- A. J. Bard and L. R. Faulkner, Electrochemical methods: Fundamental and Application, John Wiley and Sons, 1980, pp. 1–100 Search PubMed.
- J. R. Kitchin, J. K. Norskov, M. A. Barteau and J. G. Chen, J. Chem. Phys., 2004, 120, 10240–10246 CrossRef CAS PubMed.
- T. Toda, H. Igarashi and M. Watanabe, J. Electroanal. Chem., 1999, 460, 258–262 CrossRef CAS.
- C. Selvaraj, S. Kumar, N. Munichandraiah and L. G. Scanlon, J. Electrochem. Soc., 2014, 161, A554–A560 CrossRef CAS.
- Y. Yang, M. Shi, Q.-F. Zhou, Y.-S. Li and Z.-W. Fu, Electrochem. Commun., 2012, 20, 11–14 CrossRef CAS.
- S. Kumar and N. Munichandraiah, Catal. Sci. Technol., 2016, 6, 6716–6725 Search PubMed.
Footnote |
| † Electronic supplementary information (ESI) available. See DOI: 10.1039/c6qm00260a |
| This journal is © the Partner Organisations 2017 |

