A high-performance supercapacitor based on activated carbon fibers with an optimized pore structure and oxygen-containing functional groups†
Kai
Zhu
a,
Yu
Wang
a,
Joel A.
Tang
b,
Shaohua
Guo
c,
Zhongmin
Gao
a,
Yingjin
Wei
a,
Gang
Chen
ad and
Yu
Gao
*a
aKey Laboratory of Physics and Technology for Advanced Batteries, Ministry of Education, College of Physics, Jilin University, Changchun 130012, P. R. China. E-mail: yugao@jlu.edu.cn
bDepartment of Chemistry, Johns Hopkins University, Baltimore MD, 21218, USA
cGraduate School of System and Information Engineering, University of Tsukuba, Tennoudai 1-1-1, Tsukuba, 305-8573, Japan
dState Key Laboratory of Superhard Materials, Jilin University, Changchun 130012, P. R. China
First published on 14th December 2016
Abstract
Low-cost activated carbon fibers (ACFs) were prepared from polyacrylonitrile-based precursor fibers abandoned by local factories via carbonization and CO2 activation. Oxygen-containing functional groups were introduced on the ACF surface via nitric acid and thermal treatment. ACFs with optimized pore structures and oxygen-containing functional groups display a remarkable capacitance of 214 F g−1 at a current density of 0.5 mA cm−2 and present an excellent cycling performance with a capacity retention of almost 100% over 3000 cycles. Moreover, the rate capability gains a significant improvement due to the existence of functional groups. The superb electrochemical performance of these materials provides a template of how to better engineer the ACFs' pore architecture and surface modifications to design enhanced electrode materials for high-performance supercapacitors.
Introduction
In recent decades, global warming and environmental pollution have prompted people to shift from traditional fossil fuel based energy resources to green and sustainable resources, such as wind or solar.1–3 For these renewable and environment-friendly energy resources, a capable energy storage system is extremely important to meet the requirements of a smart grid management system.2,4 Generally, energy storage is dominated by rechargeable batteries.2 However, their rapid capacity reduction, short lifespan, and low power density make it difficult to satisfy the needs of a large-scale energy storage system with a long cycle life and high power density. Supercapacitors fabricated based on a double-layer mechanism present unique advantages, such as outstanding cycling stability, long cycle life and a high power density.5–8 Hence, they have become promising and competitive candidates for a large-scale energy storage system.For double-layer capacitors, carbon materials such as activated carbon, carbon nanotubes and graphene are considered as favorable electrode materials due to their high electronic conductivity, large specific surface area, and tunable porous structures.7 In addition, compared to the redox electrode materials of transition metal oxides and conducting polymers, carbon materials have longer cycling stability and lower cost.9,10 Numerous studies have made tremendous progress in improving the electrochemical performance of carbon materials. Recent research shows that the optimized pore architecture of the carbon materials is a critical factor for high performance supercapacitors. Umar et al. produced micropores on the walls of mesoporous carbon aerogels via a post-KOH activation process.11 The porous carbon material displays an enhanced capacitance due to the large surface area. To investigate the effect of the pores on the electrochemical performance, Xia et al. prepared a series of ordered mesoporous/microporous carbon materials.12 By controlling the titanium content in the precursor, optimal mesoporous/microporous carbon is obtained and exhibits better capacitance. In addition, introducing appropriate chemical functionalities is another effective approach to improve the electrochemical performance of the materials. Bélanger et al. reported that catechol-modified activated carbon prepared via diazonium chemistry exhibits a higher specific capacitance than pristine carbon.13 Through surface treatment with a silane coupling agent, Cai et al. introduced a hydrophobic functional group on the surface of the activated carbon and an improvement in the supercapacitor performance was obtained.14 Thus, adjusting the pore architecture of the carbon materials combined with surface modification would be a smart choice to maximize the electrochemical performance of the carbon materials.
Carbon fibers have attracted lots of attention due to their unique properties such as high stiffness, high tensile strength, low weight, and high chemical resistance.15–17 They have been shown to be applicable in numerous fields such as aerospace, civil engineering and motor sports.18 Carbon fibers also present great potential in energy storage.19–21 Activated carbon fibers (ACFs) with a large specific surface and high electronic conductivity show remarkable electrochemical performance and are a potential candidate for supercapacitors.22 Yang et al. produced precursor fibers by electrospinning of poly(amic acid) solutions.23 After carbonization, ultra-fine activated carbon fiber webs were obtained and displayed a capable capacitance. Leitner et al. prepared activated carbon fibers derived from poly(m-phenylene isophthalamide) in an aqueous solution, which exhibited a remarkable electrochemical performance.24 Unfortunately, the cost of preparing carbon fibers is relatively high and their demand is increasing leading to the production of large amounts of waste, such as polyacrylonitrile (PAN)-based precursor fibers, which are difficult to manage.25,26 Therefore, figuring out a way to convert the PAN-based precursor fiber waste into activated carbon fiber electrodes for supercapacitors would help reduce environmental impacts and decrease the overall production cost.
Herein, we use PAN-based precursor fibers from factory waste as raw materials to prepare original ACFs and maximize the electrochemical performance of ACFs by combining the optimized pore structure and surface modification. Firstly, ACFs with different surface areas and pore structures were obtained by carbonization and CO2 activation. The pore structure of ACFs was tuned via adjusting the activation time. Then, to make further improvements to the electrochemical performance of the materials, the ACF surface was modified. The ACFs were thermally treated by 65% nitric acid to introduce functional groups on the ACF surface without losing much specific surface area. This led to a maximum accessible specific surface area and high capacitance. Introducing the functional groups improves not only the wettability but also the pseudo-capacitance. Thus the capacitance of modified ACFs increases by 54% compared to ACFs, from 139 F g−1 to 214 F g−1 at a current density of 0.5 mA cm−2, and remains at 160 F g−1 as the current density increases to 100 mA cm−2. In addition, the modified ACFs display excellent capacity retention, close to 100% after 3000 cycles.
Experimental section
Materials preparation
The original activated carbon fibers (ACFs) were prepared through carbonization and carbon dioxide activation. Waste PAN-based precursor fibers were obtained from Jilin Petro-Chemical Company, washed completely with deionized water and dried at 120 °C for 12 h. The dried PAN-based precursor fibers were heated at 600 °C under N2 gas flow with a speed of 10 mL min−1 for 1 h. Then the carbonized fibers were heated to 900 °C at a rate of 5 °C min−1 under a N2 flow and kept under a CO2 flow with a speed of 100 mL min−1 for 3 h. After cooling down to room temperature, ACFs were produced. For comparison, the samples kept under a CO2 flow for 1 h and 5 h were also prepared. The ACFs with 1 h, 3 h and 5 h activation times are reported as 1 h, 3 h, and 5 h from here on in, respectively.To make surface modifications, the 3 h activated samples were thermally treated with nitric acid. First, 3 h ACFs were added into 50 mL nitric acid with a concentration of 65% and kept for 12 h. The products were then transferred into a vacuum oven and kept at 80 °C for 12 h. The samples were washed with deionized water several times and dried in a vacuum oven for 24 h.
Materials characterization
The crystal structure of the samples was investigated using a DX-2700B X-ray diffractometer (Dandong Haoyuan Instrument Co., Ltd) using Cu Kα radiation. The morphology of the materials was characterized using a JSM-6700F scanning electron microscope (SEM). Raman spectra were recorded on a Renishaw Raman microscope with a 488 nm laser. Gas adsorption studies were conducted on a Micromeritics ASAP2420 Accelerated Surface Area and Porosimetry system. The pore size distribution and specific surface area of the products were calculated using the Brunauer–Emmett–Teller (BET) method on the N2 sorption information (covering the range of 1–50 nm). The pore size distribution was obtained based on the Barrett–Joyner–Halenda model.For electrochemical testing, the working electrode was prepared by mixing 85 wt% carbon materials, 10 wt% carbon black as a conductive agent, and 5 wt% polytetrafluoroethylene (PTFE) binder dispersed in ethanol. The slurries were rolled into a membrane and pressed onto 1 × 1 cm2 Ni foam current collectors and dried in a vacuum oven at 110 °C overnight. The electrochemical properties were investigated in a three-electrode configuration cell using a film electrode as the working electrode, a platinum plate (1 × 1 cm2) as the counter electrode, and a saturated calomel electrode as the reference electrode in 6 M KOH aqueous electrolyte. In the two-electrode systems, the symmetric supercapacitor was tested in an aqueous solution of 6 M KOH. Galvanostatic cycling, cyclic voltammetry (CV), and impedance spectroscopy were carried out to characterize the electrochemical performance of each cell. The time constant and frequency dispersion were analyzed via impedance spectroscopy. CV was tested between 0 and 1.0 V using a scanning rate between 5 and 1000 mV s−1. The specific capacitance, C, can be determined using eqn (1):
 | (1) |
 | (2) |
Results and discussion
Adjusting the pore structure by activation time
X-ray diffraction (XRD) patterns of the samples with different activation times are shown in Fig. 1a. All three samples exhibit the (002) and (101) reflections of graphitic carbon around 26° and 43°. The broad peak suggests the disorder and amorphous characteristics of the materials.27 To better understand the structural evolution of the activated carbon materials with different activation times, Raman scattering measurements were carried out. Fig. 1b displays the Raman spectrum of the three samples and all exhibit two distinct peaks located at around 1350 and 1600 cm−1, which are typical for D and G band vibrations, respectively. In general, the D band is attributed to the vibrations of disordered carbon atoms, while the G band reflects the ordered carbon.28,29 The broadening of the D and G bands observed in the Raman spectra suggests an amorphous nature due to the short range order, which is consistent with the results of XRD. The peak area ratio between the D and G peaks, denoted as PD/PG, indicates the degree of disorder in the structure of the carbon materials.28 Using NGSLabSpec, the PD/PG ratio of the three samples at 1 h, 3 h, and 5 h is calculated to be 3.43, 2.17, and 1.53 respectively. The value of PD/PG for the activated carbon fibers decreases as the activation time increases, suggesting that the long activation time enhances the graphitization degree. | ||
| Fig. 1 (a) XRD patterns, (b) Raman scattering patterns and (c) N2 adsorption/desorption isotherm curves of ACFs with activation times of 1 h, 3 h and 5 h. | ||
The specific surface area and pore size distribution of the samples were further investigated using nitrogen adsorption–desorption isotherms, and the standard multipoint BET method was used to calculate the specific surface area of the composite as shown in Fig. 1c. Table 1 summarizes the specific surface area and pore size of the samples synthesized with different activation times. The results show that the longer activation time results in a larger median pore width. The 5 h sample exhibits a larger median pore width (6.291 Å) than those of samples 3 h (6.175 Å) or 1 h (6.002 Å). However, among the three samples, 3 h displays the largest pore volume (0.234 cm3 g−1) and specific surface area (469 m2 g−1), implying that a two-step activation reaction, as shown in Fig. 2, occurs. First, with CO2 activation (from 1 h to 3 h), new micropores form in the activated carbon fiber, which leads to the increase in the median pore width, pore volume and specific surface area. Then, with the extension of activation time (from 3 h to 5 h), the connections between pores are diminished due to dilation, and smaller pores are able to join together forming larger ones, which results in larger median pore widths and smaller pore volumes and specific surface areas. It should be noticed that the as-prepared materials mainly display a microporous structure, which is very helpful to improve the surface area. According to the previous reports,30,31 introducing the mass transport pathway could enhance the ion diffusion properties. It enables the electrolyte ions to diffuse into materials more efficiently. Thus the electrochemical performance, especially the capacitive properties, can be further improved through use of the mass transport pathway. In addition, the surface morphology of the samples was investigated using SEM (Fig. 3a–c). The inset images suggest that the morphology of the fibers with widths between 6 and 8 μm are not affected by the activation time. The SEM images confirm that activated carbon fibers have a porous structure. For the carbon nanomaterials, the morphology of the pore could be checked through TEM.32 Unfortunately, due to the large diameter of the material and small pore size, the details of the pore morphology are difficult to further obtain.
| Activation time (h) | Median pore width (Å) | Micropore volume (cm3 g−1) | Other pore volumes (cm3 g−1) | Total volume (cm3 g−1) | Specific surface area (m2 g−1) |
|---|---|---|---|---|---|
| 1 | 6.002 | 0.182 | 0.021 | 0.203 | 359 |
| 3 | 6.175 | 0.211 | 0.023 | 0.234 | 469 |
| 5 | 6.291 | 0.144 | 0.032 | 0.176 | 268 |
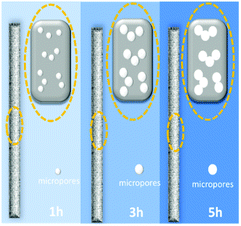 | ||
| Fig. 2 Scheme of the formation mechanism of the CO2 activation process with different reaction times. | ||
 | ||
| Fig. 3 SEM images of ACFs with activation times of (a) 1 h, (b) 3 h and (c) 5 h. Insets in (a), (b), and (c) are the corresponding low-magnification SEM images. | ||
To investigate the effect of pore structure on electrochemical performance, the samples were tested as electrodes for supercapacitors using CV with a scan range of 5 mV s−1. As shown in Fig. 4a, the CV curves of the three samples exhibit a symmetric and rectangular-like shape from 0 to 1 V, suggesting a near ideal capacitive behavior. The capacitance of 3 h is calculated to be 137 F g−1, which is larger than that of 1 h (118 F g−1) or 5 h (83 F g−1). The largest capacitance of 3 h is attributed to the largest specific surface area.33 To further investigate the rate capability of the samples, the materials were tested under different current densities as shown in Fig. 4b. Although the material with 3 h activation time exhibits the best rate capability, at a high current density of 100 mA cm−2, only about 43 F g−1 is maintained. These results suggest that adjusting the pore architecture is an effective way to enhance the capacitance of the materials with little influence on the rate capability. Therefore, further surface modification is necessary to improve the rate capability of the activated carbon fibers.
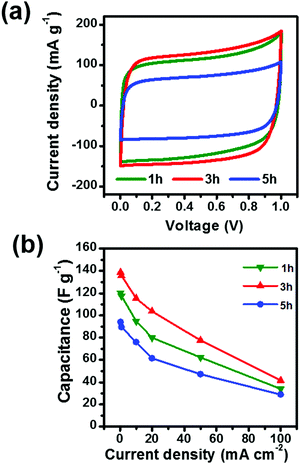 | ||
| Fig. 4 (a) CV curves and (b) comparison of capacitances of ACFs with activation times of 1 h, 3 h and 5 h. | ||
Surface modification via nitric acid thermal treatment
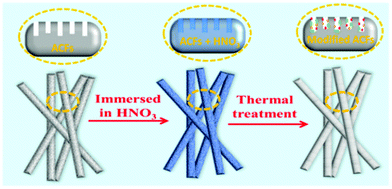
Introducing foreign oxygen-containing functional groups on the ACF surface effectively improves the electrochemistry performance of ACFs. Here we add these functional groups using a facile method, via immersing the ACFs in nitric acid combined with thermal treatment, as shown in Fig. 5. First, the ACFs are immersed in a nitric acid bath with a concentration of 65%, which penetrates into the ACF pores. From the oxidation of the nitric acid, some functional groups are generated on the ACF surface. To produce more functional groups, the fibers were treated at 80 °C. The samples immersed in 65% nitric acid solution with thermal treatment are labeled as HT65 ACFs from here on in. To better understand the process of thermal treatment, the samples only immersed in 65% nitric acid and not thermally treated were also studied and are labeled as 65 ACFs.Fig. 6a shows the XRD patterns of the ACFs, 65 ACFs, and HT65 ACFs. All the samples display broad and weak peaks at 2θ = 23° and 44°, corresponding to the (002) and (101) planes of graphitized carbon, respectively. It is caused by the disorder and amorphous characteristics of the materials.27 Meanwhile, there is almost no difference among all the samples, suggesting that the treatment of nitric acid does not affect the structure of graphite. To investigate the effect of nitric acid treatment on the pore structure of the samples, nitrogen adsorption–desorption isotherm measurements and the standard multipoint BET method were carried out and are shown in Fig. 6b. The porous properties are summarized in Table 2. The nitric acid treatment decreases the specific surface area in all of the samples. After nitric acid immersion, the specific surface area reduces from 468 m2 g−1 in the ACFs to 299 m2 g−1 in 65 ACFs. In addition, the thermal treatment improves the ACF specific surface area. HT65 ACFs has a larger specific surface area (428 m2 g−1) than that of 65 ACFs, leading to a better electrochemical performance. Pore size distribution curves (Fig. 6c) give a wealth of information regarding the pore size distribution. The results show that the micropore size range is between 0.2 and 1.5 nm. Chemical composition of the nitric acid treated samples was also determined by elemental analysis and the values of O/C and H/C are shown in Table 2. Nitric acid thermal treatment increases the H and O content, suggesting that the addition of functional groups improves with nitric acid immersion and is further enhanced by thermal treatment. The higher functional group content on the surface of HT65 ACFs would be beneficial for wettability, which plays an important role in maximizing the access of electrolyte to the surface of the electrode.34,35
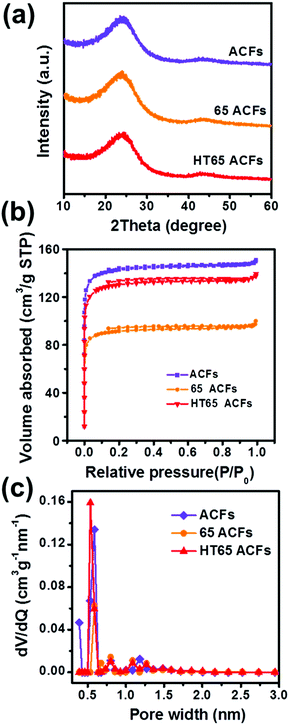 | ||
| Fig. 6 (a) XRD patterns, (b) N2 adsorption/desorption isotherm curves and (c) pore size distribution analysis of ACFs, 65 ACFs and HT65 ACFs. | ||
| Sample | Micropore volume (cm3 g−1) | Total volume (cm3 g−1) | Special surface area (m2 g−1) | O/C (wt%) | H/C (wt%) |
|---|---|---|---|---|---|
| ACFs | 0.211 | 0.234 | 469 | 7.4 | 1.0 |
| 65 ACFs | 0.123 | 0.154 | 299 | 12.9 | 1.2 |
| HT65 ACFs | 0.174 | 0.216 | 428 | 30.6 | 1.7 |
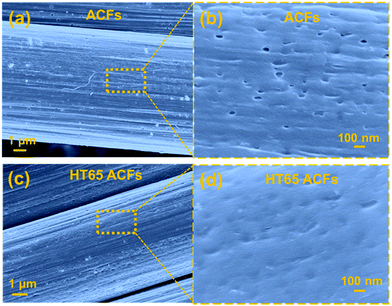
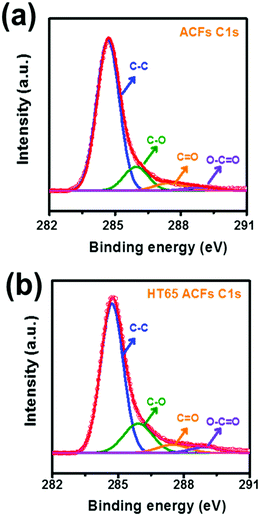
To further investigate the surface morphology change made by the nitric acid thermal treatment, SEM was performed and the images are shown in Fig. 7. It should be noted that before and after the nitric acid thermal treatment the fiber structures are fairly uniform, confirming that there is no damage or cutting on the ACFs. However, pores on the surface of the HT65 ACFs become much smaller than those on the ACF surface, which may be caused by the formation of functional groups. XPS studies were carried out and are shown in Fig. 8, to understand the functional groups on the surface of the ACFs. The XPS spectra of the C 1s peaks of ACFs and HT65 ACFs are fitted by four components. The main peak at 284.7 eV relates to the graphite-like sp2 C and the three peaks at 286.1, 287.5 and 289.0 eV are attributed to the C–O, C![[double bond, length as m-dash]](https://www.rsc.org/images/entities/char_e001.gif) O, and O–C
O, and O–C![[double bond, length as m-dash]](https://www.rsc.org/images/entities/char_e001.gif) O bonds respectively.36 After the nitric acid thermal treatment, more C–O and O–C
O bonds respectively.36 After the nitric acid thermal treatment, more C–O and O–C![[double bond, length as m-dash]](https://www.rsc.org/images/entities/char_e001.gif) O functional groups form on the surface of ACFs, which would enhance not only the wettability but also the pseudo-capacitance through the following redox reaction:37–39
O functional groups form on the surface of ACFs, which would enhance not only the wettability but also the pseudo-capacitance through the following redox reaction:37–39
–C–OH → –C![[double bond, length as m-dash]](https://www.rsc.org/images/entities/char_e001.gif) O + H+ + e− O + H+ + e− | (3) |
| –COOH → –COO + H+ + e− | (4) |
–C![[double bond, length as m-dash]](https://www.rsc.org/images/entities/char_e001.gif) O + e− → –C–O−. O + e− → –C–O−. | (5) |
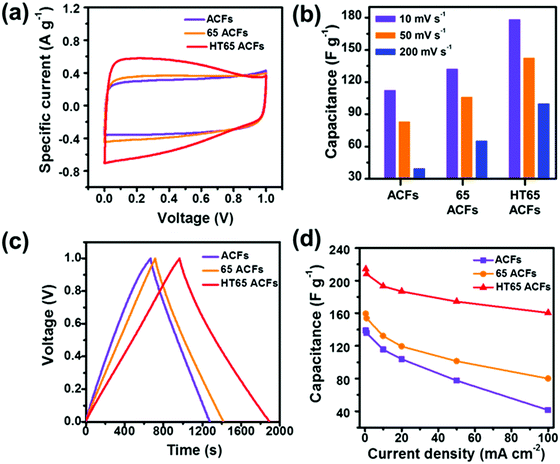
To evaluate the electrochemical properties of the samples as a supercapacitor electrode, CV measurements were carried out at a scan rate of 5 mV s−1 (Fig. 9a). HT65 ACFs exhibit the largest curve area corresponding to the largest capacitance among the samples. HT65 ACFs display a rectangular shape CV curve with humps owing to the combination effects of electric double-layer capacitance and pseudo-capacitance. Fig. 9b displays the capacitance of the samples calculated using CV curves at different scan rates. HT65 ACFs present the largest capacitance and it should be noticed that after nitric acid treatment, the materials also display an improved capacitance. The 65 ACFs have a lower quantity of functional groups than the HT65 ACFs due to no thermal treatment, which could speed up the generation of functional groups on the surface of the materials. Even so, 65 ACFs also present enhanced rate capability and capacitance, suggesting that introducing the functional groups on the surface is an efficient way to improve the electrochemical performance. Galvanostatic charge/discharge measurements were also carried out in a three-electrode system with a voltage window of 0–1 V and are shown in Fig. 9c. All the samples have a symmetric charge–discharge curve. The discharge and charge times of the HT65 ACFs are significantly longer than the other samples, indicating that the HT65 ACFs provide a larger capacitance, which is in agreement with the CV results. Fig. 9d shows the calculated specific capacitance from the discharge curves at different current densities. The HT65 ACFs exhibit a remarkable capacitance of 212 F g−1 at a current density of 0.5 mA cm−2. Meanwhile, at a current density of 100 mA cm−2, the HT65 ACFs offer the largest capacitance of 160 F g−1 among the samples treated with nitric acid (104.5 F g−1) and original ACFs (41 F g−1), which further confirms that nitric acid thermal treatment is an effective method to improve the rate capability. The enhanced performance is attributed to the functional groups on the surface. These oxygen groups enhance the wettability and interconnection between the materials and the electrolyte, favoring the ions to reach the micropore.14,39 The functional groups could also contribute to a pseudo-capacitance performance.38 Thus surface modification is an efficient way to improve not only the capacitance but also the rate capability.
An electrochemical impedance spectrum (EIS) is a powerful measurement used to obtain a lot of information about electrochemical frequency behavior, redox reaction resistance, and equivalent series resistance of the capacitor system. As shown in Fig. 10a, all samples display a typical impedance spectrum with three distinct regions.27,40 The loop in the high frequencies is attributed to the charge-transfer resistance. In the intermediate frequency region, the line with a slope close to 45° relates to ion diffusion into the electrode interface. The almost vertical line at a low frequency reflects the purely capacitive characteristic. The inset of Fig. 10a shows that all the samples display a low equivalent series resistance of about 0.7 Ω, obtained from high-frequency intercepts. The samples with nitric acid treatment show a smaller charge-transfer resistance than that of ACFs, which indicates that the functional groups improve the electrochemical performance. In addition, the HT65 ACFs have the smallest charge-transfer resistance among the samples, which could enhance their capacitor performance. The evolution of the real C′′ and imaginary C′ capacitance versus frequency could enable obtaining the time constant and gaining insight into the electrochemical properties of the supercapacitors. The capacitance of the sample gradually decreases as the frequency increases, as shown in Fig. 10b. The higher initial capacitances of the nitric acid treated samples are much higher than those of the ACFs, suggesting that the existence of the functional groups is responsible for improving the accessibility of electrolyte ions on the surface.35 Moreover, the functional groups react with the electrolyte ions to enhance their pseudo-capacitance.38 The time constant (τ = 1/f) describes the capacitor performance and is calculated by the imaginary part of capacitance versus frequency curve, Fig. 10c. The lower time constant reflects the better rate capability of the capacitor. As shown in Table 3, the HT65 ACFs present the lowest time constant of 0.51 s, which implies that the HT65 ACFs have the best rate capability and is in agreement with the galvanostatic charge–discharge results.
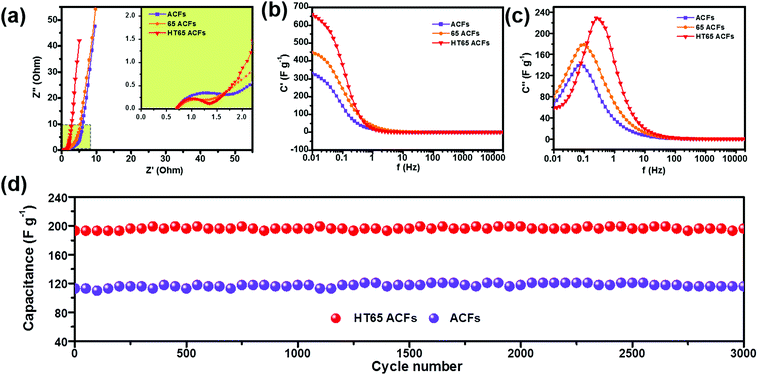 | ||
| Fig. 10 (a) Nyquist plots, (b) the imaginary capacitance and (c) progression of the real capacitance for ACFs, 65 ACFs, and HT65 ACFs. (d) Cycling performance of ACFs and HT65 ACFs. | ||
| Sample | T (s) | R s (Ω) | R t (Ω) |
|---|---|---|---|
| ACFs | 2.002 | 0.71 | 0.82 |
| 65 ACFs | 1.591 | 0.70 | 0.58 |
| HT65 ACFs | 0.634 | 0.70 | 0.51 |
The cycling stability of the electrode material is important for its application in electrochemical supercapacitors. Galvanostatic charge–discharge tests were performed to examine the cycling stability of the ACFs and HT65 ACFs. Fig. 10d shows the variation of specific capacitance with cycle number. HT65 ACFs display a remarkable capacitance of 193 F g−1, which is much larger than that of ACFs (113 F g−1). Nitric acid effectively improves the capacitance, due to the enhanced wettability and extra pseudo-capacitance from the redox reactions of the functional groups. After 3000 cycles, both HT65 ACFs and ACFs show excellent capacity retentions, ∼100%. The as-prepared material presents a competitive electrochemical performance compared with previously reported carbon materials as shown in Table S1 (ESI†). Due to the synergistic effect of the optimized pore structure and surface modification, a higher capacitance is achieved. Moreover, the HT65 ACFs also display an excellent cycling performance. The remarkable capacitance and adequate cycling stability of the HT65 ACFs make them a promising electrode material for supercapacitors for large scale energy storage systems.
The assembly of the two-electrode system is an effective measure to investigate the application prospects of the electrode materials. Therefore, a HT65 ACFs//HT65 ACFs symmetric supercapacitor was fabricated as shown in Fig. S3 (ESI†). It is worth mentioning that the CV curve displays a quasi-rectangular shape at 50 mV s−1, suggesting their adequate rate capabilities (Fig. S4, ESI†). The specific capacitances of the supercapacitor at different scan rates were calculated as shown in Fig. S5 (ESI†). The capacitance of the HT65 ACFs//HT65 ACFs symmetric supercapacitor reaches up to 87 F g−1 at a scan rate of 50 mV s−1. In addition, the capacitance retention of the symmetric supercapacitor at 5 A g−1 approaches 91% after 5000 cycles (Fig. S6, ESI†). The experimental results demonstrate that HT65 ACFs have a promising application as capable electrode materials for supercapacitors.
Factors affecting the electrochemical performance
The above results clearly reveal that the HT65 ACFs display enhanced electrochemical performances. The high capacity, remarkable rate capability and cycle performance achieved with the HT65 ACFs are mainly dependent upon the following factors: ACFs with a higher pore volume and a larger surface area are achieved by adjusting the activation time, which provides rich sites for adsorbing ions. The optimized pore structure and surface area determine the capacitance of the carbon materials, but they have little influence on the rate capabilities. Additionally, compared with adjusting the pore architecture, the surface modification plays a more important role in improving the electrochemical performance. Surface modification improves not only the capacitance but also the rate capability of the materials due to the presence of oxygen-containing functional groups. Therefore, materials with both an adjusted pore structure and surface modification display the best electrochemical performance.Conclusions
Low-cost ACFs modified by functional groups were prepared using the PAN-based precursor fibers, abandoned by local factories, as raw materials through CO2 activation and HNO3 thermal treatment. CO2 activation time affected the surface area of the ACFs and the sample with a 3 h activation time had the largest pore volume (0.234 cm3 g−1) and specific surface area (469 m2 g−1). The sample with a 3 h activation time also presented a large capacitance of 137 F g−1. Therefore, adjusting the pore architecture would be an effective way to enhance ACF capacitance. To further improve the electrochemical performance, a simple nitric acid thermal treatment was used to modify the ACFs with functional groups. Although nitric acid thermal treatment decreases the surface area of the materials, more C–O and O–C![[double bond, length as m-dash]](https://www.rsc.org/images/entities/char_e001.gif) O functional groups are produced on the surface of the ACFs and they enhance not only the wettability but also the pseudo-capacitance. Thus modifying the surface with functional groups improved both the capacitance and rate capability of the electrode materials more effectively. The sample treated with 65% HNO3 exhibits the highest capacitance of 214 F g−1 at a current density of 0.5 mA cm−2. Moreover, it displays a remarkable rate capability and outstanding cycling performance with an excellent capacitance retention of ∼100% over 3000 cycles. The results demonstrate that engineering the pore architecture and surface modification would provide new possibilities to access high quality and capable electrode materials for supercapacitors.
O functional groups are produced on the surface of the ACFs and they enhance not only the wettability but also the pseudo-capacitance. Thus modifying the surface with functional groups improved both the capacitance and rate capability of the electrode materials more effectively. The sample treated with 65% HNO3 exhibits the highest capacitance of 214 F g−1 at a current density of 0.5 mA cm−2. Moreover, it displays a remarkable rate capability and outstanding cycling performance with an excellent capacitance retention of ∼100% over 3000 cycles. The results demonstrate that engineering the pore architecture and surface modification would provide new possibilities to access high quality and capable electrode materials for supercapacitors.
Acknowledgements
We thank Miss Ying Wang for her help in assembling the symmetric supercapacitor. This research was financially supported by the Science & Technology Department of Jilin Province (No. 20140520093JH), the Open Project of State Key Laboratory of Superhard Materials (Jilin University, No. 201513), the State Major Scientific Instrument and Equipment Development of China (No. 2012YQ24026407), and the China Education Resource System (No. CERS-1-3).Notes and references
- V. Augustyn, J. Come, M. A. Lowe, J. W. Kim, P.-L. Taberna, S. H. Tolbert, H. D. Abruna, P. Simon and B. Dunn, Nat. Mater., 2013, 12, 518–522 CrossRef CAS PubMed.
- P. G. Bruce, S. A. Freunberger, L. J. Hardwick and J.-M. Tarascon, Nat. Mater., 2012, 11, 19–29 CrossRef CAS PubMed.
- A. Pospischil, M. M. Furchi and T. Mueller, Nat. Nanotechnol., 2014, 9, 257–261 CrossRef CAS PubMed.
- M. Acerce, D. Voiry and M. Chhowalla, Nat. Nanotechnol., 2015, 10, 313–318 CrossRef CAS PubMed.
- P. Simon and Y. Gogotsi, Nat. Mater., 2008, 7, 845–854 CrossRef CAS PubMed.
- D. Pech, M. Brunet, H. Durou, P. Huang, V. Mochalin, Y. Gogotsi, P.-L. Taberna and P. Simon, Nat. Nanotechnol., 2010, 5, 651–654 CrossRef CAS PubMed.
- D. Yu, K. Goh, H. Wang, L. Wei, W. Jiang, Q. Zhang, L. Dai and Y. Chen, Nat. Nanotechnol., 2014, 9, 555–562 CrossRef CAS PubMed.
- Z. Yang, J. Deng, X. Chen, J. Ren and H. Peng, Angew. Chem., Int. Ed., 2013, 52, 13453–13457 CrossRef CAS PubMed.
- L.-F. Chen, Z.-H. Huang, H.-W. Liang, W.-T. Yao, Z.-Y. Yu and S.-H. Yu, Energy Environ. Sci., 2013, 6, 3331–3338 CAS.
- Z. Yu, L. Tetard, L. Zhai and J. Thomas, Energy Environ. Sci., 2015, 8, 702–730 CAS.
- P. Hao, Z. Zhao, J. Tian, H. Li, Y. Sang, G. Yu, H. Cai, H. Liu, C. Wong and A. Umar, Nanoscale, 2014, 6, 12120–12129 RSC.
- D.-D. Zhou, H.-J. Liu, Y.-G. Wang, C.-X. Wang and Y.-Y. Xia, J. Mater. Chem., 2012, 22, 1937–1943 RSC.
- G. G. Pognon, C. Cougnon, D. Mayilukila and D. Bélanger, ACS Appl. Mater. Interfaces, 2012, 4, 3788–3796 CAS.
- Z. Jin, W. Mu, C. Zhang, T. He, Q. Zhang, J. Hou and K. Cai, Electrochim. Acta, 2012, 59, 100–104 CrossRef CAS.
- F. Zhang, S. Niu, W. Guo, G. Zhu, Y. Liu, X. Zhang and Z. L. Wang, ACS Nano, 2013, 7, 4537–4544 CrossRef CAS PubMed.
- T. Y. Ma, J. Ran, S. Dai, M. Jaroniec and S. Z. Qiao, Angew. Chem., Int. Ed., 2015, 54, 4646–4650 CrossRef CAS PubMed.
- A. L. Wang, X. J. He, X. F. Lu, H. Xu, Y. X. Tong and G. R. Li, Angew. Chem., Int. Ed., 2015, 54, 3669–3673 CrossRef CAS PubMed.
- L. Zhang, A. Aboagye, A. Kelkar, C. Lai and H. Fong, J. Mater. Sci., 2014, 49, 463–480 CrossRef CAS.
- L. Qie, W. M. Chen, Z. H. Wang, Q. G. Shao, X. Li, L. X. Yuan, X. L. Hu, W. X. Zhang and Y. H. Huang, Adv. Mater., 2012, 24, 2047–2050 CrossRef PubMed.
- L. Fu, K. Tang, K. Song, P. A. van Aken, Y. Yu and J. Maier, Nanoscale, 2014, 6, 1384–1389 RSC.
- J. Xiao, L. Wan, S. Yang, F. Xiao and S. Wang, Nano Lett., 2014, 14, 831–838 CrossRef CAS PubMed.
- G. Wang, H. Wang, X. Lu, Y. Ling, M. Yu, T. Zhai, Y. Tong and Y. Li, Adv. Mater., 2014, 26, 2676–2682 CrossRef CAS PubMed.
- C. Kim, Y.-O. Choi, W.-J. Lee and K.-S. Yang, Electrochim. Acta, 2004, 50, 883–887 CrossRef CAS.
- K. Leitner, A. Lerf, M. Winter, J. Besenhard, S. Villar-Rodil, F. Suarez-Garcia, A. Martinez-Alonso and J. Tascon, J. Power Sources, 2006, 153, 419–423 CrossRef CAS.
- J. Kadla, S. Kubo, R. Venditti, R. Gilbert, A. Compere and W. Griffith, Carbon, 2002, 40, 2913–2920 CrossRef CAS.
- S. Chand, J. Mater. Sci., 2000, 35, 1303–1313 CrossRef CAS.
- Y. Gao, L. Li, Y. Jin, Y. Wang, C. Yuan, Y. Wei, G. Chen, J. Ge and H. Lu, Appl. Energy, 2015, 153, 41–47 CrossRef CAS.
- L. Qie, W. Chen, H. Xu, X. Xiong, Y. Jiang, F. Zou, X. Hu, Y. Xin, Z. Zhang and Y. Huang, Energy Environ. Sci., 2013, 6, 2497–2504 Search PubMed.
- H. Wang, Z. Xu, A. Kohandehghan, Z. Li, K. Cui, X. Tan, T. J. Stephenson, C. K. King'ondu, C. M. Holt and B. C. Olsen, ACS Nano, 2013, 7, 5131–5141 CrossRef CAS PubMed.
- Y. Liang, F. Liang, D. Wu, Z. Li, F. Xu and R. Fu, Phys. Chem. Chem. Phys., 2011, 13, 8852–8856 RSC.
- Y. Liang, F. Liang, Z. Li, D. Wu, F. Yan, S. Li and R. Fu, Phys. Chem. Chem. Phys., 2010, 12, 10842–10845 RSC.
- H. Zhang, W. Ding, K. He and M. Li, Nanoscale Res. Lett., 2010, 5, 1264 CrossRef CAS PubMed.
- Z. Li, Z. Xu, H. Wang, J. Ding, B. Zahiri, C. M. Holt, X. Tan and D. Mitlin, Energy Environ. Sci., 2014, 7, 1708–1718 CAS.
- L.-Q. Mai, A. Minhas-Khan, X. Tian, K. M. Hercule, Y.-L. Zhao, X. Lin and X. Xu, Nat. Commun., 2013, 4, 2923 Search PubMed.
- B. D. Assresahegn, T. Brousse and D. Bélanger, Carbon, 2015, 92, 362–381 CrossRef CAS.
- K. Zhu, H. Qiu, Y. Zhang, D. Zhang, G. Chen and Y. Wei, ChemSusChem, 2015, 8, 1017–1025 CrossRef CAS PubMed.
- Y. Huang, S. L. Candelaria, Y. Li, Z. Li, J. Tian, L. Zhang and G. Cao, J. Power Sources, 2014, 252, 90–97 CrossRef CAS.
- H. Liu, H. Song, X. Chen, S. Zhang, J. Zhou and Z. Ma, J. Power Sources, 2015, 285, 303–309 CrossRef CAS.
- L. Jiang, L. Sheng, C. Long, T. Wei and Z. Fan, Adv. Energy Mater., 2015, 5, 1500771–1500779 CrossRef.
- K. Zhu, Y. Wang, J. A. Tang, H. Qiu, X. Meng, Z. Gao, G. Chen, Y. Wei and Y. Gao, RSC Adv., 2016, 6, 14819–14825 RSC.
Footnote |
| † Electronic supplementary information (ESI) available. See DOI: 10.1039/c6qm00196c |
| This journal is © the Partner Organisations 2017 |

