
Whispering-gallery-mode based CH3NH3PbBr3 perovskite microrod lasers with high quality factors
Kaiyang
Wang†
a,
Shang
Sun†
b,
Chen
Zhang
b,
Wenzhao
Sun
a,
Zhiyuan
Gu
a,
Shumin
Xiao
*b and
Qinghai
Song
*ac
aIntegrated Nanoscience Lab, Department of Electrical and Information Engineering, Harbin Institute of Technology, Shenzhen, 518055, China. E-mail: qinghai.song@hitsz.edu.cn
bIntegrated Nanoscience Lab, Department of Material Science and Engineering, Harbin Institute of Technology, Shenzhen, 518055, China. E-mail: shumin.xiao@hitsz.edu.cn
cState Key Laboratory on Tunable Laser Technology, Harbin Institute of Technology, Harbin, 158001, China
First published on 19th August 2016
Abstract
Lead halide perovskite based micro- and nano-lasers have been widely studied in the past two years. Due to their long carrier diffusion length and high external quantum efficiency, lead halide perovskites have been considered to have a bright future in optoelectronic devices, especially in the “green gap” wavelength region. However, the quality (Q) factors of perovskite lasers are unspectacular compared to conventional microdisk lasers. The record value of full width at half maximum (FWHM) at the threshold is still around 0.22 nm. Herein we synthesized solution-processed, single-crystalline CH3NH3PbBr3 perovskite microrods and studied their lasing actions. In contrast to entirely pumping a microrod on a substrate, we partially excited the microrods that were hanging in the air. Consequently, single-mode or few-mode laser emissions have been successfully obtained from the whispering-gallery like diamond modes, which are confined by total internal reflection within the transverse plane. Owning to the better light confinement and high crystal quality, the FWHM at the threshold has been significantly improved. The smallest FWHM at the threshold is around 0.1 nm, giving a Q factor over 5000.
Introduction
Due to their ultralow defect density and long carrier diffusion length, lead halide perovskites (CH3NH3PbX3) have been demonstrated as efficient photovoltaic materials.1 In just four years, the light conversion coefficient has been dramatically increased from around 3% to over 20%.2–7 Very recently, these unique properties of lead halide perovskites have been utilized in optical and photonic devices.8,9 Light emitting devices, especially micro- and nano-lasers, have been successfully demonstrated in both polycrystalline films8,9 and single-crystal microstructures.10–17 In addition to the solution-processed synthesis, lead halide perovskite optoelectronic devices have shown advantages such as high external quantum efficiency8–10 and low carrier density at the threshold. Most importantly, their emission wavelengths can be controlled from ultraviolet to near infrared by changing the halide from Cl to Br or I.8 This suddenly leads to important applications of CH3NH3PbBr3 perovskites8,11–14 in green-light regions (540–580 nm, also known as the “green gap”), where the conventional semiconductors such as III-N and III-P face a severe challenge. To be commercially available, the long-term stability of lead halide perovskites needs to be significantly improved. Here it should be noted that recently formamidinium lead halide perovskite (FAPbX3) microlasers, which feature red-shifted emission and better photo- and thermal stability compared to MAPbX3, have been demonstrated.18While the lead-halide perovskite lasers have been widely studied in polygon microcavities,14–17 microrods,11–13 nanorods,10 spherical cavities,19 as well as random lasers in microcrystal networks or clusters,20,21 their quality (Q) factors are usually much lower than conventional microlasers. The reported full width at half maximum (FWHM) at the lasing threshold in hexagonal microdisks and square microdisks is usually larger than 0.5 nm.14–17 In 2015, Zhu et al. improved the crystal quality of perovskites and reduced the FWHM at the threshold to record low values around 0.22 nm.10 However, this value is still far from that of GaAs based circular microdisks or deformed microdisks.22 Herein, we synthesize CH3NH3PbBr3 perovskite microrods and study their lasing actions. In general, the quality factor is dependent on the absorption loss, radiation loss, and scattering loss following the equation 1/Q = 1/Q_rad + 1/Q_sca + 1/Q_abs. The absorption loss and scattering loss can be decreased by improving the crystal quality, whereas the radiation loss is mostly associated with the resonators and some additional mechanisms. By improving both the crystal quality and the cavity design, we have further decreased the FWHM at the lasing threshold to around 0.1 nm, giving a Q factor over 5000.
Results and discussion
The microrods were synthesized using the solution-processed one-step precipitation method. CH3NH3Br and PbBr2 were independently dissolved in N,N-dimethylformamide (DMF) with concentrations around 0.1 M.12 Then the two solutions were mixed with a 1![[thin space (1/6-em)]](https://www.rsc.org/images/entities/char_2009.gif) :1 volume ratio to form CH3NH3Br·PbBr2 solution (0.05 M). The mixed solution was dip-casted onto an ITO-coated glass substrate, which was placed on a teflon stage in a 250 ml beaker. 75 ml dichloromethane (DCM, CH2Cl2) was added in the beaker, which was sealed with a porous parafilm (3M). After 24 hours, CH3NH3PbBr3 perovskites were successfully synthesized on the substrate. Fig. 1(a) shows the top-view scanning electron microscopy (SEM) image of the synthesized CH3NH3PbBr3 perovskites. Within the measured area, we can see that the cuboid microrods are dominant structures. The lengths and widths of microrods, which can be directly taken from the SEM images, vary in the range from a few micrometers to tens of micrometers and a few hundred nanometers to a few microns, respectively. The naturally grown microrods usually have square cross sections (see Fig. 2(a) as examples). The insets in Fig. 4(b), (d) and (f) show the high resolution SEM images of microrods. We can see that the facets of the microrods are extremely flat and only a few flaws randomly distribute on them. Fig. 1(b) shows the X-ray diffraction result of the perovskite microrods. A set of diffraction peaks at 2θ = 14.7° (001) and 29.86° (002) are well consistent with Zhu's report10 and clearly show the cubic perovskite phase. All this information shows the high quality of the synthesized perovskites and indicates the possibility of achieving a high Q laser.
:1 volume ratio to form CH3NH3Br·PbBr2 solution (0.05 M). The mixed solution was dip-casted onto an ITO-coated glass substrate, which was placed on a teflon stage in a 250 ml beaker. 75 ml dichloromethane (DCM, CH2Cl2) was added in the beaker, which was sealed with a porous parafilm (3M). After 24 hours, CH3NH3PbBr3 perovskites were successfully synthesized on the substrate. Fig. 1(a) shows the top-view scanning electron microscopy (SEM) image of the synthesized CH3NH3PbBr3 perovskites. Within the measured area, we can see that the cuboid microrods are dominant structures. The lengths and widths of microrods, which can be directly taken from the SEM images, vary in the range from a few micrometers to tens of micrometers and a few hundred nanometers to a few microns, respectively. The naturally grown microrods usually have square cross sections (see Fig. 2(a) as examples). The insets in Fig. 4(b), (d) and (f) show the high resolution SEM images of microrods. We can see that the facets of the microrods are extremely flat and only a few flaws randomly distribute on them. Fig. 1(b) shows the X-ray diffraction result of the perovskite microrods. A set of diffraction peaks at 2θ = 14.7° (001) and 29.86° (002) are well consistent with Zhu's report10 and clearly show the cubic perovskite phase. All this information shows the high quality of the synthesized perovskites and indicates the possibility of achieving a high Q laser.
 | ||
| Fig. 1 The SEM image (a) and XRD (b) of synthesized perovskite microrods. | ||
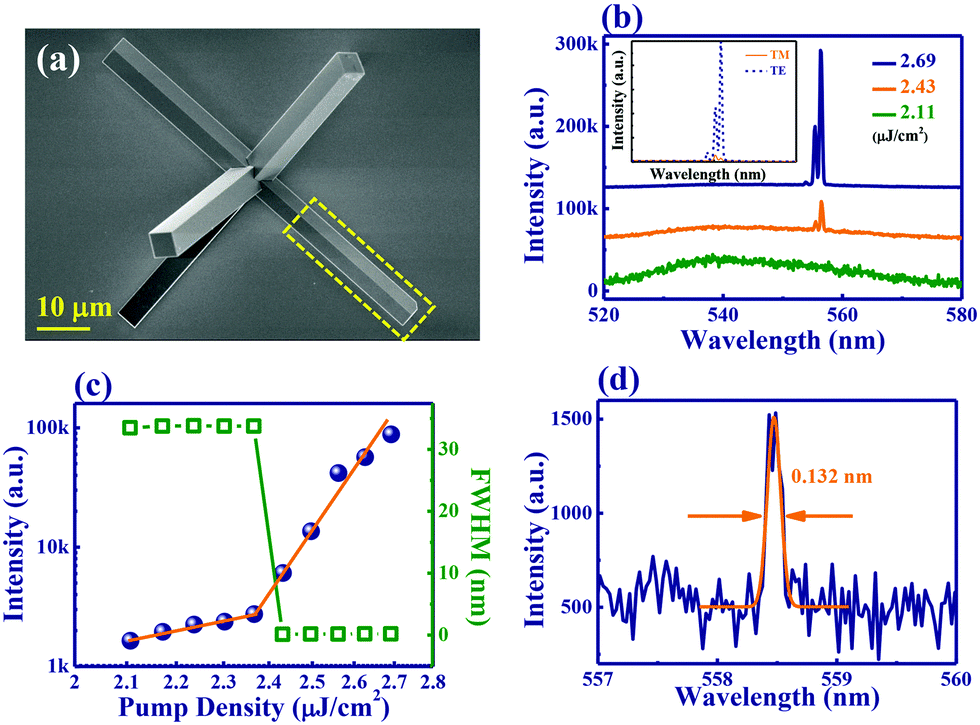 | ||
| Fig. 2 The transverse lasing action. (a) SEM image of the big “cross”. The area under the yellow dashed rectangular box is the optical pumping area. (b) The emission spectra from a selected perovskite microrod under different pumping density. The inset shows the polarization of emitted light. (c) The output intensity (spheres) and FWHM (squares) as a function of pumping density. (d) The laser spectra and fitted FWHM at the threshold. | ||
Then the optical properties of the synthesized microrods were studied by optically exciting them under a home-made micro-photoluminescence system (see Experimental section). We first tested the conventional Fabry–Perot (F–P) modes along one microrod on the substrate. With the increase of pumping power, sharp peaks emerged in the laser spectrum. However, as we have reported recently, these F–P lasers usually have very large FWHM and very low factors (∼a few hundred).12 These kinds of low Q factors can be simply understood. The F–P mode along the axis of the microrod is usually confined by the reflections between two end-facets. While the refractive index of lead halide perovskites is relatively high (n ∼ 2.55), the transmission losses are still large. In this sense, the Q factors of F–P modes along the axis of the microrod are usually low and they are unable to support high Q lasers.
In addition to F–P modes, the cross-sections of perovskite microrods are large enough to support other types of resonances in the transverse plane. In general in microrods or nanorods, such kinds of resonances cannot be excited because F–P modes have much longer amplification lengths. In some particular designs, the F–P modes can be suppressed and the transverse lasing modes can be excited. One example is shown in Fig. 2. From the SEM image in Fig. 2(a), we can see that several microrods join together and form a big cross. As the reflections of waveguide modes between two end-facets will be broken at the joint position, the radiation loss of F–P modes along the arms of the cross increases significantly and the Q factors of F–P modes are strongly reduced. Fig. 2(b) shows the recorded laser spectra of the cross by partially pumping the selected microrod (see Fig. 2(a)). When the pumping density is low, a broad photoluminescence peak is achieved. With the increase of pumping power, a few narrow peaks appeared around 556.4 nm and quickly dominated the emission spectra. One additional laser peak appeared with a further increase in pumping power. The spectra of light emissions from partially pumped microrods are quite different from the reported F–P microrod lasers and are well consistent with the above analysis.
The emergence of narrow peaks usually corresponds to the transition from spontaneous emission to lasing actions. And this kind of transition can be seen more clearly in Fig. 2(c). When the pumping density is below 2.37 μJ cm−2, the slope of output intensity is around 0.8. Once the pumping density is above 2.37 μJ cm−2, the slope dramatically increases to ∼8. The superlinear slope and the sharp peaks clearly demonstrate a threshold behavior at 2.37 μJ cm−2. The squares in Fig. 2(c) illustrate the laser FWHM as a function of pumping density. When the pumping density is below the threshold, the FWHM is over 30 nm, which is well consistent with the spontaneous emission. Once the pumping density is above the threshold, the FWHM is dramatically reduced by more than two orders of magnitude. Due to the band filling effect,23 the FWHM increased again above the threshold. Thus the smallest FWHM at the threshold, which is as small as 0.132 nm, is achieved at the laser threshold. This value is almost half of the previously reported record narrow laser peak and gives a high Q factor around 4200. The FWHM and Q factor can be even further improved by getting rid of the instrumental broadening of our spectrometer (∼0.11 nm).
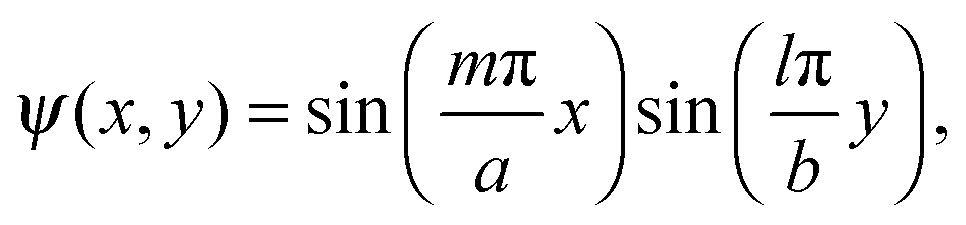
We know a surprising fact that the FWHM can be simply improved by exciting the transverse lasing modes. To understand the experimental observations, we have numerically studied the microrods using finite element method based commercial software (Comsol Multiphysics 3.5a).24 All the parameters of perovskite microrods are taken from SEM images. Considering the situation of microrods, a two-dimensional object has been employed to mimic the lasing properties. Both the width and thickness of the selected microrod under consideration are 1.964 μm. The refractive index of perovskites is fixed at 2.55. As the microrod is standing on one edge, the surrounding medium is set as n = 1. Following the experimental results, only transverse electric (TE) modes are considered. Fig. 3(a) shows the calculated Q factors (Q = Re(ω)/2|Im(ω)|, here ω is the resonant frequency) around the gain spectral region. We can see that most of the resonances have relatively low Q factors except modes 1–3 marked in Fig. 3(a). This is because the resonances inside rectangle shaped microcavities follow the equation:24
 | (1) |
 | ||
| Fig. 3 Resonant modes in the transverse plane of microrods. (a) The calculated Q factors of resonances inside the transverse plane of the microrod marked in Fig. 2(a). (b) The field distribution (|Hz|) of mode-2 in (a). | ||
We note that the high Q factors are not limited in this particular sample. Similar phenomena have been widely observed in a number of microrods. Parts of the results are shown in Fig. 4. Here we excited the transverse lasing modes of microrods suspending in air. The samples could be found from randomly synthesized perovskite microrods or constructed by placing the microrods on a perovskite block with one end suspending in the air via micro-manipulation.12 Because the perovskite block can introduce significant radiation loss in the longitudinal direction, the F–P lasing modes can also be suppressed and transverse modes are excited. From the insets in Fig. 4(b), (d) and (f), we know that these microrods are also quite uniform and flat, providing the chances to reach small FWHM. The experimental results are shown in Fig. 4. While their exact transverse shapes and thresholds are different, their FWHMs at the lasing threshold are always around 0.1 nm. The details of microrod sizes, and measured and numerically calculated Q factors are listed in Table 1. It should be noted that the lasing spectra shown in Fig. 4 were taken above the threshold to maintain a high signal to noise ratio (SNR). Considering the band filling effect,23 the FWHM at the threshold is the smallest. To obtain the exact and true FWHMs, the FWHMs (corresponding to Q factors) in Table 1 are extracted at the lasing threshold. We know that the smallest FWHM can be as small as 0.1 nm, giving a Q factor over 5000. Interestingly, we found that almost all the calculated Q factors were much larger than the experimentally measured values. This means that the current Q factors are limited by the material instead of the cavity shape again and thus they can be further increased by improving the crystal quality.
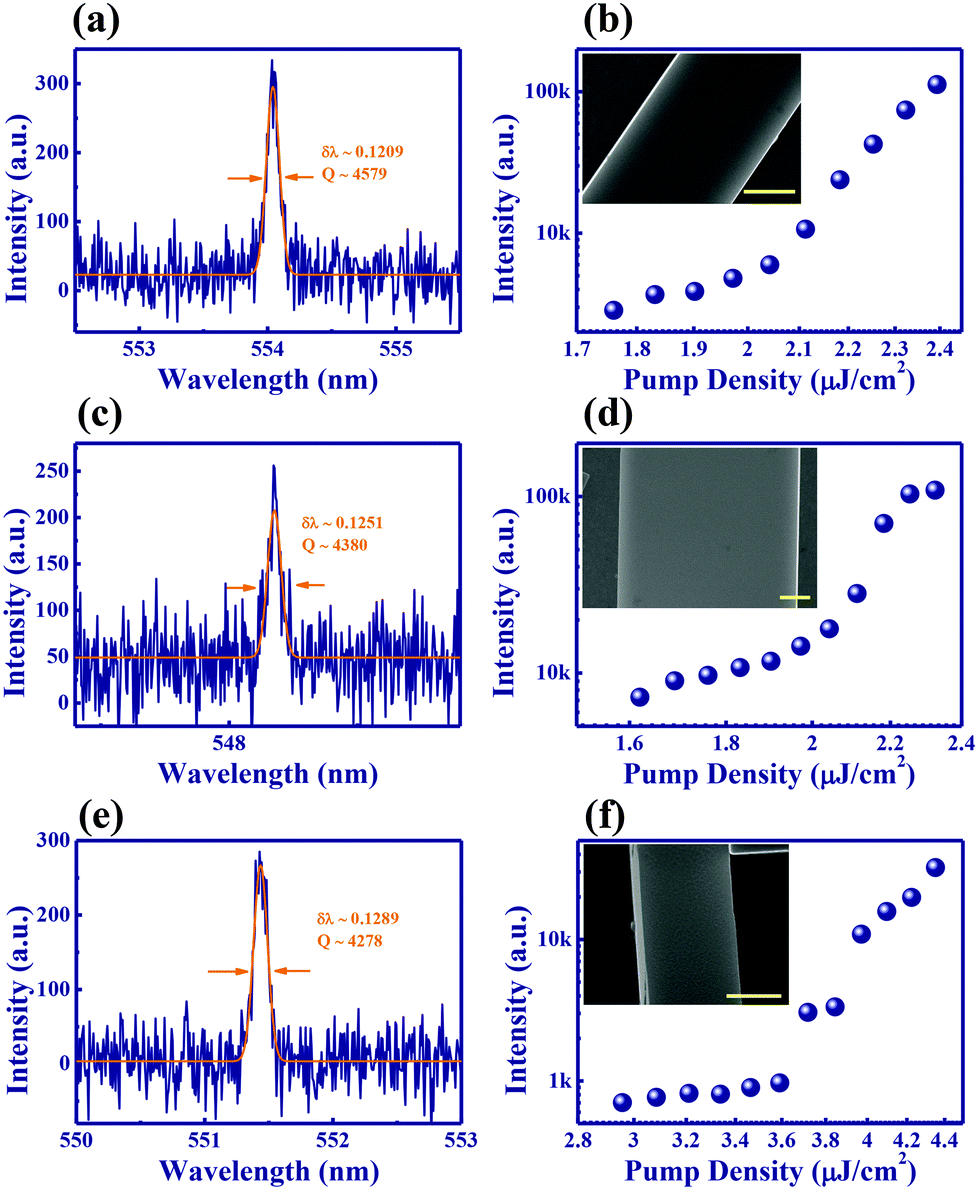 | ||
| Fig. 4 FWHMs in different microrods. (a), (c), and (e) show the laser spectra above the threshold, and (b), (d), (f) show the dependences of output intensities on the pumping densities. The insets are the high resolution SEM images of the measured perovskite microrods and the scale bar is 1 μm. | ||
| Sample # | Width (μm) | Height (μm) | Q_mea | Q_sim |
|---|---|---|---|---|
| 1 | 1.469 | 1.394 | 5968 | 8763 |
| 2 | 1.537 | 1.456 | 5697 | 5175 |
| 3 | 2.573 | 1.897 | 4971 | 27506 |
| 4 | 2.516 | 2.516 | 4846 | 257561 |
| 5 | 1.491 | 1.491 | 4417 | 15744 |
| 6 | 0.895 | 0.895 | 4384 | 4205 |
| 7 | 5.969 | 0.7 | 4380 | 3332 |
| 8 | 1.303 | 1.303 | 4302 | 8973 |
| 9 | 2.886 | 2.886 | 4215 | 330205 |
| 10 | 1.401 | 1.401 | 4207 | 26967 |
One may also wonder why the high Q factors have not been observed in the microplate lasers, whose resonances are also confined by total internal reflections.14–17 In principle, the microplates have much larger cavity sizes and should have much larger simulated Q factors. But the experimentally recorded FWHMs are usually around or far larger than 0.5 nm.14–17 Some values are almost an order of magnitude larger than our observations.14–17 This deviation is generated by the substrate. Different from the microrod in Fig. 2(a), all the microplates are attached on the substrate after the synthesis. Thus the influence of substrates must be considered. Compared with the two-dimensional calculation, there are vertical losses to the substrate. Sometimes, the vertical losses are even much larger. For example, when the microrod in Fig. 3 is placed onto a glass substrate, the Q factor of mode-2 will be degraded by more than an order of magnitude. Once the ITO (n = 1.8) layer on the substrate is considered, the Q factor is even lower. Meanwhile, most substrates cannot be as flat as the single-crystalline samples. Additional scattering losses will also decrease the cavity Q factors. In addition, there are always some flaws in synthesized devices (see insets in Fig. 4(a), (c) and (e)). The transverse modes can be selectively formed at the flawless positions. However, the resonances in microplates and F–P modes in microrods cover most of the devices and cannot fully avoid such scattering centers. Therefore, long-lived resonances are much easier to be formed in the transverse planes of freestanding microrods than F–P modes in microrods and whispering gallery like modes in microplates.
Conclusions
In summary, we have studied the whispering-gallery like modes in the transverse plane of freestanding microrods. The smallest FWHM at the lasing threshold is 0.1 nm, which is several times smaller than the previously reported record values in lead halide perovskite nanorods. And the measured FWHM can even be comparable with GaAs microdisk lasers. Compared with the microplates, perovskite microrods have additional advantages. They can be easily tailored by micro-manipulation to improve the laser performances. In addition, the sizes of perovskite microrods are usually quite uniform. The emitted laser peaks from different positions on the same microrod are almost identical or quite similar. Thus the microrod can be either pumped entirely to achieve high output power or pumped individually to achieve a parallel laser array.32 We believe our finding will be essential for the practical applications of lead-halide perovskite microlasers.Experimental section
The optically pumped lasing experiment was performed on a home-made micro-photoluminescence system. Basically, the samples were placed onto a three-dimensional translation stage and a frequency doubled Ti:Sapphire laser from a regenerative amplifier (400 nm, 1 kHz, 100 fs pulse duration) was focused using a 40× objective lens onto the top-surface of the samples. The emitted light was collected by the same objective lens and coupled to a spectrometer via a multimode fiber. A polarizer was placed in front of the fiber to record the polarization of laser emission.Acknowledgements
The author would like to thank the financial support from National Natural Science Foundation of China under the Grant No. 11374078; Shenzhen Peacock plan (KQCX20130627094615410); and Shenzhen Fundamental research projects (JCYJ20140417172417110, JCYJ20140417172417096).References
- M. A. Green, A. Ho-Baillie and H. J. Snaith, Nat. Photonics, 2014, 8, 506–514 CrossRef CAS.
- A. Kojima, K. Teshima, Y. Shirai and T. Miyasaka, J. Am. Chem. Soc., 2009, 131, 6050–6051 CrossRef CAS PubMed.
- M. M. Lee, J. Teuscher, T. Miyasaka, T. N. Murakami and H. J. Snaith, Science, 2012, 338, 643–647 CrossRef CAS PubMed.
- H.-S. Kim, C.-R. Lee, J.-H. Im, K.-B. Lee, T. Moehl, A. Marchioro, S.-J. Moon, R. Humphry-Baker, J.-H. Yum, J. E. Moser, M. Grätzel and N.-G. Park, Sci. Rep., 2012, 2, 591 Search PubMed.
- N. J. Jeon, J. H. Noh, W. S. Yang, Y. C. Kim, S.-C. Ryu, J.-W. Seo and S. I. Seok, Nature, 2015, 517, 476–480 CrossRef CAS PubMed.
- National Renewable Energy Labs (NREL) efficiency chart, 2015; http://www.nrel.gov/ncpv/images/efficiency_chart.jpg.
- W. S. Yang, J. H. Noh, N. J. Jeon, Y. C. Kim, S.-C. Ryu, J.-W. Seo and S. I. Seok, Science, 2015, 348, 1234–1237 CrossRef CAS PubMed.
- G. C. Xing, N. Mathews, S. S. Lim, N. Yantara, X. F. Liu, D. Sabba, M. Grätzel, S. Mhaisalkar and T. C. Sum, Nat. Mater., 2014, 13, 476–480 CrossRef CAS PubMed.
- F. Deschler, M. Price, S. Pathak, L. E. Klintberg, D. D. Jarausch, R. Higler, S. Hüttner, T. Leijtens, S. D. Stranks, H. J. Snaith, M. Atatüre, R. T. Phillips and R. H. Friend, J. Phys. Chem. Lett., 2014, 5, 1421–1426 CrossRef CAS PubMed.
- H. M. Zhu, Y. P. Fu, F. Meng, X. X. Wu, Z. Z. Gong, Q. Ding, M. V. Gustafsson, M. T. Trinh, S. Jin and X. Y. Zhu, Nat. Mater., 2015, 14, 636–642 CrossRef CAS PubMed.
- Z. Y. Gu, K. Y. Wang, W. Z. Sun, J. K. Li, S. Liu, Q. H. Song and H. Cao, Adv. Opt. Mater., 2016, 4, 472–479 CrossRef CAS.
- K. Y. Wang, Z. Y. Gu, S. Liu, J. K. Li, S. M. Xiao and Q. H. Song, Opt. Lett., 2016, 41, 555–558 CrossRef PubMed.
- W. Z. Sun, K. Y. Wang, Z. Y. Gu, S. M. Xiao and Q. H. Song, Nanoscale, 2016, 8, 8717–8721 RSC.
- Q. Liao, K. Hu, H. H. Zhang, X. D. Wang, J. N. Yao and H. B. Fu, Adv. Mater., 2015, 27, 3405–3410 CrossRef CAS PubMed.
- Q. Zhang, S. T. Ha, X. F. Liu, T. C. Sum and Q. H. Xiong, Nano Lett., 2014, 14, 5995–6001 CrossRef CAS PubMed.
- S. T. Ha, X. F. Liu, Q. Zhang, D. Giovanni, T. C. Sum and Q. H. Xiong, Adv. Opt. Mater., 2014, 2, 838–844 CrossRef CAS.
- X. F. Liu, S. T. Ha, Q. Zhang, M. D. L. Mata, C. Magen, J. Arbiol, T. C. Sum and Q. H. Xiong, ACS Nano, 2015, 9, 687–695 CrossRef CAS PubMed.
- Y. P. Fu, H. M. Zhu, A. W. Schrader, D. Liang, Q. Ding, P. Joshi, L. Y. Hwang, X.-Y. Zhu and S. Jin, Nano Lett., 2016, 16, 1000–1008 CrossRef CAS PubMed.
- B. R. Sutherland, S. Hoogland, M. M. Adachi, C. T. O. Wong and E. H. Sargent, ACS Nano, 2014, 8, 10947–10952 CrossRef CAS PubMed.
- R. Dhanker, A. N. Brigeman, A. V. Larsen, R. J. Stewart, J. B. Asbury and N. C. Giebink, Appl. Phys. Lett., 2014, 105, 151112 CrossRef.
- S. Yakunin, L. Protesescu, F. Krieg, M. I. Bodnarchuk, G. Nedelcu, M. Humer, G. D. Luca, M. Fiebig, W. Heiss and M. V. Kovalenko, Nat. Commun., 2015, 6, 8056 CrossRef CAS PubMed.
- Q. Song, H. Cao, S. T. Ho and G. S. Solomon, Appl. Phys. Lett., 2009, 94, 061109 CrossRef.
- B. Hua, J. Motohisa, Y. Kobayashi, S. Hara and T. Fukui, Nano Lett., 2008, 9, 112–116 CrossRef PubMed.
- S. Liu, Z. Y. Gu, N. Zhang, K. Y. Wang, Q. Lyu, K. Xu, S. M. Xiao and Q. H. Song, J. Lightwave Technol., 2015, 33, 3698–3703 CrossRef.
- J. Wiersig, Phys. Rev. A: At., Mol., Opt. Phys., 2003, 67, 023807 CrossRef.
- Q. H. Song and H. Cao, Phys. Rev. Lett., 2010, 105, 053902 CrossRef CAS PubMed.
- Y. Z. Huang, K. J. Che, Y.-D. Yang, S. J. Wang, Y. Du and Z. C. Fan, Opt. Lett., 2008, 33, 2170–2172 CrossRef CAS PubMed.
- Y. Z. Huang, Y. H. Hu, Q. Chen, S. J. Wang, Y. Du and Z. C. Fan, IEEE Photonics Technol. Lett., 2007, 19, 963–965 CrossRef CAS.
- Q. H. Song, L. Ge, J. Wiersig and H. Cao, Phys. Rev. A: At., Mol., Opt. Phys., 2013, 88, 023834 CrossRef.
- A. W. Poon, F. Courvoisier and R. K. Chang, Opt. Lett., 2001, 26, 632–634 CrossRef CAS PubMed.
- M. Lebental, N. Djellali, C. Arnaud, J.-S. Lauret, J. Zyss, R. Dubertrand, C. Schmit and E. Bogomolny, Phys. Rev. A: At., Mol., Opt. Phys., 2007, 76, 023830 CrossRef.
- Q. Liao, X. Jin, H. H. Zhang, Z. Z. Xu, J. N. Yao and H. B. Fu, Angew. Chem., Int. Ed., 2015, 54, 7037–7041 CrossRef CAS PubMed.
Footnote |
| † These two authors contributed equally to this manuscript. |
| This journal is © the Partner Organisations 2017 |