Polyethylene nano crystalsomes formed at a curved liquid/liquid interface†
Wenda
Wang
,
Mark C.
Staub
,
Tian
Zhou
,
Derrick M.
Smith
,
Hao
Qi
,
Eric D.
Laird
 ,
Shan
Cheng
and
Christopher Y.
Li
*
Department of Materials Science and Engineering, Drexel University, Philadelphia, Pennsylvania 19104, USA. E-mail: chrisli@drexel.edu
First published on 14th November 2017
Abstract
Crystallization is incommensurate with nanoscale curved space due to the lack of three dimensional translational symmetry of the latter. Herein, we report the formation of single-crystal-like, nanosized polyethylene (PE) capsules using a miniemulsion solution crystallization method. The miniemulsion was formed at elevated temperatures using PE organic solution as the oil phase and sodium dodecyl sulfate as the surfactant. Subsequently, cooling the system stepwisely for controlled crystallization led to the formation of hollow, nanosized PE crystalline capsules, which are named as crystalsomes since they mimic the classical self-assembled structures such as liposome, polymersome and colloidosome. We show that the formation of the nanosized PE crystalsomes is driven by controlled crystallization at the curved liquid/liquid interface of the miniemulson droplet. The morphology, structure and mechanical properties of the PE crystalsomes were characterized using scanning electron microscopy, transmission electron microscopy, X-ray diffraction, and atomic force spectroscopy. Electron diffraction showed the single-crystal-like nature of the crystalsomes. The incommensurateness between the nanocurved interface and the crystalline packing led to reduced crystallinity and crystallite size of the PE crystalsome, as observed from the X-ray diffraction measurements. Moreover, directly quenching the emulsion below the spinodal line led to the formation of hierarchical porous PE crystalsomes due to the coupling of the PE crystallization and liquid/liquid phase separation. We anticipate that this unique crystalsome represents a new type of nanostructure that might be used as nanodrug carriers and ultrasound contrast agents.
Introduction
Vesicles are small membrane-enclosed sacks that can store or transport substances and mimic cell membranes on the molecular scale.1 A few elegant cell membrane-mimicking vesicle systems have been reported in the past. For example, liposomes, made of small amphiphilic phospholipids, were first discovered in the 1960s.2 Using synthetic amphiphilic block copolymers as the building molecules, polymersomes3–5 were constructed and the larger molar mass associated with the block copolymer as opposed to lipids led to improved mechanical properties. In most of these reported systems, the assembled molecules are in the liquid state. Because relatively rigid micelles could enhance the much-needed mechanical stability of the structure, and many block copolymers preferred for biomedical applications are semi crystalline, it is of great interest to tailor polymer crystallization to enhance the kinetic stability of these ensembles.6,7 The challenge is to control the crystallization to form a pre-designed non-flat shape at the nanometre scale. Precisely controlling polymer crystallization in these non-flat nanoscale ensembles is extremely difficult, because curved space is incommensurate with typical ordered structures having three-dimensional translational symmetry. Nevertheless, non-flat (twisted and scrolled) crystals are widely reported in polymeric materials, even for bulk crystallization. For example, the famous banded texture of polymer spherulites observed under polarized optical microscopy is attributed to lamellar twisting.8–10 Chiral polymers can also lead to double-twisted chain packing.11–13 Scrolled crystals have also been observed in various systems including PVDF8 and polyamide 66.14 Bowl-shaped crystals made of polychlorotrifluoroethylene, poly(4-methylpentene-1), or triblock copolymers have been reported.15–17 The mechanisms of forming these non-flat lamellar crystals vary. However, these non-flat lamellae suggest that polymer chains are so flexible that even their crystalline form can adapt to relatively complex/curved/twisted topologies.Crystallization at curved space (spherical crystallography) has recently been carefully investigated in the colloid field.18–21 Interesting growth kinetics, defect formation, and packing schemes that are different from those of flat surfaces have been reported.18–21 Growing polymer single crystals at a curved liquid/liquid interface may serve as a model system to investigate the fundamentals of the packing mechanism of polymer crystals at curved interfaces. Polymer single crystals have also been grown with programmed growth and function, and used in applications such as nanoparticle asymmetric functionalization, nanomotors, surface enhanced Raman spectroscopy, catalysis supports, and polymer brush synthesis.22–33 Based on these exciting findings, forming polymer single crystals at curved liquid/liquid interfaces may lead to multifunctional crystalline nanocapsules. Recently, we explored using a miniemulsion method to grow nanosized polymer-single-crystal-like capsules.34 Nanosized poly(L-lactic acid) (PLLA)-single-crystal-like capsules (named as crystalsomes) were successfully formed. This result is encouraging as it shows that the liquid/liquid interface can indeed guide polymer crystal growth.
In this article, we report using the miniemulsion solution crystallization method to grow hydrophobic polyethylene (PE) nanocrystals. Compared with PLLA, PE is chemically more stable and hydrophobic, which is desired for applications that require long-term particle stability. In addition, the crystallization kinetics of PE are faster, and in the phase diagram of PE and common solvents used for PE crystallization, the PE crystallization line intercepts with the binodal line (see the following for details). Controlling crystallization in the emulsion system is therefore much more challenging. To this end, we developed a stepwise crystallization method to avoid liquid/liquid phase separation of the polymer solution within the miniemulsion nanodroplet. The crystal growth was found to be guided by the curved liquid/liquid interface and PE crystalsomes were formed. The curved liquid/liquid interface also significantly affects the polymer crystallinity and crystallite size, which was again attributed to the incommensurateness between the curved space and the preferred translational symmetry. Moreover, for the first time, we show that directly quenching the PE solution to 20 °C for crystallization led to a new type of hierarchical porous crystalsome whose formation was attributed to the coupling of the liquid/liquid phase separation and polymer crystallization.
Experimental
Materials
High density PE (melt index: 12 g min−1), 1,2-dichlorobenzene (DCB), and sodium dodecyl sulfate (SDS) were purchased from Sigma-Aldrich and used as received.Phase diagram of the PE DCB solution
The phase diagram of the PE DCB solution was obtained using the cloud point method. Specifically, a series of PE DCB solutions with different concentrations (from 0.5 wt% to 5.5 wt%) were obtained at 120 °C. The solutions were then slowly cooled down in a clear oil bath until the test tube became turbid.Crystallization of PE at a curved liquid/liquid interface
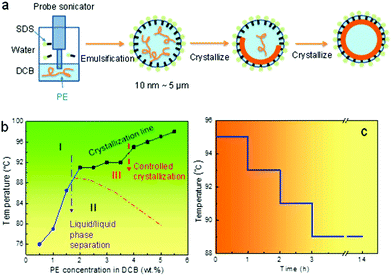
Miniemulsion solution crystallization of the PE DCB system was conducted following a stepwise crystallization process. In brief, 0.8 mL of 4 wt% PE DCB solution was prepared at 120 °C before cooling down to 98 °C at 1 °C min−1. 8.0 mL of 0.2 wt% SDS aqueous solution was separately prepared and equilibrated at 98 °C for 15 minutes. The two solutions were then mixed and subjected to probe sonication using a Vibra cell VC130 probe sonicator for 5 minutes at a 90% amplitude. A white milky emulsion was obtained. The emulsion was either directly quenched to 20 °C for the crystallization, or to 95 °C following a step cooling profile, as shown in Fig. 1, to complete the crystallization process. The latter temperature program was developed in order to avoid liquid/liquid phase separation within the PE DCB emulsion droplets (see later discussion).Characterization
Scanning electron microscopy (SEM) experiments were conducted on a Zeiss Supra 50VP microscope. Transmission electron microscopy (TEM) experiments were performed using a JEOL JEM-2100 LaB6 TEM at an accelerating voltage of 200 kV. Selected area electron diffraction (SAED) patterns of the curved crystals were also obtained using the same instrument but with a 120 kV accelerating voltage. SEM and TEM samples were prepared by drop casting the sample emulsions onto a silicon wafer and copper grid, respectively. The SEM samples were sputtered with Pt/Pd before observation. For TEM tomography, the samples were stained with ruthenium tetroxide (RuO4) for two hours to enhance the contrast. The TEM tomography experiments were conducted using a high-tilt holder. The tilt angle ranged from −60° to +60° with an increment of 1.5°. The tilting series images were aligned using 3dmod and the slice images along the z-axis were exported. Reconstruction was completed using IMOD software and the imaging processing was performed on CTan.Crystalsome powders were used for the wide angle X-ray diffraction (WAXD) experiments using a Rigaku S-MAX 3000 SAXS system. The WAXD patterns were collected using an image plate. The AFM images and force spectra were acquired using a Bruker Dimension Icon AFM. Samples were drop cast on silicon wafers. The cantilever used was a Bruker TESPA with a tip height of 10–15 μm and tip radius of 8 nm. The front angle is 25 ± 2.5°, the back angle is 15 ± 2.5°, and the side angle is 22.5 ± 2.5°. The average spring constant of k = 14.38 N m−1, calibrated by the thermal tune method.
Results and discussion
Fig. 1a illustrates the designed miniemulsion solution crystallization process. After emulsification, small oil droplets ranging from tens of nanometres to microns are created. The size of the droplets can be controlled by the surfactant (SDS) concentration. After quenching the emulsion to a pre-set crystallization temperature, nuclei form first. When the nuclei reach a certain size, the nuclei diffuse to the liquid/liquid interface due to the Pickering effect.35 The crystal growth will then be directed by the liquid/liquid interface. Non-flat polymer crystals can therefore form because of the curved interface. Depending on the initial polymer concentration, robust and partially and fully enclosed single crystal shells can be formed. Note that this process is different from the reported emulsion crystallization process where a polymer melt is used as the crystallisable phase. In those cases, the foci were on how the isolated droplet alters the bulk crystallization/nucleation kinetics of the polymer. For example, crystallization of pure poly(ethylene oxide) (PEO) in narrowly distributed nanodroplets as obtained by the miniemulsion approach has been reported.36 The size of the droplets is in the ∼100 nm range. The small and narrowly distributed droplets show exclusively homogeneous nucleation.37–39 Inside each miniemulsion droplet, 4–5 lamellae are formed which are “not connected and just loosely layered”.36 In the present case, polymer solutions are used to form the nanosized droplet, and the first goal is to direct polymer single crystal growth at the curved liquid/liquid interface. We will then explore the competition between the crystallization and liquid/liquid phase separation.In order to control the crystallization to completion following the above process, and to form the desired crystalsome, phase separation within the droplets should be avoided. When cooling down a semi crystalline polymer solution from high temperature, the liquid/liquid phase separation and crystallization are typically coupled. There have been limited studies on polymer solution crystallization coupled phase separation.8,15,16,40–49 The framework is constructed under the phase diagram where the melting (dissolution)/crystallization line and the phase separation binodal line intercept in the phase diagram.41 To better choose the processing temperatures for our miniemulsion solution crystallization experiments, a phase diagram of PE–DCB was constructed. To this end, a series of PE DCB solutions with concentrations from 0.5 wt% to 5.5 wt% were prepared and cloud points were recorded when cooling these solutions from a high temperature (120 °C). For the 0.5 wt%, 1 wt%, and 1.5 wt% PE–DCB solution, cloud points were observed at 76 °C, 79 °C, and 87 °C, respectively. For the 2 wt% to 5.5 wt% samples, crystallization was observed first in the solution prior to the liquid/liquid phase separation. As plotted in Fig. 1b, the temperature–concentration phase diagram of the PE DCB solution shows two regions: the blue sphere and black square regions of the plot indicate the binodal curve and the crystallization line, respectively. A dashed line was drawn to indicate a full binodal curve.
This phase diagram can therefore guide our design for the crystallization experiments. In region I, the solution is isotropic and stable. In region II, a single phase is unstable: the polymer solution separates into polymer-rich and polymer-poor phases. Cooling the system from region I to III, which is above the binodal curve, will lead to crystallization from a one-phase PE solution and liquid/liquid phase separation can be avoided. If we cool a system from region I, through the binodal curve, to region II, since the liquid/liquid phase separation occurs first, the polymer crystallizes within the phase separated domains. In a miniemulsion system, this liquid/liquid phase separation will lead to a more complex morphology and will be discussed at the end of this paper.
A stepwise cooling profile was chosen for the crystallization process to avoid liquid/liquid phase separation and the formation of multiple nuclei in one droplet. Fig. 1c shows the detailed temperature profile. Starting from 95 °C, the system was subsequently kept for one hour (1 h) at 95 °C, 93 °C, and 91 °C. Crystallization was then conducted overnight at 89 °C to ensure complete crystallization, after which the emulsion was brought to room temperature for characterization.
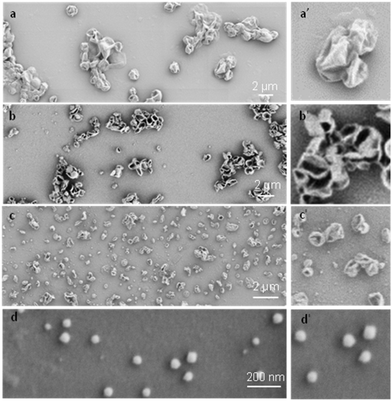
To systematically investigate the curvature effect on the polymer crystallization, crystalsomes with different sizes are desired. In general, surfactants have been used to control the droplet size in miniemulsion systems.50 We therefore varied the SDS concentration in our experiments to tune the crystalsome size, detailed in Table 1. The water to oil volume ratio was kept constant at 10 to 1, the PE concentration was 4 wt%, and four different SDS concentrations were used. The corresponding crystals are named as CSPE-n, where CS denotes crystalsome and n indicates the number index of the sample. Fig. 2 shows the SEM micrographs of the PE crystalsomes from different SDS concentrations; the right column of the figure shows the enlarged images of the corresponding low magnification ones. The crystals are all nearly spherical, in sharp contrast to the classical pyramid shaped PE single crystals, suggesting that PE crystalsomes have been formed. The average crystalsome sizes decrease from 1500 to 450, 250 and 110 nm, due to smaller droplets in the emulsions at higher SDS concentrations. Also note that the crystalsomes (CSPE-1–CSPE-3) show more wrinkled features when the size is large, while CSPE-4 is smooth, because mechanically it is easier to sustain the hollow spherical shape for small sizes.
| Sample name | SDS (wt% to water) | PE (wt% to DCB) | Water–DCB volume ratio | Average diameter (nm) | Crystallinity (%) |
|---|---|---|---|---|---|
| CS PE -1 | 0.1 | 4 | 10–1 | 1500 | 84 |
| CS PE -2 | 0.2 | 4 | 10–1 | 450 | 67 |
| CS PE -3 | 2 | 4 | 10–1 | 250 | 62 |
| CS PE -4 | 26 | 4 | 10–1 | 110 | 49 |
| Flat PE | — | 0.05 | — | — | 84 |
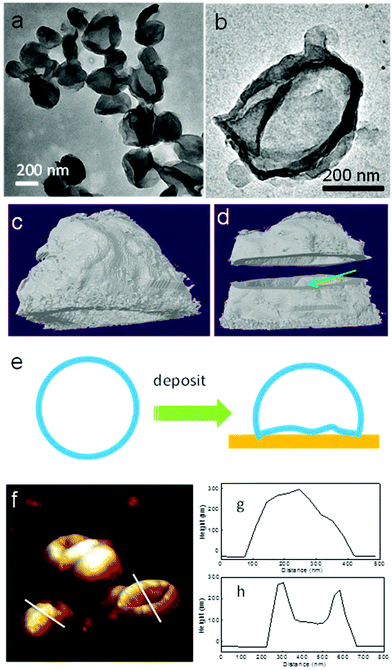
Transmission electron microscopy (TEM) and atomic force microscopy (AFM) techniques have been used to characterize the PE crystalsomes. 2 h of RuO4 staining was used to enhance the contrast between the polymer crystals and the substrate. Fig. 3a and b show the TEM image of CSPE-3. Similar to the SEM images, the TEM micrographs also confirm that the PE crystals adopted a round shape. The edges of the spheres are darker than the interior regions, suggesting that the structure is hollow. The edges are also relatively rough, indicating the crystalline nature of the structure. To better view the 3D structure of the crystalsomes, TEM tomography was employed. A series of images were collected for every 1.5° when the sample was tilted from −60° to +60°. The reconstructed images were obtained using IMOD. Fig. 3b is a bright field image of the crystalsome while Fig. 3c and d show the reconstructed images viewed from different angles (the reconstructed movie is shown in the ESI†). In particular, the shell was cut from the middle line horizontally to reveal the hollow structure, as shown in Fig. 3d. The thickness of the crystal can be estimated to be ∼20 nm. The crystalsome also exhibits a large flat bottom, which is perhaps due to the deformed bottom part of the crystal upon deposition (as illustrated in Fig. 3e). This phenomenon is often seen in polymersome systems.51,52 AFM was also employed to examine the details of the crystalsomes. Fig. 3f shows a 3D view of the height image of CSPE-3. Of interest is that some of the crystals maintained the 3D shape during sample preparation, while some seemingly collapsed and the image mimics a flattened basketball (Fig. 3f). The height profiles are shown in Fig. 3g and h. The height of the capsules is approximately 300 nm. In one crystalsome (Fig. 3h), the top lamella collapses to the bottom surface, and two edges of the height of ∼300 nm can be seen. The collapse may be due to the local capillary force upon sample drying.
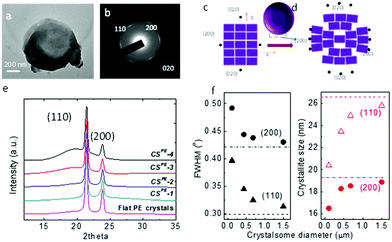
To confirm that the crystalsomes are made of PE single crystals, selected area electron diffraction (SAED) was employed. Fig. 4a and b show a bright TEM image of CSPE-3 and the corresponding SAED pattern. [00l] zone diffraction patterns consisting of (110), (200), and (020) diffraction arcs can be clearly identified based on the orthorhombic unit cell parameters of the PE crystal, a = 0.74 nm, b = 0.49 nm, and c = 0.25 nm,53 suggesting that the crystalsome is a single crystal with one general orientation of the crystal lattice. The arc-shaped diffraction pattern indicates that the crystalline lattice undergoes a continuous and slight change of the lattice orientations. Fig. 4c and d illustrate the unit cell packing on a flat vs. a curved surface. For a flat surface, there is a single lattice orientation within the single crystal, and this typically leads to a spot-shaped SAED pattern. On a curved space, however, while the crystal lattice has a general orientation, starting from the very centre unit cell (represented using the ab plane), as the PE crystal grows, the unit cell continues to splay and form a fan shape to accommodate the curved space. If the crystalsome had a perfect 3D spherical structure, only the very top and bottom point will give the [00l] zone diffraction pattern. The degree of disorientation of the unit cells from the centre to the edge of the crystalsome may be determined by the splay angle within one diffraction arc [e.g. (200)]. However, in our case, the crystal collapsed on the substrate, which makes it difficult to calculate the true splay angle in the undisturbed lattice. Nevertheless, we can conclude that the PE crystalsomes are made of single crystals with one general lattice orientation, which undergoes moderate splaying as the crystal grows to fill in the nanocurved space.
Wide angle X-ray diffraction (WAXD) was used to study the size effect on the crystallization behaviour of the PE crystalsomes. Fig. 4e shows the WAXD patterns of four PE crystalsome samples and that of the flat PE crystals. The two strong diffraction peaks at 21.6° and 23.9° associated with the (110) and (200) planes can be observed in all of the samples, suggesting that the PE crystal structures are retained in these crystalsomes. The amorphous halo underneath the two diffraction peaks, however, became more apparent when the size decreases. The crystallinity can be calculated on the basis of the WAXD results after peak fitting using MagicPlot. As shown in Table 1, compared with the flat PE crystals, the crystallinity does not change for the large size (1500 nm) CSPE-1 (∼84%), however, as the crystalsome size decreased to 450, 250, and 110 nm, the crystallinity decreased to 67, 62, and 49%, respectively, consistent with our hypothesis that a smaller radius of the crystalsome leads to a more highly curved space, which hinders the crystalline packing. In addition, the width of the diffraction peak decreases with the increasing crystalsome size as well. The flat PE crystal has the sharpest diffraction peaks. The full width at half maximum (FWHM) values of the (200) and (110) diffraction peaks were used to quantify the width change. As plotted in the left panel of Fig. 4f, with increasing crystalsome diameter, the FWHM decreases and approaches the value of the flat PE crystals. The corresponding crystallite size within the PE lamellar crystal can be calculated using the Scherrer equation, and the trend is plotted in the right panel of Fig. 4f. The crystallite size decreased by approximately 23% and 14% orthogonal to the (110) and (200) direction, respectively.
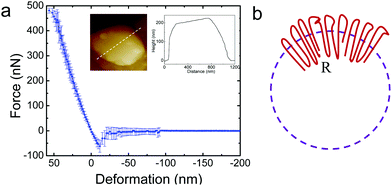
It is of interest to study the mechanical properties of the crystalline capsule, and compare them with those of the polymersome/liposome. To this end, AFM indentation experiments were conducted. The inset in Fig. 5a shows an AFM image of the PE crystalsome that was used for the indentation experiments. This crystalsome has a height of ∼220 and lateral average size of ∼1000 nm according to the height cross sectional analysis (inset). 20 AFM force-displacement curves were collected on this crystalsome and small deformation was applied to ensure that the measured indentation curves were reversible. The results were then converted to force–deformation curves, as shown in Fig. 5a. The membrane stiffness can therefore be calculated by linear fitting the small deformation portion of the curve and the slope of the fitted line is the stiffness. The equation relating the stiffness kmembrane of the membrane with the Young's modulus has been derived in the classical shell theory. The solution of the deformation of a spherical shell under point loads on its pole can be expressed as eqn (1):54,55
 | (1) |
Here, E is the Young's modulus, h is the shell thickness, R is the radius of the shell, and ν is the Poisson ratio. The stiffness can be obtained by linearly fitting the initial part of the force–deformation curve. Therefore, the stiffness was determined to be ∼7.6 ± 1.0 N m−1, obtained from the indentation approaching curves. When using h = 20 nm (based on the TEM experiments), R = 530 nm (based on the AFM measurements), and a Poisson ratio of ∼0.36,56 the PE modulus of the crystalsome can be estimated to be ∼4.0 GPa, which is between the modulus of amorphous (∼2 MPa) and crystalline PE (∼3–6 GPa) at 20 °C.57
The membrane bending modulus Kbend of a capsule of material having a Young's modulus E can be calculated using eqn (2):
 | (2) |
This equation has been widely used to study the mechanical properties of single micro- or nano-capsules52,58–61 and biological specimens.62 Based on the measured stiffness, calculated modulus, and eqn (2), using h = 20 nm, and a Poisson ratio of ∼0.36, we can estimate that the bending modulus of the PE crystalsome is ∼3.1 ± 0.4 × 10⁻¹⁵ J, which is close to that of the PLLA crystalsome, and is a few hundred times greater than those of the reported polymersomes with similar shell thicknesses (e.g. 7.16 ± 1.03 × 10⁻¹⁷ J for polystyrene-b-poly(acrylic acid) with a thickness of 22 ± 1 nm).52,58–61
The significant enhancement of the mechanical properties can be attributed to the unique packing of the polymer chains/defects in the crystalsome. As previously discussed, defects are induced with decreased crystalsome size, and the defects are introduced both along the crystalsome tangential and radial directions. As shown in Fig. 5b, polymer crystals in a curved space/interface have to splay their chains along the radial direction from the inner layer to the outer layer to compensate for the curved geometry. The relative “strain” of the crystalsome between the inner and outer shell can be defined as ε = (co − ci)/ci, where co and ci is the circumference of the outer and inner shell, respectively. For the crystalsome shown in Fig. 5a, ε can be up to 5%. We therefore envisage that larger defects or even amorphous polymer chains should be excluded to the outer layer, serving as “wedges” to facilitate chain packing. This unique arrangement of the defects should account for the high bending modulus observed in our system.
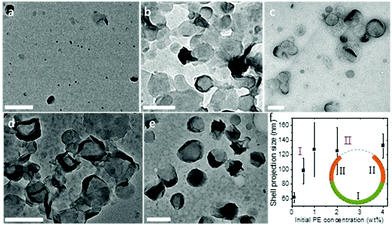
It is also noted that this packing is feasible only because the crystalsome was formed via a nucleation-slow-growth process, and that the defects have sufficient time to arrange and accommodate the curved space at the liquid/liquid interface. The growth process of the PE crystal shells along the curved liquid/liquid interface was monitored by controlling the polymer concentration in the oil phase. With a given droplet size, the polymer concentration determines the final morphology (size) of the crystalsome. Fig. 6 shows the TEM micrographs of PE crystal shells prepared with PE concentrations from 0.1 wt% to 4 wt%. At very low concentration, due to the limited material supply, only very small pieces of curved crystals can be formed in each droplet (Fig. 6a). As the PE concentration increases, the crystals can continue to grow in the droplet. Single layer curved crystals were observed for the 0.5 wt% and 1 wt% samples (Fig. 6b and c). When the concentration reached 2 wt%, although the central regions didn't change too much, the edges show a much higher contrast. This is because the edges were actually edge-on crystals after more polymers were supplied and the crystal growth could be further continued. From the TEM images, we can also obtain the size of the crystalsomes projected along the electron beam direction, as plotted in Fig. 6f. The size increased as the PE concentration increased from 0.1 wt% to 1 wt% and almost stayed constant from 1 wt% to 4 wt%, corresponding to stage I and stage II of the growth. As illustrated in the inset of Fig. 6f, during stage I, starting from a nucleus, the crystal slowly grows until it reaches approximately the hemispherical size of the droplet. In stage II, while the crystal kept growing, since it already exceeded the hemisphere size, the projected size did not increase (while the contrast of the edge of the crystalsome increased).
Up to this point, liquid/liquid phase separation has been strategically avoided before crystallization. However, this system lends itself to examining liquid/liquid phase separation coupled with crystallization in a nanoconfined space, which is an interesting phenomenon to study as this length scale of confinement has been shown to influence the interplay between the two ordering processes and subsequent morphology.41,63 Our system adds a simplicity to this study where the dispersed phase is a polymer/poor solvent system. Therefore, direct comparison to the ordering processes in bulk polymer/solvent systems can be realized with nanoconfinement being the dominate variable. In addition, compared with PLLA, the crystallization kinetics of PE are faster, and in the phase diagram of PE and common solvents used for PE crystallization, the PE crystallization line intercepts with the binodal line. It is therefore feasible to use fast polymer crystallization to arrest the morphology formation that occurred during the liquid/liquid phase separation in the nanodroplets. To examine this, the CSPE-3 crystalsome was prepared, but instead of using the step cooling profile, the emulsion was quenched deeply into the phase separation region to 20 °C. The deep quench was chosen to ensure that the unstable region was reached and that any phase separation that occurred could be attributed to spinodal decomposition. Fig. 7a and b show typical SEM images of the resultant crystals. In the larger droplet, hierarchical porous crystalsome, a morphology resembling the characteristic spatially homogeneous phase separation of spinodal decomposition is observed (Fig. 7b). To explain this, Fig. 7c shows a schematic of the emulsion going through the temperature profile. At high temperature, the emulsion droplets are isotropic solutions, and, when deeply quenched, spinodal decomposition occurs much faster than crystallization. This causes the formation of polymer poor and rich domains, that are blue and orange in Fig. 7c, respectively. Following the phase separation process, the polymer rich domains subsequently crystallize, red in Fig. 7c, and arrest the phase separated morphology. An interesting result is that droplets of 200 nm or less had more spherical shapes that resembled the crystalsomes produced at high temperatures. This could be attributed to a spatial limit of spinodal decomposition being reached. Two possible explanations are (1) the confinement is on a length scale where the phase separation favours the polymer rich domain to be excluded to the interface or (2) the confinement is on a length scale that restricts chain segmental mobility causing restrictions in the chain conformation. The latter would decrease the conformational entropy that could in turn induce chain alignment, subsequently reducing the nucleation barrier and fostering crystallization at the interface. However, this must be experimented on further to elucidate what causes the difference in the morphology.
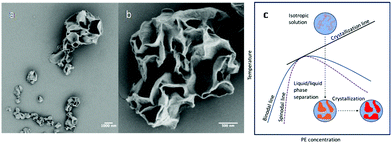 | ||
| Fig. 7 SEM images of CSPE-3 when quenched to 20 °C (a and b); (c) schematic phase separation coupled with crystallization when the emulsion is quenched to 20 °C. | ||
Conclusions
A nanosized PE crystalsome was successfully grown using a miniemulsion solution crystallization method where PE/DCB solution was used as the oil phase, and SDS as the surfactant. The formation mechanism was attributed to directed PE crystallization via the curved liquid/liquid interface. The average diameter of the crystalsome was controlled from 1500 to 110 nm by tuning the SDS concentration. SAED experiments confirmed the single crystal-like nature of the crystalsome, and WAXD experiments showed that the crystallinity and crystallite size increased with the diameter of the crystalsome. It was observed that the bending modulus of the PE crystalsomes was a few hundred fold greater compared with that of classical polymersomes with similar wall thicknesses, which was attributed to the defects packing in the crystalsome during the slow crystallization process. Furthermore, hierarchical porous PE crystalsomes were obtained by deep quenching the solution directly to 20 °C, which was attributed to the competition between the PE crystallization and liquid/liquid phase separation. We anticipate that this novel nanostructure can shed light on studying spherical crystallography. This nanostructure can also be used as hollow capsules for various applications such as drug carriers and ultrasound contrast agents.Conflicts of interest
There are no conflicts to declare.Acknowledgements
This work was supported by the National Science Foundation Grant DMR-1308958 and DMR 1709136.Notes and references
- Structure and Dynamics of Membranes—From Cells to Vesicles, ed. R. Lipowsky and E. Sackmann, Elsevier Science, Amsterdam, 1995 Search PubMed.
- K. Holmberg and B. Jönsson, Surfactants and polymers in aqueous solution, John Wiley & Sons, 2003 Search PubMed.
- B. M. Discher, Y.-Y. Won, D. S. Ege, J. C.-M. Lee, F. S. Bates, D. E. Discher and D. A. Hammer, Science, 1999, 284, 1143–1146 CrossRef CAS PubMed.
- D. E. Discher and A. Eisenberg, Science, 2002, 297, 967–973 CrossRef CAS PubMed.
- H. Kukula, H. Schlaad, M. Antonietti and S. Förster, J. Am. Chem. Soc., 2002, 124, 1658–1663 CrossRef CAS PubMed.
- K. Rajagopal, A. Mahmud, D. A. Christian, J. D. Pajerowski, A. E. X. Brown, S. M. Loverde and D. E. Discher, Macromolecules, 2010, 43, 9736–9746 CrossRef CAS PubMed.
- P. P. Ghoroghchian, G. Li, D. H. Levine, K. P. Davis, F. S. Bates, D. A. Hammer and M. J. Therien, Macromolecules, 2006, 39, 1673–1675 CrossRef CAS PubMed.
- B. Lotz and S. Z. D. Cheng, Polymer, 2005, 46, 577–610 CrossRef CAS.
- H. D. Keith and F. J. Padden, Macromolecules, 1996, 29, 7776–7786 CrossRef CAS.
- H. D. Keith, F. J. Padden, B. Lotz and J. C. Wittmann, Macromolecules, 1989, 22, 2230–2238 CrossRef CAS.
- C. Y. Li, S. Z. D. Cheng, J. J. Ge, F. Bai, J. Z. Zhang, I. K. Mann, F. W. Harris, L. C. Chien, D. H. Yan, T. B. He and B. Lotz, Phys. Rev. Lett., 1999, 83, 4558–4561 CrossRef CAS.
- C. Y. Li, S. Z. D. Cheng, J. J. Ge, F. Bai, J. Z. Zhang, I. K. Mann, L. C. Chien, F. W. Harris and B. Lotz, J. Am. Chem. Soc., 2000, 122, 72–79 CrossRef CAS.
- C. Y. Li, S. Z. D. Cheng, X. Weng, J. J. Ge, F. Bai, J. Z. Zhang, B. H. Calhoun, F. W. Harris, L. C. Chien and B. Lotz, J. Am. Chem. Soc., 2001, 123, 2462–2463 CrossRef CAS PubMed.
- W. Cai, C. Y. Li, L. Li, B. Lotz, M. Keating and D. Marks, Adv. Mater., 2004, 16, 600–605 CrossRef CAS.
- J. D. Barnes and F. Khoury, J. Res. Natl. Bur. Stand., Sect. A, 1974, 78, 363–373 CrossRef CAS.
- F. Khoury and J. D. Barnes, J. Res. Nat. Bur. Stand., Sect. A, 1979, 76, 225–252 Search PubMed.
- H. Xiong, C.-K. Chen, K. Lee, R. M. Van Horn, Z. Liu, B. Ren, R. P. Quirk, E. L. Thomas, B. Lotz, R.-M. Ho, W.-B. Zhang and S. Z. D. Cheng, Macromolecules, 2011, 44, 7758–7766 CrossRef CAS.
- A. R. Bausch, M. J. Bowick, A. Cacciuto, A. D. Dinsmore, M. F. Hsu, D. R. Nelson, M. G. Nikolaides, A. Travesset and D. A. Weitz, Science, 2003, 299, 1716–1718 CrossRef CAS PubMed.
- M. J. Bowick and L. Giomi, Adv. Phys., 2009, 58, 449–563 CrossRef CAS.
- N. A. Garcia, A. D. Pezzutti, R. A. Register, D. A. Vega and L. R. Gomez, Soft Matter, 2015, 11, 898–907 RSC.
- E. A. Matsumoto, D. A. Vega, A. D. Pezzutti, N. A. Garcia, P. M. Chaikin and R. A. Register, Proc. Natl. Acad. Sci. U. S. A., 2015, 112, 12639–12644 CrossRef CAS PubMed.
- J. Liang, Y. Huang, L. Zhang, Y. Wang, Y. Ma, T. Guo and Y. Chen, Adv. Funct. Mater., 2009, 19, 2297–2302 CrossRef CAS.
- B. B. Wang, B. Li, B. Dong, B. Zhao and C. Y. Li, Macromolecules, 2010, 43, 9234–9238 CrossRef CAS.
- B. Dong, D. L. Miller and C. Y. Li, J. Phys. Chem. Lett., 2012, 3, 1346–1350 CrossRef CAS PubMed.
- B. Dong, W. Wang, D. L. Miller and C. Y. Li, J. Mater. Chem., 2012, 22, 15526–15529 RSC.
- T. Zhou, B. Wang, B. Dong and C. Y. Li, Macromolecules, 2012, 45, 8780–8789 CrossRef CAS.
- B. Dong, T. Zhou, H. Zhang and C. Y. Li, ACS Nano, 2013, 7, 5192–5198 CrossRef CAS PubMed.
- T. Zhou, B. Dong, H. Qi, S. Mei and C. Y. Li, J. Polym. Sci., Part B: Polym. Phys., 2014, 52, 1620–1640 CrossRef CAS.
- S. Cheng, D. M. Smith and C. Y. Li, Macromolecules, 2014, 47, 3978–3986 CrossRef CAS.
- B. Li and C. Y. Li, J. Am. Chem. Soc., 2007, 129, 12–13 CrossRef CAS PubMed.
- B. B. Wang, B. Li, B. Zhao and C. Y. Li, J. Am. Chem. Soc., 2008, 130, 11594–11595 CrossRef CAS PubMed.
- H. Qi, W. Wang and C. Y. Li, ACS Macro Lett., 2014, 3, 675–678 CrossRef CAS.
- T. Zhou, H. Qi, L. Han, D. Barbash and C. Y. Li, Nat. Commun., 2016, 7, 11119 CrossRef PubMed.
- W. Wang, H. Qi, T. Zhou, S. Mei, L. Han, T. Higuchi, H. Jinnai and C. Y. Li, Nat. Commun., 2016, 7, 10599 CrossRef CAS PubMed.
- S. U. Pickering, J. Chem. Soc., 1907, 91, 2001 RSC.
- A. Taden and K. Landfester, Macromolecules, 2003, 36, 4037–4041 CrossRef CAS.
- M. V. Massa, J. L. Carvalho and K. Dalnoki-Veress, Eur. Phys. J. E, 2003, 12, 111–117 CrossRef CAS PubMed.
- M. V. Massa and K. Dalnoki-Veress, Phys. Rev. Lett., 2004, 92, 255509 CrossRef PubMed.
- G. Reiter, G. Castelein, J. U. Sommer, A. Rottele and T. Thurn-Albrecht, Phys. Rev. Lett., 2001, 87, 226101 CrossRef CAS PubMed.
- A. Keller and S. Z. D. Cheng, Polymer, 1998, 39, 4461–4487 CrossRef.
- P. Schaaf, B. Lotz and J. C. Wittmann, Polymer, 1987, 28, 193–200 CrossRef CAS.
- A. L. Demirel, M. Meyer and H. Schlaad, Angew. Chem., Int. Ed., 2007, 46, 8622–8624 CrossRef CAS PubMed.
- N. Morimoto, R. Obeid, S. Yamane, F. M. Winnik and K. Akiyoshi, Soft Matter, 2009, 5, 1597–1600 RSC.
- R. Obeid, F. Tanaka and F. M. Winnik, Macromolecules, 2009, 42, 5818–5828 CrossRef CAS.
- H. Schlaad, C. Diehl, A. Gress, M. Meyer, A. L. Demirel, Y. Nur and A. Bertin, Macromol. Rapid Commun., 2010, 31, 511–525 CrossRef CAS PubMed.
- C. Diehl, P. Cernoch, I. Zenke, H. Runge, R. Pitschke, J. Hartmann, B. Tiersch and H. Schlaad, Soft Matter, 2010, 6, 3784–3788 RSC.
- W. B. Hu and D. Frenkel, Macromolecules, 2004, 37, 4336–4338 CrossRef CAS.
- W. B. Hu, D. Frenkel and V. B. F. Mathot, J. Chem. Phys., 2003, 118, 10343–10348 CrossRef CAS.
- L. Zha and W. Hu, Polymer, 2009, 50, 3828–3834 CrossRef CAS.
- K. Landfester, N. Bechthold, F. Tiarks and M. Antonietti, Macromolecules, 1999, 32, 5222–5228 CrossRef CAS.
- J. P. Patterson, A. M. Sanchez, N. Petzetakis, T. P. Smart, T. H. Epps, III, I. Portman, N. R. Wilson and R. K. O'Reilly, Soft Matter, 2012, 8, 3322–3328 RSC.
- K. Jaskiewicz, M. Makowski, M. Kappl, K. Landfester and A. Kroeger, Langmuir, 2012, 28, 12629–12636 CrossRef CAS PubMed.
- L. Yin, J. Chen, X. Yang and E. Zhou, Polymer, 2003, 44, 6489–6493 CrossRef CAS.
- E. Reissner, J. Math. Phys., 1946, 25, 22 Search PubMed.
- E. Reissner, J. Math. Phys., 1946, 25, 6 Search PubMed.
- C. Y. Xu and M. Matsuo, Macromolecules, 1999, 32, 3006–3016 CrossRef CAS.
- B. Crist, C. J. Fisher and P. R. Howard, Macromolecules, 1989, 22, 1709–1718 CrossRef CAS.
- Q. Chen, H. Schonherr and G. J. Vancso, Soft Matter, 2009, 5, 4944–4950 RSC.
- A. Fery and R. Weinkamer, Polymer, 2007, 48, 7221–7235 CrossRef CAS.
- J. P. Best, M. P. Neubauer, S. Javed, H. H. Dam, A. Fery and F. Caruso, Langmuir, 2013, 29, 9814–9823 CrossRef CAS PubMed.
- Z. Drira and V. K. Yadavalli, J. Mech. Behav. Biomed. Mater., 2013, 18, 20–28 CrossRef CAS PubMed.
- S. Kasas, G. Longo and G. Dietler, J. Phys. D: Appl. Phys., 2013, 46, 133001 CrossRef.
- E. Torino, R. Aruta, T. Sibillano, C. Giannini and P. A. Netti, Sci. Rep., 2016, 6, 32727 CrossRef PubMed.
Footnote |
| † Electronic supplementary information (ESI) available: TEM tomography reconstructed movie. See DOI: 10.1039/c7nr08106e |
| This journal is © The Royal Society of Chemistry 2018 |

