
 Open Access Article
 This Open Access Article is licensed under a
 Creative Commons Attribution 3.0 Unported Licence
Tuning the Seebeck coefficient of naphthalenediimide by electrochemical gating and doping†
Qusiy H.
Al-Galiby
 *ab,
Hatef
Sadeghi
a,
David Zsolt
Manrique
c and
Colin J.
Lambert
*a
*ab,
Hatef
Sadeghi
a,
David Zsolt
Manrique
c and
Colin J.
Lambert
*a
aDepartment of Physics, Lancaster University, Lancaster, LA1 4YB, UK. E-mail: c.lambert@lancaster.ac.uk; qusiy.algaliby@qu.edu.iq
bDepartment of Physics, College of Education, University of Al-Qadisiyah, 58002 Iraq
cDepartment of Electronic & Electrical Engineering - Photonics Group, University College London, UK
First published on 23rd March 2017
Abstract
We investigate the sign and magnitude of the single-molecule Seebeck coefficient of naphthalenediimide (NDI) under the influence of electrochemical gating and doping. The molecule consists of a NDI core with two alkyl chains in the bay-area position, connected to gold electrodes via benzothiophene (DBT) anchor groups. By switching between the neutral, radical and di-anion charge states, we are able to tune the molecular energy levels relative to the Fermi energy of the electrodes. The resulting single-molecule room-temperature Seebeck coefficents of the three charge states are −294.5 μV K−1, 122 μV K−1 and 144 μV K−1 respectively and the room-temperature power factors are 4.4 × 10⁻⁵ W m−1 K−2, 3 × 10⁻⁵ W m−1 K−2 and 8.2 × 10⁻⁴ W m−1 K−2. As a further strategy for optimising thermoelectric properties, we also investigate the effect on both phonon and electron transport of doping the NDI with either an electron donor (TTF) or an electron acceptor (TCNE). We find that doping by TTF increases the room-temperature Seebeck coefficient and power factor from −73.7 μV K−1 and 2.6 × 10⁻⁷ W m−1 K−2 for bare NDI to −105 μV K−1 and 3.6 × 10⁻⁴ W m−1 K−2 in presence of TTF. The low thermal conductance of NDI-TTF, combined with the higher Seebeck coefficient and higher electrical conductance lead to a maximum thermoelectric figure of merit of ZT = 1.2, which is higher than that of bare NDI in several orders of magnitude. This demonstrates that both the sign and magnitude of NDI Seebeck coefficient can be tuned reversibly by electrochemical gating and doping, suggesting that such redox active molecules are attractive materials for ultra-thin-film thermoelectric devices.
Introduction
The Seebeck effect can be used to create electricity from a variety of sources of waste heat such as data farms and automobile exhausts and the inverse process (i.e. the Peltier effect) can be exploited in cascade coolers for on-chip cooling of electronic devices.1–3 However the more widespread application of these effects is limited by the poor performance of available materials1 and therefore research aimed at identifying the parameters that control the efficiency of thermoelectric materials is intensifying.4–11 One approach involves exploiting the room-temperature properties of single-molecules attached to nanogap electrodes and identifying strategies for controlling their thermoelectric properties.12,13 Since the Seebeck coefficient of inorganic nanostructures such as nanotubes, nanowires and nanodots can be tuned by electrostatic gating,14–21 it is natural to explore the response of organic single-molecule junctions to an external electric field, induced by electrochemical gating or charge transfer complexation with dopants. For this purpose, redox-active molecules such as viologen or naphthalenediimide (NDI) (Fig. 1) are attractive candidates, since their charge state can be changed with a relatively-low electrochemical potential.22 From the point of view of optimising thermoelectric properties, junctions formed from such molecules are of interest, because by controlling the number of electrons on the molecule, it should be possible to tune the molecular energy levels relative to the Fermi energy EF of the electrodes,23 leading to transport resonances, which enhance the thermopower. In what follows, we shall demonstrate that this is indeed the case and that large positive and negative thermopowers are achievable. On the other hand, although electrochemical gating is an interesting research tool for probing transport properties, it is not useful for the purpose of creating high-performance thermoelectric devices formed from molecular films, since the electrochemical environment would conductance heat and reduce the efficiency of the film. Therefore after demonstrating the efficacy of electrochemical gating, we proceed to examine the effect of doping by the electron donor TTF and the electron acceptor TCNE and demonstrate that doping is a viable route to large Seebeck coefficients and large thermoelectric efficiencies. | ||
| Fig. 1 An optimized single-molecule junction formed from a NDI molecule attached to gold electrodes. | ||
To model the effect of electrochemical gating, the charge state of the NDI molecule was controlled by introducing a charge double layer (CDL) in the vicinity of the NDI backbone, as shown in Fig. 2. In the absence of the CDL, the NDI possesses a small negative charge and therefore as shown in Fig. 2a, to induce the charge-neutral state the negative charges of the CDL dipoles point towards the NDI backbone. The radical anion and di-anion states are then produced by reversing the CDL dipoles and adjusting the average distance y of the closest CDL ions from the NDI backbone.
 | ||
| Fig. 2 Junction geometries with charge double layers (CDLs) corresponding to three charge states of the NDI: (a) the neutral state (b) the radical anion and (c) the radical di-anion state. | ||
To model the fluctuating environment encountered by molecules in the presence of a CDL, results were obtained for several different CDL arrangements, in which the anions and cations were randomly arranged at a fixed distance y. For each choice of y, the transmission coefficient Tσ(E) for electrons of energy E, spin σ = [↑, ↓] passing through the molecule from one electrode to the other was calculated from which the electrical conductance, Seebeck coefficient were obtained (see Methods). If the electrical conductance and Seebeck coefficient for the ith CDL arrangement are denoted Gi and Si respectively, then two distinct ensemble-averaged Seebeck coefficients are of interest, which we denote <S> and ![[S with combining macron]](https://www.rsc.org/images/entities/i_char_0053_0304.gif) . The first is the straightforward average Seebeck coefficient The first is the straightforward average
. The first is the straightforward average Seebeck coefficient The first is the straightforward average 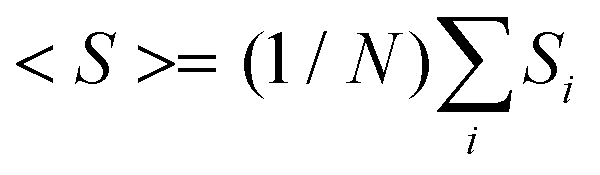 , where N is the number of CDL arrangements. The second is a “conductance-weighted ensemble average,” given by = <GS>/<G>. As discussed in ref. 24, is the relevant quantity when using single-molecule Seebeck coefficients to estimate the Seebeck coefficient of a dilute thin film of such molecules. For each of the three NDI charge states, Fig. 3a–c show the average conductance <G>, the average Seebeck coefficient <S> and conductance-weighted Seebeck coefficient as functions of temperature, obtained using the DFT-predicted Fermi energy EDFTF (see Methods). The computed trend in <G> (Fig. 3c) agrees well with experimental measurements,22 whereas there exist currently no measurements for <S> and . Fig. 3a shows that both the sign and magnitude of the average thermopower are sensitive to the charge state of the NDI, taking room-temperature values of −295 μV K−1, +122 μV K−1 and +144 μV K−1 for the neutral, anion and di-anion states respectively. It is interesting to note that if the Fermi energy is initially near the middle of the HOMO–LUMO gap, then a negative Seebeck coefficient S is expected as the molecule becomes more negatively charged and the LUMO moves closer to the Fermi energy. For example in Fig. S2a,† if the LUMO decreased in energy by no more than 0.1 eV, then S would become more negative. However such a shift involves only a small change in the charge on the molecule. Changing the redox state such that the NDI gains one or two electrons creates a much more significant change in the electronic structure of the molecule. For example comparison between Fig. S2a and S2c† shows that the original LUMO completely passes below the Fermi energy, thereby changing the slope of the transmission function from positive to negative and S from negative to positive. This significant change in electronic structure has been experimentally verified by the order of magnitude differences between the measured conductances of the three redox states.22
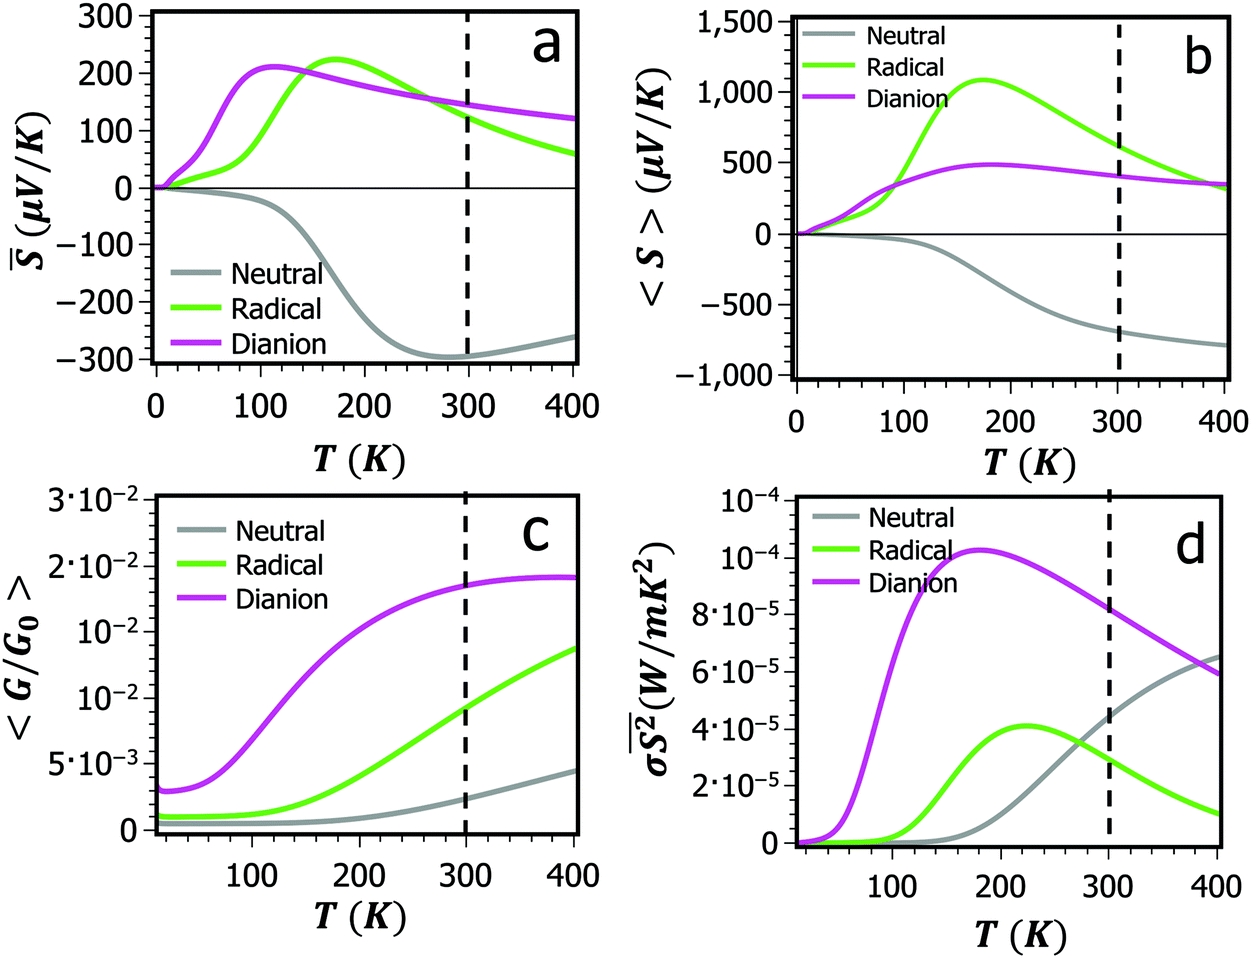 | ||
| Fig. 3 (a, b and c) show the averaged quantities , <S> and <G> respectively for junction geometries with double layers located at distances y = 5 Å, y = 5.8 Å and y = 4.05 Å. (d) shows the corresponding power factor σ2. All quantities are plotted as a function of temperature and obtained using the DFT-predicted Fermi energy EDFTF. The colour code refers to the three different states, NDI-N (grey), NDI-R (green) and NDI-D (pink). | ||
A crucial quantity determining the efficiency of a bulk thermoelectric material is the dimensionless figure of merit ZT = PT/κ, where P = σ2 is the power factor, σ is the electrical conductivity and κ is the thermal conductivity due to both phonons and electrons. In an electrochemical environment, ZT is not relevant, because κ will be determined by heat flows through the electrochemical medium. However the numerator of ZT (i.e. the power factor P) is of interest.
The notion of conductivity is not applicable to transport through single molecules, but to compare with literature values for bulk materials, we define σ = <G> L/A, where L and A are equal to the length and the cross-sectional area of the molecule respectively. Using the values L = 3.6 nm and A = 1.4 nm2 yields the results in Fig. 3d, which show that at low temperature, the anion and di-anion states have the highest power factors. The room-temperature power factors of between 20 and 80 μW m−1 K−2 compare favourably with power factors of other organic materials, whose reported values range from 0.016 μW m−1 K−2 and 0.045 μW m−1 K−2 for polyaniline and polypyrole respectively,25 to 12 μW m−1 K−2 for PEDOT:PSS26 and 12 μW m−1 K−2 for C60/Cs2Co3 Dph-BDT.27
Fig. 4a, b and c, 5d show results for the room-temperature ensemble-averaged electrical conductances <G>, Seebeck coefficient (thermopower) and power factor σ2. It is well-known that DFT can give inaccurate value for the Fermi energy and therefore Fig. 4a–c show corresponding results for a range of Fermi energies EF relative to the DFT-predicted Fermi energy EDFTF.
 | ||
| Fig. 4 (a, b and c) show The room-temperature ensemble-averaged electrical conductances <G>, thermopower and power factor σ2 plotted for a range of Fermi energies EF relative to the DFT-predicted Fermi energy EDFTF for each NDI charge state. The grey curve shows the neutral state, the green curve is the anion state and the magenta curve is the di-anion state. | ||
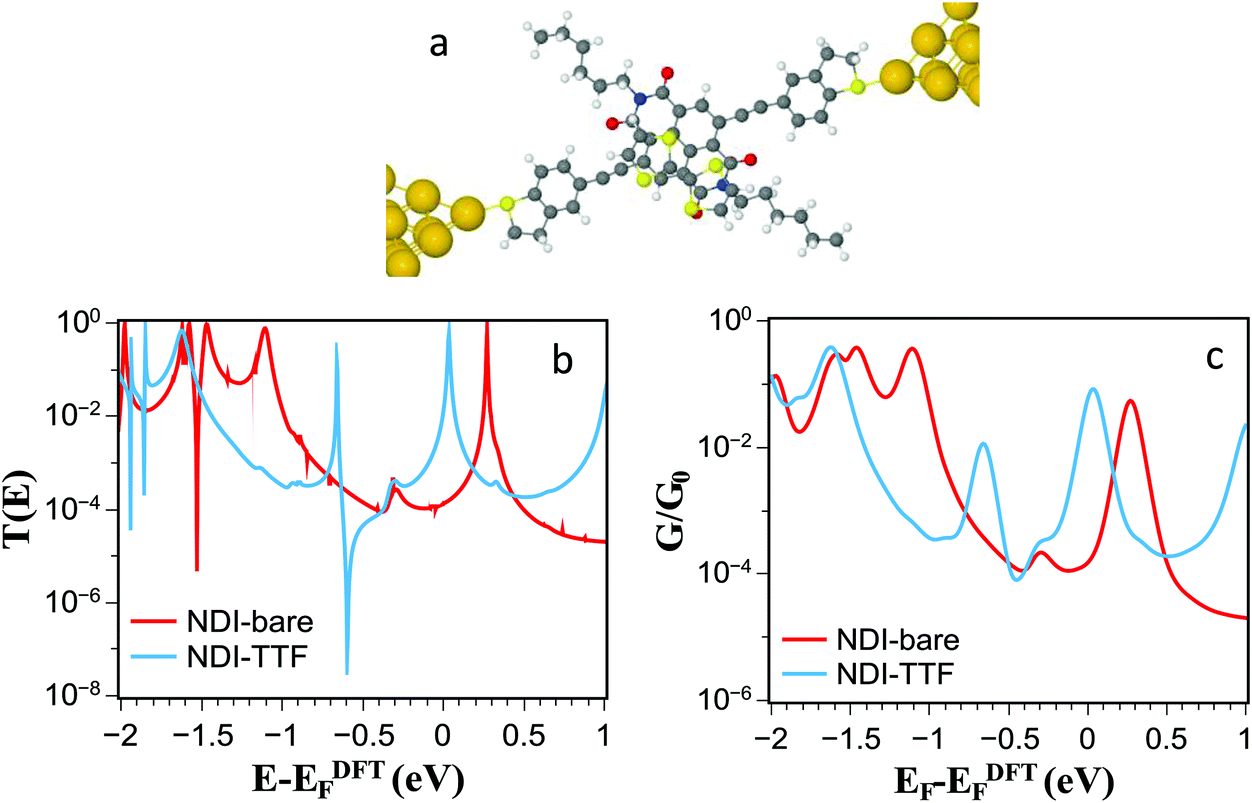 | ||
| Fig. 5 (a) An NDI molecule complexed with TTF. (b) Transmission coefficients as a function of energy for the NDI (red) and NDI-TTF (blue). (b) Room-temperature electrical conductance for the bare NDI (red) and NDI-TTF (blue). | ||
Although control of thermoelectric properties by electrochemical gating is a versatile research tool for fundamental studies, parasitic heat conduction by the electrolyte means that the resulting ZT would be low. To avoid this feature, we now study how phonon and electron transport can be tuned using charge transfer complexation with the electron donor TTF and the acceptor TCNE.
Fig. 5a shows an example of NDI complexed with TTF, whose electron transmission coefficient (blue curve in Fig. 5b) leads to the room-temperature electrical conductance shown in Fig. 5c (blue curve). For comparison, the red curves show corresponding results for bare NDI.
Fig. 5a shows that at E − EDFTF = −0.6 eV, the interaction between a bound state on the TTF and the extended states of the NDI backbone produces a Fano resonance (i.e. a sharp resonance, accompanied by an anti-resonance) Fig. 5 also shows that the TTF also shifts the position of the LUMO and HOMO resonances of NDI molecule to lower energies, reflecting the fact that (see Table 1) the TTF acts as a positively charged electrostatic gate. The Mott formula tells us that the Seebeck coefficient is proportional to the slope of the transmission coefficient T(E) at the Fermi energy and as demonstrated in Fig. 5b, the shift from the undoped (red) transmission curve to the doped (blue) curve increases the slope at E = EDFTF, leading to an increase in the Seebeck coefficient at low temperatures, as shown in Fig. 6b. High-Seebeck coefficients after n-doping are not unprecedented in organic semiconductors. For example,28 Schlitz et al.29 demonstrated that n-doping of napthalenedicarboximide-bithiophene copolymer P(NDIOD-T2) leads to a high negative Seebeck coefficient of −850 μV K−1. In contrast, calculations in the presence of TCNE (see ESI†) show that the latter acts as a negatively-charged electrostatic gate and shifts molecular resonances to higher energies. In this case, the doping is unfavourable, because centre of the HOMO–LUMO gap is shifted towards the DFT-predicted Fermi energy, thereby lowering the slope of T(E) and the value of the Seebeck coefficient relative to the bare NDI.
 | ||
| Fig. 6 (a) and (c) Room-temperature Seebeck coefficients and power factors versus Fermi energy for bare and TTF-doped NDI. (b) and (d) Seebeck coefficients and power factors versus temperature, evaluated using the DFT-predicted value of the Fermi energy. | ||
| ΔN | ΔE (eV) | D (Å) | |
|---|---|---|---|
| TTF | 0.322 | −0.807 | 3.25 |
Fig. 6 shows the resulting Seebeck coefficients S and power factors σS2 of bare and TTF-doped NDI. Fig. 6a and c show results for a range of Fermi energies EF relative to the DFT-predicted Fermi energy EDFTF, whereas Fig. 6b and d show the corresponding results for a range of temperature, evaluated at the DFT Fermi energy. Fig. 6b show that NDI with TTF have the highest power factor of 3.6 × 10⁻⁴ W m−1 K−2. As shown in the ESI,† in the TCNE-doped NDI, LUMO resonance is shifted outward DFT Fermi energy and therefore both thermopower and electrical conductance is reduced in the vicinity of the DFT-predicted Fermi energy. Therefore, to obtain full ZT, we consider TTF-doped NDI by calculating the phonon contribution to thermal conductance.
Following the method in ref. 6, we calculate the vibrational properties of the bare NDI and TTF-doped NDI by constructing the dynamical matrix Dij = (Fqi(δq′j) − Fqj(−δq′j))/2Mijδq′j where F and M are the force and mass matrices and δq′ = 0.01 Å is each atom displacement from optimised geometry in positive and negative x, y, and z directions. For a molecule within a junction, the dynamical matrix describes an open system composed of the molecule and two semi-infinite electrodes and is used to calculate the phonon transmission coefficient Tph(ω) for phonons with energy ħω passing through the bare NDI and TTF-doped NDI from the right to the left electrodes as shown in Fig. 7.
 | ||
| Fig. 7 Phonon transmission coefficients for bare and TTF-doped NDI. | ||
The thermal conductance due to the phonons could be calculated from the phononic transmission coefficient Tph (ω) as:  where fBE(ω, T) is Bose–Einstein distribution function. From the phonon and electron transmission coefficients of Fig. 7 and 5 respectively, we obtain the phonon and electron contributions to the thermal conductance shown in Fig. 8.
 | ||
| Fig. 8 Electron and phonon contributions to the thermal conductance of bare and TTF-doped NDI. | ||
When added together to yield the total thermal conductance, these results combine with those of Fig. 5 and 6 to yield the thermoelectric figure of merit ZT shown in Fig. 9, which reveals that in the presence of TTF doping, for Fermi energies within 0.1 eV of the DFT-value, a ZT of order 1.2 is achievable.
 | ||
| Fig. 9 (a) Room-temperature ZT versus Fermi energy for bare and TTF-doped NDI. (b) ZT versus temperature evaluated using the DFT-predicted value of the Fermi energy. | ||
In conclusion, to illustrate the advantages of using redox-active molecules in the design of thermoelectric materials, we first studied the thermoelectric properties of NDI single-molecule junctions under electrochemical gating. The effect of an electrochemical gate is modelled by placing a charge double layer around the NDI and varying the distance of the charge double layer from the NDI backbone to control the charge state of the NDI. We predict that the three NDI charge states possess distinct thermoelectric properties. In particular the Seebeck coefficients of the neutral state are negative, whereas the anion and di-anion states possess a positive Seebeck coefficient. Building upon this strategy for tuning thermoelectric properties, we also investigated the effect on both phonon and electron transport of doping the NDI with either an electron donor (TTF) or an electron acceptor (TCNE). We find that doping by TTF increases the room-temperature Seebeck coefficient and power factor from −73.66 μV K−1 and 2.6 × 10⁻⁷ W m−1 K−2 for bare NDI to −105 μV K−1 and 3.6 × 10⁻⁴ W m−1 K−2 in presence of TTF. The low thermal conductance of NDI-TTF, combined with the higher Seebeck coefficient and higher electrical conductance lead to a maximum thermoelectric figure of merit of ZT = 1.2, which is higher than that of NDI-bare in several orders of magnitude. This demonstrates that both the sign and magnitude of NDI Seebeck coefficient can be tuned reversibly by electrochemical gating and doping, suggesting that with appropriate doping, such redox active molecules are attractive materials for ultra-thin-film thermoelectric devices.
Methods
Transport formulae
In the linear-response regime, the electric conductance G and Seebeck coefficient S of a single-molecule junction are given by24 | (1) |
 | (2) |
 | (3) |
In this expression, Tσ(E) is the transmission coefficient for electrons of energy E, spin σ = [↑, ↓] passing through the molecule from one electrode to the other and f(E, T) is Fermi distribution function  , where kB is Boltzmann's constant. For E close to the Fermi energy EF, if T(E) varies only slowly with E on the scale of kBT then these formulae take the form:
 | (4) |
 | (5) |
 is the Lorentz number. Eqn (5) demonstrates that the sign and value of S is tuned by changing the slope of ln
![[thin space (1/6-em)]](https://www.rsc.org/images/entities/char_2009.gif) T(E) near E = EF and hence it is of interest to explore whether or not the ability to vary the charge states of NDI can be used to control thermoelectricity.
T(E) near E = EF and hence it is of interest to explore whether or not the ability to vary the charge states of NDI can be used to control thermoelectricity.
Density functional theory
To compute the moments Ln of the transmission coefficient of the NDI-based single-molecule junction shown in Fig. 1 and 2, the following method was applied. First the relaxed geometry of molecule was found using the density functional (DFT) code SIESTA,30 which employs Troullier–Martins pseudopotentials to represent the potentials of the atomic cores,31 and a local-atomic-orbital basis set. A double-zeta polarized basis set was used for all atoms and the generalized gradient approximation (GGA-PBE) for the exchange and correlation functionals.32 For the geometry optimization, the Hamiltonian and overlap matrix elements were calculated on a real-space grid defined by a plane-wave cutoff of 150 Ry and the NDI molecule was relaxed until the forces on the atoms were smaller than 0.02 eV Å−1.After obtaining the relaxed geometry of the isolated NDI molecule, we constructed the single-molecule junction by placing the optimized NDI molecule between gold electrodes as shown in Fig. 1. After re-optimising the geometry, charge double layers were added to both sides of the planar backbone of the molecule following the technique describing in ref. 22 and T(E) was calculated for each realisation of the double layer. The electron and spin transport calculations were performed with the GOLLUM transport code,33 which uses the DFT-generated mean-field Hamiltonian to compute the transmission coefficient T(E) for electrons of energy E passing from the left gold electrode to the right electrode. For the transport calculation, the Hamiltonian and overlap matrices were calculated with SIESTA, using DZP basis sets for all elements except gold, for which a DZ basis set was used, a GGA-PBE exchange–correlation parameterization. To describe accurately singly-occupied levels of the NDI all calculations were spin-polarized and the electron transmission coefficient function T(E) was calculated as the average of the spin up and spin down transmission coefficients.
Acknowledgements
This work is supported by the UK EPSRC, EP/K001507/1, EP/J014753/1, EP/H035818/1, and from the EU ITN MOLESCO 606728 and the Ministry of Higher Education and Scientific Research, Al Qadisiyah University, Iraq.Notes and references
- C. Gayner and K. K. Kar, Prog. Mater. Sci., 2016, 83, 330–382 CrossRef CAS.
- X. Zhang and L.-D. Zhao, J. Mater., 2015, 1, 92–105 Search PubMed.
- X. F. Zheng, C. X. Liu, Y. Y. Yan and Q. Wang, Renewable Sustainable Energy Rev., 2014, 32, 486–503 CrossRef CAS.
- I. D. Hicks; and M. S. Dresselhaus, Phys. Rev. B: Condens. Matter, 1993, 47, 8–11 Search PubMed.
- L. D. Hicks and M. S. Dresselhaus, Phys. Rev. B: Condens. Matter, 1993, 47, 727–731 CrossRef.
- H. Sadeghi, S. Sangtarash and C. J. Lambert, Nano Lett., 2015, 15, 7467–7472 CrossRef CAS PubMed.
- K. Xu, P. Cao and J. R. Heath, Nano Lett., 2009, 9, 4446–4451 CrossRef CAS PubMed.
- H. Sadeghi, S. Sangtarash and C. J. Lambert, Sci. Rep., 2015, 5, 9514 CrossRef CAS PubMed.
- L. Rincón-García, C. Evangeli, G. Rubio-Bollinger and N. Agraït, Chem. Soc. Rev., 2016, 45, 4285–4306 RSC.
- H. Sadeghi, S. Sangtarash and C. J. Lambert, 2D Mater., 2017, 4, 15012 CrossRef.
- C. Evangeli, K. Gillemot, E. Leary, M. T. González, G. Rubio-Bollinger, C. J. Lambert and N. Agraït, Nano Lett., 2013, 13, 2141–2145 CrossRef CAS PubMed.
- Y. Nonoguchi, K. Ohashi, R. Kanazawa, K. Ashiba, K. Hata, T. Nakagawa, C. Adachi, T. Tanase and T. Kawai, Sci. Rep., 2013, 3, 3344 Search PubMed.
- Q. H. Al-Galiby, H. Sadeghi, L. A. Algharagholy, I. Grace and C. Lambert, Nanoscale, 2016, 8, 2428–2433 RSC.
- J. P. Small, K. M. Perez and P. Kim, Phys. Rev. Lett., 2003, 91, 256801 CrossRef PubMed.
- O. Bubnova, M. Berggren and X. Crispin, J. Am. Chem. Soc., 2012, 134, 16456–16459 CrossRef CAS PubMed.
- H. Ohta, T. Mizuno, S. Zheng, T. Kato, Y. Ikuhara, K. Abe, H. Kumomi, K. Nomura and H. Hosono, Adv. Mater., 2012, 24, 740–744 CrossRef CAS PubMed.
- S. F. Svensson, A. I. Persson, E. A. Hoffmann, N. Nakpathomkun, H. A. Nilsson, H. Q. Xu, L. Samuelson and H. Linke, New J. Phys., 2012, 14, 0–11 CrossRef CAS.
- Y. Tian, M. R. Sakr, J. M. Kinder, D. Liang, M. J. MacDonald, R. L. J. Qiu, H. J. Gao and X. P. A. Gao, Nano Lett., 2012, 12, 6492–6497 CrossRef CAS PubMed.
- M. C. Llaguno, J. E. Fischer, A. T. Johnson and J. Hone, Nano Lett., 2004, 4, 45–49 CrossRef CAS.
- P. M. Wu, J. Gooth, X. Zianni, S. F. Svensson, J. G. Gluschke, K. A. Dick, C. Thelander, K. Nielsch and H. Linke, Nano Lett., 2013, 13, 4080–4086 CrossRef CAS PubMed.
- Y. M. Zuev, W. Chang and P. Kim, Phys. Rev. Lett., 2009, 102, 1–4 CrossRef PubMed.
- Y. Li, M. Baghernejad, A. G. Qusiy, D. Zsolt Manrique, G. Zhang, J. Hamill, Y. Fu, P. Broekmann, W. Hong, T. Wandlowski, D. Zhang and C. Lambert, Angew. Chem., Int. Ed., 2015, 54, 13586–13589 CrossRef CAS PubMed.
- C. J. Lambert, Chem. Soc. Rev., 2015, 44, 875–888 RSC.
- C. J. Lambert, H. Sadeghi and Q. H. Al-galiby, C. R. Phys., 2016, 1, 1–12 Search PubMed.
- A. Shakouri and S. Li, Thermoelectr. 18th ICT, 1999, pp. 402–406.
- H. Shi, C. Liu, J. Xu, H. Song, Q. Jiang, B. Lu, W. Zhou and F. Jiang, Int. J. Electrochem. Sci., 2014, 9, 7629–7643 CAS.
- M. Sumino, K. Harada, M. Ikeda, S. Tanaka, K. Miyazaki and C. Adachi, Appl. Phys. Lett., 2011, 99, 93308 CrossRef.
- R. Kroon, D. A. Mengistie, D. Kiefer, J. Hynynen, J. D. Ryan, L. Yu and C. Muller, Chem. Soc. Rev., 2016, 45, 6147–6164 RSC.
- R. A. Schlitz, F. G. Brunetti, A. M. Glaudell, P. L. Miller, M. A. Brady, C. J. Takacs, C. J. Hawker and M. L. Chabinyc, Adv. Mater., 2014, 26, 2825–2830 CrossRef CAS PubMed.
- J. M. Soler, E. Artacho, J. D. Gale, A. Garcia, J. Junquera, P. Ordejon and D. Sanchez-Portal, J. Phys.: Condens. Matter, 2002, 14, 2745 CrossRef CAS.
- N. Troullier and J. L. Martins, Phys. Rev. B: Condens. Matter, 1991, 43, 8861–8869 CrossRef.
- J. P. Perdew, K. Burke and M. Ernzerhof, Phys. Rev. Lett., 1997, 78, 1396–1399 CrossRef CAS.
- J. Ferrer, C. J. Lambert, V. M. García-Suárez, D. Z. Manrique, D. Visontai, L. Oroszlany, R. Rodríguez-Ferradás, I. Grace, S. W. D. Bailey, K. Gillemot, H. Sadeghi and L. A. Algharagholy, New J. Phys., 2014, 16, 93029 CrossRef.
Footnote |
| † Electronic supplementary information (ESI) available. See DOI: 10.1039/c7nr00571g |
| This journal is © The Royal Society of Chemistry 2017 |