Graphene as a photothermal actuator for control of lipid mesophase structure†
Matthew D. J.
Quinn
a,
Tao
Wang
b,
Joanne D.
Du
c,
Ben J.
Boyd
c,
Adrian
Hawley
d and
Shannon M.
Notley
 *a
*a
aDepartment of Applied Mathematics, Research School of Physics and Engineering, The Australian National University, Canberra, ACT 2601, Australia. E-mail: shannon.notley@anu.edu.au
bDepartment of Chemistry and Biotechnology, Faculty of Science, Engineering and Technology, Swinburne University of Technology, Hawthorn, VIC 3122, Australia
cDrug Delivery, Disposition and Dynamics and ARC Centre of Excellence in Convergent Bio-Nano Science and Technology, Monash Institute of Pharmaceutical Sciences, Monash University (Parkville Campus), 381 Royal Parade, Parkville, Victoria 3052, Australia
dSAXS/WAXS Beamline, Australian Synchrotron, Clayton, Victoria, Australia
First published on 30th November 2016
Abstract
The optical density of pristine graphene is high and broad in the near infrared region of the electromagnetic spectrum positioning this material as a highly efficient photothermal agent for in vivo applications. In this study, surfactant assisted exfoliated graphene was incorporated within bulk lipid samples of varying lipid types: glyceryl monoether, glyceryl monooleate and phytantriol. The pristine graphene sheets did not disrupt the packing of the liquid crystals while being in sufficiently intimate contact to provide localized heating and induce phase transitions. The phase progressions induced through heating using NIR irradiation of the entrained graphene particles within the bulk liquid crystal were studied using SAXS and confirmed using polarized optical microscopy. Increases in apparent temperature experienced by the matrix of up to 50 °C were observed by establishing a SAXS versus bulk temperature calibration curve allowing in situ measurements. The studies demonstrate the potential for use of graphene as a photothermal actuator across a range of lipid based systems of interest in controlled drug delivery.
Introduction
Lipids have been studied extensively for applications including food science,1,2 nanostructure templating, biosensing,3,4 protein crystallization5,6 and drug delivery.7–9 Lipidic materials are particularly attractive due to the intrinsic biocompatibility of these building blocks of the biological world. It is critical to understand the structure being formed within the lipid matrices for drug delivery applications in order for the release rates and transition points to be determined and the intended functions to be achievable.Amphiphilic lipid molecules pack into highly ordered liquid crystalline (LC) phases in the presence of water,10,11 other surfactants9,12 and a range of nanoparticles,13,14 in a highly predictable and well-studied manner. Lipid molecules such as glyceryl monoether (GME), glyceryl monooleate (GMO) and phytantriol (PYT)(3,7,11,15-tetramethylhexadecane-1,2,3-triol) are synthetic or semi-synthetic lipidic materials commonly employed in cosmetic and pharmaceutical formulation. These can be loaded with high quantities of drugs with varied physiochemistry15 and have been positioned as potential drug delivery vehicles. Phase transitions of these materials can be readily induced through temperature changes including the use of a near infrared (NIR) photothermal agent.7,13 The direct structural determination of the bulk lipid samples is achievable through synchrotron small angle X-ray scattering (SAXS) which allows the structural evolution of the phases to be observed when induced through heating/cooling with excellent time resolution. This shows a potential method in controllable localized heating within the body as a promising step towards producing highly efficient drug delivery systems.
Several nanomaterials have been explored in recent years for the role of biologically relevant NIR photothermal agents including gold nano particles16,17 and graphene derivatives.18–21 Using NIR light allows greater penetration due to the low absorption in this region by biological tissue.22 Graphene could potentially be a highly stable and practical photothermal agent due to a range of properties. The vast surface area to volume ratio associated with a two-dimensional morphology allows greater efficiency of light absorption per mass.23–25 Additionally, graphene has no morphology reversion complications that have been demonstrated for metallic nanoparticles26 and it exhibits strong, broadband absorption of light.
The broadband absorption of light by graphene is attributed to the conjugated π bonds within the sheets.22,27 Defects in the basal plane reduce the capacity for graphene sheets to absorb light particularly in the NIR region.22 The production method employed for this experiment was surfactant assisted liquid phase exfoliation in which a surfactant is added to the aqueous phase to reduce the energy of cohesion of water to that of the van der Waals bonded solid.28,29 Shear is then imparted through ultrasonication in order to exfoliate the particles. The surfactant also adsorbs onto the graphene particle surface inhibiting re-aggregation.29 This exfoliation method produces pristine graphene whereby the only defects are considered to be on the edges of the sheets.28,30,31 The sp2 hybridization of the carbon-bonded network within the sheets is not compromised therefore the NIR absorbance is maximized.30,32
This work expands on our earlier communication demonstrating graphene as a photothermal agent in PYT-based cubic phase7 to more extensively establish the general use of graphene as a photothermal agent for use in lipid-based liquid crystalline materials prepared from GMO and GME, compared to previously reported gold nanorods.
Experimental
Materials
The supernatant was collected following the centrifugation and the stock graphene suspension concentration was determined to be 1.048 mg mL−1 determined from absorptivity at 660 nm using the extinction coefficient determined by Hernandez et al., of 2460 L g−1 m−1.30 The produced graphene particles were determined to have an average diameter of 367.5 nm (number PSD) with a zeta potential of −26.4 mV (pH 6.5) using a Malvern Zetasizer ZS. It is important to note that DLS analysis assumes particles of spherical morphology and as such, results should be considered as approximate.
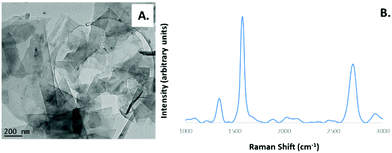
A JEOL 2100F transmission electron microscope (TEM) was used to image the exfoliated graphene sheets (Fig. 1). Particles were deposited onto holey carbon TEM grids by vacuum suctioning 100 μL of suspension and dried for 24 hours prior to imaging.
The particles produced using the liquid phase exfoliation method were characterized using Raman spectroscopy using a Renishaw Raman inVia Reflex with a with laser excitation at 532 nm (Fig. 1B). The particles were initially added drop wise to a 0.22 μm pore size alumina filter (Whatman) prior to measurement. The D band at approximately 1350 cm−1 is attributed to the edges of the graphene sheets. The ratio between the G and the 2D peaks IG/I2D is approximately 1![[thin space (1/6-em)]](https://www.rsc.org/images/entities/char_2009.gif) :
:![[thin space (1/6-em)]](https://www.rsc.org/images/entities/char_2009.gif) 0.56 (see Fig. S1 and S2†) indicating the sheets have been exfoliated within the region of single and few layers.33 The symmetry of the 2D band at 2698 cm−1 again indicates that the material has been successfully exfoliated down to the region of single and few layers (see Fig. S2†).31
0.56 (see Fig. S1 and S2†) indicating the sheets have been exfoliated within the region of single and few layers.33 The symmetry of the 2D band at 2698 cm−1 again indicates that the material has been successfully exfoliated down to the region of single and few layers (see Fig. S2†).31
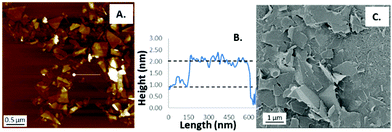
Graphene suspensions were characterized via atomic force microscopy (AFM), whereby the sheet thickness and morphology can be determined and visualized. The thickness section shows a monolayer graphene sheet that likely has a water or surfactant coating as well as indicating that these are single and few layer suspensions. The AFM image shows the polydispersity that is characteristic of these materials and gives an approximate comparison to the particle sizing analysis performed through dynamic light scattering (DLS).
The graphene nanosheets were also imaged via scanning electron microscopy (SEM) using a Zeiss UltraPlus FESEM at a voltage of 1 kV and with platinum sputter coating for 2 minutes. The SEM images provides a further comparison to the DLS particle sizing as well as showing the polydispersity, the overlapping and the non-uniform stacking which occurs to the sheets upon deposition, a likely explanation for high points on AFM cross sections despite the slight variations in sample preparation methods. AFM imaging was performed using a Multimode 8 AFM (Bruker) in ScanAssyst-Air mode using Bruker ScanAsyst-Air probes (tip radius, 2–12 nm and silicon nitride cantilever; spring constant, 0.4 N m−1). The DLS, SEM, TEM and AFM are all in strong agreement with each other in regards to the approximate lateral dimensions of the prepared graphene sheets (Fig. 2).
Methods
![[thin space (1/6-em)]](https://www.rsc.org/images/entities/char_2009.gif) :
:![[thin space (1/6-em)]](https://www.rsc.org/images/entities/char_2009.gif) 1 ratio. Each sample was then vortexed to mix thoroughly. The heating/vortex cycle was repeated three times to achieve homogenous mixtures, samples were placed on a “roller” overnight and then were stored at 4 °C for two weeks prior to any experiments.
1 ratio. Each sample was then vortexed to mix thoroughly. The heating/vortex cycle was repeated three times to achieve homogenous mixtures, samples were placed on a “roller” overnight and then were stored at 4 °C for two weeks prior to any experiments.
For temperature-dependent structural data, samples were transferred to a vertical sample holder and sandwiched between kapton polyimide tape. The sample holder was then mounted in front of the SAXS beam on a temperature controlled plate and an empty sample position was fitted with a thermocouple. Snapshots were collected at 5 °C intervals from 25 °C through to 70 °C and each temperature was held for 5 min to allow equilibration prior to the snapshots being taken. The calibration curves of lattice parameter were determined via the q value of the primary peak versus temperature, using the approach described by Fong et al.,13 the apparent temperatures (Tapp) of the samples could be determined during the irradiation experiments. This is achieved by finding the q value of the sample irradiated and applying the appropriate phase calibration equation to determine the corresponding temperature. This method allows the apparent temperature experienced by the lipid matrix during the experiment to be determined. This was performed at a range of graphene concentrations within the bulk lipid samples.
For dynamic NIR irradiation studies, the samples were loaded onto a vertical sample holder and mounted in front of the SAXS beam with the laser optical outlet positioned at a distance of 12 mm from the sample in order to achieve full coverage of the sample, 5 mm diameter, to ensure homogenous heating. The irradiation experiments were performed using a 400 mW 808 nm CW laser at a power density of 4.08 W cm−2. Each sample was irradiated for 60 s with 100 ms SAXS images collected every 5 s. This allowed the mapping of the phase transitions as the samples were heated up via the photothermal transduction of the NIR radiation. Additionally, the samples were allowed to cool with continued SAXS snapshots to confirm the reversibility of the graphene loaded lipids.
Avoiding radiation damage from the synchrotron beamline during the data accumulation was important in order to gather clear scattering patterns. To ensure radiation damage was avoided, a test was performed in which the exposure time was incrementally increased until radiation damage occurred. This allowed a safe exposure time range to be established well below the point of radiation damage.
Results
Equilibrium structural studies
Three lipids were selected and were all studied in excess water, at a prepared ratio of 1![[thin space (1/6-em)]](https://www.rsc.org/images/entities/char_2009.gif) :
:![[thin space (1/6-em)]](https://www.rsc.org/images/entities/char_2009.gif) 1 lipid to water (50% w/w). Under these circumstances the phases observed in excess water with increasing temperature included the inverse bicontinuous cubic phase QII, the reversed hexagonal phase HII and the isotropic inverse micellar phase LII. The inverse bicontinuous cubic phase present for both the GMO and the PYT systems was the double diamond Pn
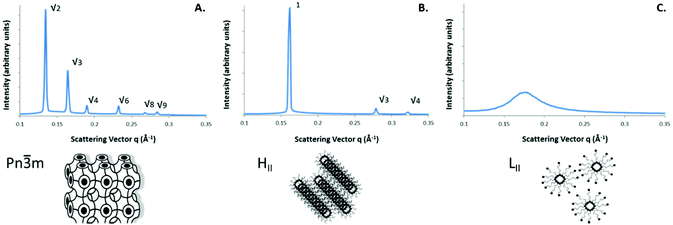
1 lipid to water (50% w/w). Under these circumstances the phases observed in excess water with increasing temperature included the inverse bicontinuous cubic phase QII, the reversed hexagonal phase HII and the isotropic inverse micellar phase LII. The inverse bicontinuous cubic phase present for both the GMO and the PYT systems was the double diamond Pn![[3 with combining macron]](https://www.rsc.org/images/entities/char_0033_0304.gif) m Q224 type. This inverse bicontinuous phase is connected in 3D space with cubic symmetry and consists of two interwoven networks of water channels, separated by the bilayers.35,36 The QII phase will henceforth be referred to as Q224 for clarity. The reversed hexagonal phase consists of a dense packing of water filled rods arranged on a 2D hexagonal lattice separated by lipid bilayers and the LII phase consists of the reversed micellar phase with no long range ordered packing and is therefore characterized by the singular broad peak. The Q224 phase can be identified by the Bragg peak positions which shows reflections at spacing ratios of √2
m Q224 type. This inverse bicontinuous phase is connected in 3D space with cubic symmetry and consists of two interwoven networks of water channels, separated by the bilayers.35,36 The QII phase will henceforth be referred to as Q224 for clarity. The reversed hexagonal phase consists of a dense packing of water filled rods arranged on a 2D hexagonal lattice separated by lipid bilayers and the LII phase consists of the reversed micellar phase with no long range ordered packing and is therefore characterized by the singular broad peak. The Q224 phase can be identified by the Bragg peak positions which shows reflections at spacing ratios of √2![[thin space (1/6-em)]](https://www.rsc.org/images/entities/char_2009.gif) :
:![[thin space (1/6-em)]](https://www.rsc.org/images/entities/char_2009.gif) √3
√3![[thin space (1/6-em)]](https://www.rsc.org/images/entities/char_2009.gif) :
:![[thin space (1/6-em)]](https://www.rsc.org/images/entities/char_2009.gif) √4
√4![[thin space (1/6-em)]](https://www.rsc.org/images/entities/char_2009.gif) :
:![[thin space (1/6-em)]](https://www.rsc.org/images/entities/char_2009.gif) √6
√6![[thin space (1/6-em)]](https://www.rsc.org/images/entities/char_2009.gif) :
:![[thin space (1/6-em)]](https://www.rsc.org/images/entities/char_2009.gif) √8
√8![[thin space (1/6-em)]](https://www.rsc.org/images/entities/char_2009.gif) :
:![[thin space (1/6-em)]](https://www.rsc.org/images/entities/char_2009.gif) √9 as shown in Fig. 3A. The HII phase is identified by the reflection spacings of 1
√9 as shown in Fig. 3A. The HII phase is identified by the reflection spacings of 1![[thin space (1/6-em)]](https://www.rsc.org/images/entities/char_2009.gif) :
:![[thin space (1/6-em)]](https://www.rsc.org/images/entities/char_2009.gif) √3
√3![[thin space (1/6-em)]](https://www.rsc.org/images/entities/char_2009.gif) :
:![[thin space (1/6-em)]](https://www.rsc.org/images/entities/char_2009.gif) √4 as shown in Fig. 3B.
√4 as shown in Fig. 3B.
Initial scattering snapshots were collected for blank and graphene-loaded samples in order to determine whether the F108-graphene sheets would disrupt the packing of the lipids at room temperature. There were no significant differences in the scattering patterns between the graphene loaded samples and the corresponding blanks (see Fig. S5–S7†).
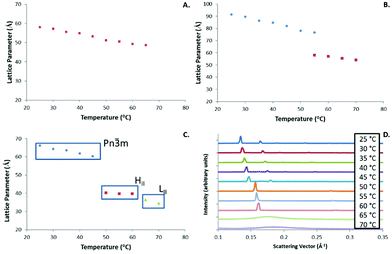
The lattice parameters of the structures formed by GME (Fig. 4A) and GMO (Fig. 4B) also followed the expected trend of decreasing with temperature, with the GMO system showing the characteristic marked decrease in lattice spacing associated with the transition from Q224 to HII.
The PYT system is ideal for phase analysis of the lipid systems as full transitions from Q224 to HII to LII can be easily induced via a controlled temperature ramp as shown in Fig. 4C. This allows a more comprehensive view of the phase transitions occurring within the NIR irradiation experiments, with an additional in depth look at the lattice structure at any one temperature or phase.
As the temperature was increased the primary Q224 peaks shifted to larger q values indicating that the spacing of the LC lattice decreased (Fig. 4C and D). This trend can be observed until a marked shift between phases occurred at approximately 50 °C where the HII phase emerged.
The transition to the LII phase occurred at approximately 65 °C which enables some indication of temperature, but is not a crystalline structure making it less useful in ‘calibrating’ the apparent temperature experienced by the matrix.
Photothermal activation of phase transitions using graphene
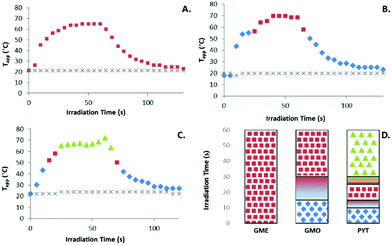
Photothermally induced phase transition plots of the graphene loaded lipids show the phase present throughout the irradiation time and the corresponding temperatures. Primarily these diagrams are produced to accurately show the photothermal transducing capabilities of the graphene sheets. They demonstrate a potential application in inducing phase transitions within a potential drug delivery vehicle. All blank lipid samples in the absence of graphene showed no temperature increase upon irradiation with the laser (see Fig. S7–S9†).Fig. 5A shows the changes in (Tapp) for the 0.5 mg ml−1 of graphene in GME bulk lipid sample upon NIR irradiation, showing the (Tapp) increase from 20.0 to 64.9 °C. No phase transition was recorded for this bulk lipid sample which is in agreement with previously reported values as the transition from hexagonal phase to LII phase is expected to occur at approximately 80 °C.37
Fig. 5B shows the converted SAXS plot for the laser irradiated F108-graphene loaded GMO sample. It can be seen that the temperature quickly increases up to 56.6 °C where the phase transitions from Q224 to HII. The apparent temperature reaches a maximum of approximately 69.8 °C. From this data it can be observed that the GMO phase transitions are occurring at temperatures slightly different to pure GMO38 due to the purity of the Myverol sample which has been shown previously to significantly alter the transition temperatures.39Fig. 5C shows the PYT converted irradiation plot demonstrating the full phase progression through from Q224 to HII occurring at 52.3 °C, through to the isotropic inverse micellar LII phase at 72.1 °C.
The transitions for each of the lipid systems can be easily observed and compared in Fig. 5D which shows the phase transition as a function of irradiation time and includes the presence of significant mixed phases during a transition point. The transition points, or lack thereof in the case of GME, correlate strongly with previously published phase diagrams (collated in Fig. S12†).11,37,40
Polarized microscopy for confirmation of phase transition boundaries
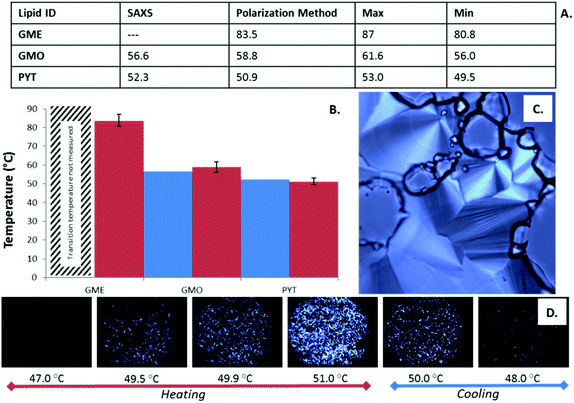
The graphene loaded lipids were also studied on a polarized light microscope with a temperature controlled stage which allowed a secondary method of identifying the phase boundaries of the lipids (see Fig. 6). The birefringent phases of each of the lipids allowed only polarized light to pass through the lipid samples, permitting the boundaries between anisotropic phases and isotropic phases to be identified. In this study, each of the lipid systems self-assembled to form the HII phase at some point in the phase progression at 50% w/w, allowing this anisotropic phase to act as the transition boundary marker readily identified by the well-established characterization of its fan like texture.41Reversibility of the photothermal effect and dependence on laser power
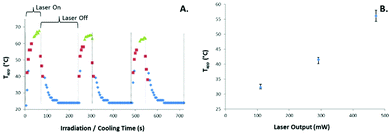
The samples were irradiated with NIR in a single position multiple times in order to determine the reproducibility and stability of the systems. As can be seen in Fig. 7A the full reversibility is demonstrated, however the maximum temperature reached was observed to decrease slightly over the course of the cycles. We attributed this to inhomogeneity caused by the positioning of the vertical sample holder and the reduced viscosity of the lipids at the high temperatures. In addition, video monitoring of the samples showed them to be vigorously mixing at the maximum temperatures during the irradiation periods. It is likely that during this event the vigorous mixing leads to inhomogeneous localized graphene concentrations resulting in a small decrease in maximum Tapp over time.The relationship between laser power and maximum temperatures (Tapp) achieved within the bulk lipid samples was also determined, as shown in Fig. 7B. This demonstrated the linear relationship between concentration of nanoparticles and laser power and heating effect explored previously in similar systems.42,43
These bulk lipid samples were quite stable despite the high temperatures and vigorous mixing occurring. It is important to clarify that the cause of the slightly decreased maximum temperature observed for the repeated irradiation experiment is likely not due to any decreased function of the graphene material as a photothermal agent. As we have demonstrated in a previous publication, a 10× cycled photothermal experiment was performed whereby a graphene suspension was irradiated for 20 minutes and cooled for 25 minutes with the temperature monitored throughout.44 The maximum temperature remained within ±0.2 °C throughout the experiment showing no decreased photothermal activity. This is critical when comparing graphene against the current NIR photothermal agent gold nanorods which show morphology reversion under certain conditions therefore losing the advantageous absorbance magnitude and peak positioning.26
Two critical variables available to control the effect of a photothermal material are the concentration of the photothermal agent and the laser power. The relationship between the concentrations of photothermal nanoparticles and the corresponding increase in temperature rise has been well established and was demonstrated once more for this material.14,42 The relationship between laser power and resulting heating effect was also demonstrated at a fixed graphene concentration (Fig. S4†).
The sheet thickness distribution of the single and few-layered graphene sheet suspensions employed lend themselves to being more efficient than a suspension of uniform thickness monolayer sheets. This is due to the additive absorbance to a certain thickness shown by Nair et al. in 2008. A single graphene sheet will have a transmittance of 2.3%, which will increase additively with a slight decrease in contributed absorbance as sheet number increases.45,46
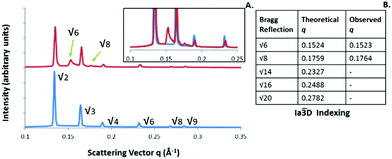
An interesting phenomenon was observed when monitoring the cooling segments of irradiation experiments, whereby a mixed phase consisting of the two bicontinuous cubic phases with Ia![[3 with combining macron]](https://www.rsc.org/images/entities/char_0033_0304.gif) d and Pn
d and Pn![[3 with combining macron]](https://www.rsc.org/images/entities/char_0033_0304.gif) m spacegroup was identifiable for the PYT lipid systems, even after cooling back to ambient temperature (see Fig. 8). This Ia
m spacegroup was identifiable for the PYT lipid systems, even after cooling back to ambient temperature (see Fig. 8). This Ia![[3 with combining macron]](https://www.rsc.org/images/entities/char_0033_0304.gif) D phase structure, which was confirmed via the peak positions in table 8B, was not present upon heating and is not expected to appear unless the water concentration decreases to approximately 25% w/w.11 This non-equilibrium phase structure has been observed previously in photothermal experiments with this system using gold nanorods, and was attributed to the ingress of the water being suppressed during cooling.39 These nonequilibrium systems indicate that the internal structure of dispersed LC particles is not independent of thermal history and are not in thermodynamic equilibrium. It is important to determine the cause of any unexpected phase structures to avoid difficulties in translation of such systems for controlled release applications.
D phase structure, which was confirmed via the peak positions in table 8B, was not present upon heating and is not expected to appear unless the water concentration decreases to approximately 25% w/w.11 This non-equilibrium phase structure has been observed previously in photothermal experiments with this system using gold nanorods, and was attributed to the ingress of the water being suppressed during cooling.39 These nonequilibrium systems indicate that the internal structure of dispersed LC particles is not independent of thermal history and are not in thermodynamic equilibrium. It is important to determine the cause of any unexpected phase structures to avoid difficulties in translation of such systems for controlled release applications.
Three different lipids were selected to demonstrate the wide range of drug carrier vehicles that can be loaded with F108-graphene without disrupting the packing and act as the controllable release agent. PYT is a cosmetic ingredient which exhibits similar lyotropic phase behavior to GMO47 and importantly, does not contain an ester group imparting greater chemical stability. PYT consists of a highly branched phytantyl tail with a tri-hydroxy head group (see Fig. S11†).
When considering such systems for drug delivery roles, selecting a drug carrier with a favorable release profile is a critical consideration. The three lipids selected for this study were chosen due to their being well studied materials with well understood and demonstrated loading and release capabilities. However each of the lipids show a release profile that is not ideal for stimulated drug release applications as they transition from fast to slow release profiles with temperature.8 These systems are still highly relevant as they demonstrate both the ability to be loaded with a wide range of physiochemically varied materials and provide excellent platforms to demonstrate the photothermal abilities of surfactant exfoliated graphene. This challenge can be readily addressed by selecting a lipid with a more favorable release profile, such as from the lamellar phase Lα to the highly porous QII phase demonstrated for the lipid monoelaidin.48
Opportunities to optimize these systems are also available through subtle alterations to the composition. One method of optimizing the lipid LC drug carrier system is to manipulate the required phase transition temperature as was shown by Fong et al. in 2012. This group showed that the addition of GMO to a PYT system suppressed the transition from the QII to HII phases.13 A lower phase transition temperature will subsequently reduce the required heating and therefore lower the concentration of the photothermal agent charged with the role of heating the system (or alternatively allow a reduced light flux). These optimization strategies are particularly important as they will likely hold the solution for establishing a system with an appropriate mesophase progression. Additionally, they lower the amount of photothermal agent required, increasing the overall efficiency of target applications.
Pristine graphene has improved biocompatibility over other photothermal agents such as graphene oxide,49 reduced graphene oxide and gold nanorods50 in large part due to the non-ionic surfactant coating selected which has been well established to improve biocompatibility.51–53 With careful lipid drug carrier optimization via selection of lipid identity and composition of components such as Vitamin E,47 the temperature increase required to induce release could be reduced allowing minimal graphene concentrations and therefore minimizing any toxicity.
Individual phases of an LC system can present significantly different viscosities.54 The range and manipulations to the viscosity of LC systems opens up additional routes of delivery, with low viscosity materials allowing for injectable pathways,55 while the higher viscosity materials providing a route towards topical applications. By inducing in situ phase transformations from high viscous states to low viscous states, these challenges can be circumvented, and with a more delicate approach, specific phases can be targeted for control of release rates.
Previous studies have shown that the nanoparticles incorporated within bulk lipids are located in the aqueous phase.40 In addition to the previously reported precise location of these similarly sized materials, the length of the PEO chains of the surfactant impart a strong hydrophilic nature to the graphene sheets. It is therefore with reasonable confidence that we can assume that the sheets are most likely located primarily within the bulk aqueous phase within the lipid matrix. While the strong localization and coupling between the sheets and the lipid nanostructures is clear due to the observed thermal influence.
Conclusions
This study has demonstrated that surfactant exfoliated graphene is an efficient and versatile NIR photothermal agent capable of being incorporated within bulk lipid samples of varying lipid types without disrupting packing while being in sufficiently intimate contact to provide localized heating and induce phase transitions. The reversibility of the lipid transitions allowed demonstration of the ability of the photothermal agent to withstand the high temperatures reported with no loss of efficiency. The temperatures achieved through the localized heating of graphene indicates that the photoresponsive lipid systems could be phase switched to release payloads in vivo via NIR stimulation.Acknowledgements
This research was undertaken on the SAXS/WAXS beamline at the Australian Synchrotron, Victoria, Australia. S. M. N. and B. J. B. acknowledge financial support under the ARC Future Fellowship scheme. We thank Dr Khu Vu (RSPE, ANU) and Prof. Stephen Hyde (RSPE, ANU) for their valuable advice and the use of their laboratories.Notes and references
- I. Amar-Yuli, D. Libster, A. Aserin and N. Garti, Curr. Opin. Colloid Interfacial Sci., 2009, 14, 21–32 CrossRef CAS.
- K. Larsson, Curr. Opin. Colloid Interfacial Sci., 2009, 14, 16–20 CrossRef CAS.
- E. Nazaruk, R. Bilewicz, G. Lindblom and B. Lindholm-Sethson, Anal. Bioanal. Chem., 2008, 391, 1569–1578 CrossRef CAS PubMed.
- Q. Liu and B. J. Boyd, Analyst, 2013, 138, 391–409 RSC.
- V. Cherezov, J. Clogston, Y. Misquitta, W. Abdel-Gawad and M. Caffrey, Biophys. J., 2002, 83, 3393–3407 CrossRef CAS PubMed.
- C. V. Kulkarni, in Advances in Planar Lipid Bilayers and Liposomes, 2010, vol. 12, pp. 237–272 Search PubMed.
- M. D. J. Quinn, J. Du, B. J. Boyd, A. Hawley and S. M. Notley, Langmuir, 2015, 31, 6605–6609 CrossRef CAS PubMed.
- S. Phan, W. K. Fong, N. Kirby, T. Hanley and B. J. Boyd, Int. J. Pharm., 2011, 421, 176–182 CrossRef CAS PubMed.
- Y. D. Dong, I. Larson, T. J. Barnes, C. A. Prestidge, S. Allen, X. Chen, C. J. Roberts and B. J. Boyd, Langmuir, 2012, 28, 13485–13495 CrossRef CAS PubMed.
- J. Barauskas, M. Johnsson and F. Tiberg, Nano Lett., 2005, 5, 1615–1619 CrossRef CAS PubMed.
- J. Barauskas and T. Landh, Langmuir, 2003, 19, 9562–9565 CrossRef CAS.
- B. J. Boyd, Y. D. Dong and T. Rades, J. Liposome. Res., 2009, 19, 12–28 CrossRef CAS PubMed.
- W. K. Fong, T. L. Hanley, B. Thierry, N. Kirby, L. J. Waddington and B. J. Boyd, Langmuir, 2012, 28, 14450–14460 CrossRef CAS PubMed.
- W. K. Fong, T. L. Hanley, B. Thierry, N. Kirby and B. J. Boyd, Langmuir, 2010, 26, 6136–6139 CrossRef CAS PubMed.
- J. C. Shah, Y. Sadhale and D. M. Chilukuri, Adv. Drug Delivery Rev., 2001, 47, 229–250 CrossRef CAS PubMed.
- X. Huang, I. H. El-Sayed, W. Qian and M. A. El-Sayed, J. Am. Chem. Soc., 2006, 128, 2115–2120 CrossRef CAS PubMed.
- P. K. Jain, K. S. Lee, I. H. El-Sayed and M. A. El-Sayed, J. Phys. Chem. B, 2006, 110, 7238–7248 CrossRef CAS PubMed.
- B. Tian, C. Wang, S. Zhang, L. Feng and Z. Liu, ACS Nano, 2011, 5, 7000–7009 CrossRef CAS PubMed.
- K. Yang, S. Zhang, G. Zhang, X. Sun, S. T. Lee and Z. Liu, Nano Lett., 2010, 10, 3318–3323 CrossRef CAS PubMed.
- S. H. Hu, R. H. Fang, Y. W. Chen, B. J. Liao, I. W. Chen and S. Y. Chen, Adv. Funct. Mater., 2014, 24, 4144–4155 CrossRef CAS.
- M. Guo, J. Huang, Y. Deng, H. Shen, Y. Ma, M. Zhang, A. Zhu, Y. Li, H. Hui, Y. Wang, X. Yang, Z. Zhang and H. Chen, Adv. Funct. Mater., 2015, 25, 59–67 CrossRef CAS.
- J. T. Robinson, S. M. Tabakman, Y. Liang, H. Wang, H. Sanchez Casalongue, D. Vinh and H. Dai, J. Am. Chem. Soc., 2011, 133, 6825–6831 CrossRef CAS PubMed.
- A. K. Geim and I. V. Grigorieva, Nature, 2013, 499, 419–425 CrossRef CAS PubMed.
- K. S. Novoselov, V. I. Fal'Ko, L. Colombo, P. R. Gellert, M. G. Schwab and K. Kim, Nature, 2012, 490, 192–200 CrossRef CAS PubMed.
- A. Y. W. Sham and S. M. Notley, Soft Matter, 2013, 9, 6645–6653 RSC.
- J. Xie, J. Y. Lee and D. I. C. Wang, Chem. Mater., 2007, 19, 2823–2830 CrossRef CAS.
- L. Dan, M. B. Müller, S. Gilje, R. B. Kaner and G. G. Wallace, Nat. Nanotechnol., 2008, 3, 101–105 CrossRef PubMed.
- M. Lotya, Y. Hernandez, P. J. King, R. J. Smith, V. Nicolosi, L. S. Karlsson, F. M. Blighe, S. De, Z. Wang, I. T. McGovern, G. S. Duesberg and J. N. Coleman, J. Am. Chem. Soc., 2009, 131, 3611–3620 CrossRef CAS PubMed.
- M. Lotya, P. J. King, U. Khan, S. De and J. N. Coleman, ACS Nano, 2010, 4, 3155–3162 CrossRef CAS PubMed.
- Y. Hernandez, V. Nicolosi, M. Lotya, F. M. Blighe, Z. Sun, S. De, I. T. McGovern, B. Holland, M. Byrne, Y. K. Gun'ko, J. J. Boland, P. Niraj, G. Duesberg, S. Krishnamurthy, R. Goodhue, J. Hutchison, V. Scardaci, A. C. Ferrari and J. N. Coleman, Nat. Nanotechnol., 2008, 3, 563–568 CrossRef CAS PubMed.
- K. R. Paton, E. Varrla, C. Backes, R. J. Smith, U. Khan, A. O'Neill, C. Boland, M. Lotya, O. M. Istrate, P. King, T. Higgins, S. Barwich, P. May, P. Puczkarski, I. Ahmed, M. Moebius, H. Pettersson, E. Long, J. Coelho, S. E. O'Brien, E. K. McGuire, B. M. Sanchez, G. S. Duesberg, N. McEvoy, T. J. Pennycook, C. Downing, A. Crossley, V. Nicolosi and J. N. Coleman, Nat. Mater., 2014, 13, 624–630 CrossRef CAS PubMed.
- S. M. Notley, Langmuir, 2012, 28, 14110–14113 CrossRef CAS PubMed.
- M. S. Kang, K. T. Kim, J. U. Lee and W. H. Jo, J. Mater. Chem. C, 2013, 1, 1870–1875 RSC.
- N. M. Kirby, S. T. Mudie, A. M. Hawley, D. J. Cookson, H. D. T. Mertens, N. Cowieson and V. Samardzic-Boban, J. Appl. Crystallogr., 2013, 46, 1670–1680 CrossRef CAS.
- T. Oka, T. Saiki, J. M. Alam and M. Yamazaki, Langmuir, 2016, 32, 1327–1337 CrossRef CAS PubMed.
- J. M. Seddon and R. H. Templer, Polymorphism of Lipid-Water Systems, in Handbook of Biological Physics, ed. R. Lipowsky and E. Sackmann, 1995, vol. 1, pp. 97–160 Search PubMed.
- G. Popescu, J. Barauskas, T. Nylander and F. Tiberg, Langmuir, 2007, 23, 496–503 CrossRef CAS PubMed.
- S. T. Hyde, S. Andersson, B. Ericsson and K. Larsson, Z. Kristallogr. - New Cryst. Struct., 1984, 168, 213–219 CAS.
- Y. D. Dong, A. J. Tilley, I. Larson, M. Jayne Lawrence, H. Amenitsch, M. Rappolt, T. Hanley and B. J. Boyd, Langmuir, 2010, 26, 9000–9010 CrossRef CAS PubMed.
- W. K. Fong, T. L. Hanley, B. Thierry, A. Tilley, N. Kirby, L. J. Waddington and B. J. Boyd, Phys. Chem. Chem. Phys., 2014, 16, 24936–24953 RSC.
- R. W. Corkery, Phys. Chem. Chem. Phys., 2004, 6, 1534–1546 RSC.
- V. P. Pattani and J. W. Tunnell, Lasers Surg. Med., 2012, 44, 675–684 CrossRef PubMed.
- S. S. Chou, Angew. Chem., Int. Ed., 2013, 52, 4160–4164 CrossRef CAS PubMed.
- M. D. J. Quinn, K. Vu, S. Madden and S. M. Notley, ACS Appl. Mater. Interfaces, 2016, 8, 10609–10616 CAS.
- R. R. Nair, P. Blake, A. N. Grigorenko, K. S. Novoselov, T. J. Booth, T. Stauber, N. M. R. Peres and A. K. Geim, Science, 2008, 320, 1308–1308 CrossRef CAS PubMed.
- S. E. Zhu, S. Yuan and G. C. A. M. Janssen, EPL, 2014, 108 Search PubMed.
- Y. D. Dong, I. Larson, T. Hanley and B. J. Boyd, Langmuir, 2006, 22, 9512–9518 CrossRef CAS PubMed.
- C. V. Kulkarni, Langmuir, 2011, 27, 11790–11800 CrossRef CAS PubMed.
- M. C. Duch, G. R. S. Budinger, Y. T. Liang, S. Soberanes, D. Urich, S. E. Chiarella, L. A. Campochiaro, A. Gonzalez, N. S. Chandel, M. C. Hersam and G. M. Mutlu, Nano Lett., 2011, 11, 5201–5207 CrossRef PubMed.
- C. Xu, D. Yang, L. Mei, B. Lu, L. Chen, Q. Li, H. Zhu and T. Wang, ACS Applied Materials and Interfaces, 2013, 5, 2715–2724 CrossRef CAS PubMed.
- N. A. Alcantar, E. S. Aydil and J. N. Israelachvili, J. Biomed. Mater. Res., 2000, 51, 343–351 CrossRef CAS PubMed.
- M. Wojtoniszak, X. Chen, R. J. Kalenczuk, A. Wajda, J. Łapczuk, M. Kurzewski, M. Drozdzik, P. K. Chu and E. Borowiak-Palen, Colloids Surf., B, 2012, 89, 79–85 CrossRef CAS PubMed.
- T. Wang, M. D. J. Quinn, S. H. T. Nguyen, A. Yu and S. M. Notley, Adv. Mater. Interfaces, 2016, 3, 1600182 CrossRef.
- Y. Wu, M. Stefl, A. Olzynska, M. Hof, G. Yahioglu, P. Yip, D. R. Casey, O. Ces, J. Humpolickova and M. K. Kuimova, Phys. Chem. Chem. Phys., 2013, 15, 14986–14993 RSC.
- M. Malmsten, Soft Matter, 2006, 2, 760–769 RSC.
Footnote |
| † Electronic supplementary information (ESI) available: Additional materials and experimental details including further graphene characterization data, blank lipid SAXS patterns, initial graphene loaded SAXS patterns, and lipid chemical structures. See DOI: 10.1039/c6nr08185a |
| This journal is © The Royal Society of Chemistry 2017 |

