Diiridium(III) complexes: luminescent probes and sensors for G-quadruplex DNA and endoplasmic reticulum imaging†
Tikum Florence
Anjong
,
Gyoungmi
Kim
,
Ha Yoon
Jang
,
Juyoung
Yoon
* and
Jinheung
Kim
*
Department of Chemistry and Nano Science, Ewha Womans University, Seoul 120-750, Korea. E-mail: jyoon@ewha.ac.kr; jinheung@ewha.ac.kr; Fax: +82-2-3277-3419; Tel: +82-2-3277-4453
First published on 25th November 2016
Abstract
Two new dinuclear iridium (Ir) complexes bridged by a conjugated aromatic tppz ligand, (bhq)2Ir(tppz)Ir(bhq)2 (1) and (ppy)2Ir(tppz)Ir(ppy)2 (2) (bhq = benzo(h)quinolone, ppy = phenyl-pyridine, tppz = tetrapyrido[3,2-a:2′,3′-c:3′′,2′′-h:2′′′,3′′′-j]phenazine), were prepared. The DNA binding properties of complexes 1 and 2 were studied using single-stranded DNA, double-stranded DNA, and G-quadruplex DNA. G-Quadruplex binding was characterized by higher emission enhancements than those observed with other control DNA strands. Photophysical properties of complexes 1 and 2 indicated that 1 displayed selective G-quadruplex binding affinity, but 2 did not. The emission properties of complexes 1 and 2 were also studied using liposomes in order to understand their possible interactions with lipid-rich organelles in live cells. The phosphorescence intensity of 1 and 2 was enhanced upon interaction with liposomes, but 2 showed greater enhancement. We also confirmed that 1 and 2 could be used as probes in live cells. Complexes 1 and 2 were intensely stained in HeLa cervical cancer cells. Excitation with a λ = 488 nm laser showed red emission localized in the cytosol of cells. Cellular studies showed that 1 and 2 were located inside HeLa cells, but neither complex passed through the nuclear membrane. However, complexes 1 and 2 possessed superior photostability, indicating their role as good luminescent agents for imaging and tracking the endoplasmic reticulum (ER) in live cells. Overall, complex 1 exhibited better selectivity for G-quadruplexes, liposomes, and ER staining.
Introduction
Polypyridyl transition metal complexes have been extensively studied as sensory probes due to their interesting electrochemical and photophysical properties.1–3 Their unusual properties, compared with organic luminescent probes, were derived from the absorption and emission bands in the visible region with large Stokes shifts, long-lived luminescence, and good photostability. These characteristic properties allow them to be often used as biological imaging probes. The attractive photophysical properties of the metal complexes, especially ruthenium (Ru) and irridium (Ir) complexes containing a dppz ligand, have produced strong emission enhancements with double-stranded DNA in buffer solutions due to strong intercalation of the metal complexes among base pairs.4–9Several Ir(III) complexes have shown higher emission quantum yields and longer lifetimes derived from their strong spin–orbit coupling, compared to other transition metal complexes. Ligand modification of Ir(III) complexes allows tuning of their emission bands. Mononuclear Ir complexes have been explored as G-quadruplex stabilizers, luminescent labels and probes for biomolecules and cells, and potent inhibitors targeting active sites of proteins.10–16 Cyclometalated Ir(III) complexes have shown potential for bioimaging due to their high phosphorescence quantum yield, but often had poor solubility in water.17–19 In a recent study of the interaction of Ru(II)–dppz derivatives with lipid membranes, the attachment of alkyl chains to the dppz ligand provided a significant increase in membrane affinity. To solve the poor aqueous solubility of iridium(III) complexes for cellular probing and imaging, the conjugation of a cell penetrating peptide with iridium complexes was studied.19
Guanine(G)-rich DNA sequences are capable of folding into unique G-quadruplex structures.20 G-Quadruplex DNA structures are four-stranded helical structures comprising stacks of G-tetrads. The G-tetrads have a planar association of four guanines in a cyclic Hoogsteen hydrogen-bonding arrangement. A number of aptamers containing specific G-rich sequences show promising applications for biosensing, drug screening, and therapeutics. The G-quadruplex structures play a biologically important role in controlling telomerase activity.21 Small molecules stabilizing the G-quadruplex conformation are considered effective telomerase inhibitors. Most of the G-quadruplex stabilizing molecules, such as anthraquinones, phenanthrolines, and acridines, have extended planar aromatic structures that enable them to intercalate into G-quadruplex structures.22–26 However, only a few inorganic compounds for use in a DNA detection system based on the G-quadruplex structure are presently known.27
The endoplasmic reticulum (ER) is a cell organelle in all eukaryotic cells and forms an interconnected network of flattened, membrane-enclosed sacs or tubes. Typically, the ER membrane constitutes more than half of the total membrane of an animal cell. The ER is separated from the cytosol by the ER membrane that mediates the selective transfer of molecules between the two compartments. The surface of the rough ER is embedded with protein-manufacturing ribosomes. The smooth ER has functions in several metabolic processes including the synthesis of lipids, phospholipids, and steroids. However, a few emission probes of small molecules have been reported to image the ER. The reported ER probes are boron-dipyrromethane compounds known as the ER-tracker series, 3,3′-dihexyloxacarbocyanine iodide, and metal complexes containing europium(III), platinum(II), and zinc(II).28–32 Transition metal complexes as luminescent cellular imaging agents have attracted much interest due to their large Stokes shifts, excitation energy in the visible region, and relatively high photostability. Although the cellular internalization of luminescent Ru(II) complexes targeting nuclear DNA has often revealed non-nuclear localizations,33–38 dinuclear Ru(II) complexes have recently shown potential for visualization of lipophilic intracellular structures using confocal imaging.39
In this study, two organometallic dinuclear iridium complexes containing an aromatic bridging ligand were prepared and used for selective interaction with biomolecules and cell imaging. We demonstrated that the Ir complexes bearing phenanthroline exhibit selective emission enhancement upon interaction with G-quadruplex DNA structures and liposomes. Furthermore, the Ir probes can specifically luminate the ER in live cells.
Experimental section
Materials and instrumentation
Water was purified with a MilliQ purification system. All reagents purchased from Aldrich were used without further purification. Benzo(h)quinolone (bhq, Fig. 1) was prepared according to the literature.40,41 Dinuclear iridium precursors Ir2(bhq)4Cl2 and Ir2(ppy)4Cl2 were prepared according to the literature.42–45Synthesis of [(bhq)2Ir(tppz)Ir(bhq)2](PF6)2 (1)
Ir2(bhq)4Cl2 (0.12 mmol) and tppz (0.12 mmol) were refluxed in a mixture of methanol and dichloromethane (2![[thin space (1/6-em)]](https://www.rsc.org/images/entities/char_2009.gif) :
:![[thin space (1/6-em)]](https://www.rsc.org/images/entities/char_2009.gif) 3) for 24 h. Then, the solvent was dried and redissolved in distilled water. The mixture was transferred to a solution of ammonium hexafluorophosphate and a precipitate was formed. The greenish yellow solid precipitate was then filtered and recrystallized in acetone and water. Elemental analysis for C76H44F12Ir2N10P2. calc. C 51.53%, H, 2.50%, N, 7.91%, observed C 51.41%, H, 2.72%, N, 7.89%. ESI-MS: m/z = 1627.43 observed (m/z = 1627.27 calculated for [2Ir3+ + tppz + 4bhq + PF6−]+) (Fig. S1, ESI†). 1H-NMR (300 MHz, DMSO-d6, Fig. S2, ESI†): δ 6.25–6.31 (d, J = 6.9 Hz, 4H), 7.00–7.24 (m, 4H), 7.24–7.29 (d, J = 6.9 Hz, 4H), 7.52–7.615 (t, J = 7.4 Hz, 4H), 7.73–7.83 (d, J = 6.9 Hz, 4H), 7.86–8.01 (t, J = 7.0 Hz, 4H), 8.11–8.23 (m, 4H), 8.24–8.83 (m, 4H), 8.39–8.58 (d, J = 6.9 Hz, 4H), 10.21–10.26 (d, J = 6.9 Hz, 4H); 13C-NMR (500 MHz, DMSO-d6): δ 121.08, 123.07, 124.49, 127.44, 128.67, 130.20, 132.18, 134.50, 136.62, 137.47, 138.12, 138.41, 140.78, 146.94, 149.63, 150.08, 151.33, 153.54, 155.10, 157.65.
3) for 24 h. Then, the solvent was dried and redissolved in distilled water. The mixture was transferred to a solution of ammonium hexafluorophosphate and a precipitate was formed. The greenish yellow solid precipitate was then filtered and recrystallized in acetone and water. Elemental analysis for C76H44F12Ir2N10P2. calc. C 51.53%, H, 2.50%, N, 7.91%, observed C 51.41%, H, 2.72%, N, 7.89%. ESI-MS: m/z = 1627.43 observed (m/z = 1627.27 calculated for [2Ir3+ + tppz + 4bhq + PF6−]+) (Fig. S1, ESI†). 1H-NMR (300 MHz, DMSO-d6, Fig. S2, ESI†): δ 6.25–6.31 (d, J = 6.9 Hz, 4H), 7.00–7.24 (m, 4H), 7.24–7.29 (d, J = 6.9 Hz, 4H), 7.52–7.615 (t, J = 7.4 Hz, 4H), 7.73–7.83 (d, J = 6.9 Hz, 4H), 7.86–8.01 (t, J = 7.0 Hz, 4H), 8.11–8.23 (m, 4H), 8.24–8.83 (m, 4H), 8.39–8.58 (d, J = 6.9 Hz, 4H), 10.21–10.26 (d, J = 6.9 Hz, 4H); 13C-NMR (500 MHz, DMSO-d6): δ 121.08, 123.07, 124.49, 127.44, 128.67, 130.20, 132.18, 134.50, 136.62, 137.47, 138.12, 138.41, 140.78, 146.94, 149.63, 150.08, 151.33, 153.54, 155.10, 157.65.
Synthesis of [(ppy)2Ir(tppz)Ir(ppy)2](PF6)2 (2)
Ir2(ppy)4Cl2 (0.12 mmol) and tppz (0.12 mmol) were refluxed in a mixture of methanol and dichloromethane (2![[thin space (1/6-em)]](https://www.rsc.org/images/entities/char_2009.gif) :
:![[thin space (1/6-em)]](https://www.rsc.org/images/entities/char_2009.gif) 3) for 24 h. The solvent was evaporated and then redissolved in distilled water. The mixture was added dropwise to a solution of ammonium hexafluorophosphate and the reddish precipitate formed was filtered and recrystallized in acetone and water. Elemental analysis for C68H44F12Ir2N10P2: C 48.75%, H 2.65%, N 8.36%, observed C 48.11%, H, 2.79%, N, 8.89%. ESI-MS (m/z): 1531.07 observed (1531.27 calculated for [2Ir3+ + tppz + 4pph + PF6−]+) (Fig. S3, ESI†). 1H-NMR (300 MHz, DMSO-d6, Fig. S4, ESI†): δ 6.302 (d, J = 7.5 Hz, 4H), 7.00 (m, 4H), 7.024–7.11 (m, 8H), 7.68–7.71 (d, J = 6.6 Hz, 4H), 7.95–7.99 (t, J = 8.5 Hz, 4H), 8.01–8.30 (d, J = 6.6 Hz, 4H), 8.33–8.37 (t, J = 8.0 Hz, 4H), 8.339–8.416 (t, J = 7.5 Hz 4H), 10.29–10.29 (d, J = 12 Hz, 4H). 13C-NMR (500 MHz, DMSO-d6): δ 120.73, 123.25, 124.56, 125.85, 129.36, 130.78, 131.03, 131.85, 139.54, 140.77, 144.73, 150.05, 150.27, 156.07, 167.51, 206.06, 207.16.
3) for 24 h. The solvent was evaporated and then redissolved in distilled water. The mixture was added dropwise to a solution of ammonium hexafluorophosphate and the reddish precipitate formed was filtered and recrystallized in acetone and water. Elemental analysis for C68H44F12Ir2N10P2: C 48.75%, H 2.65%, N 8.36%, observed C 48.11%, H, 2.79%, N, 8.89%. ESI-MS (m/z): 1531.07 observed (1531.27 calculated for [2Ir3+ + tppz + 4pph + PF6−]+) (Fig. S3, ESI†). 1H-NMR (300 MHz, DMSO-d6, Fig. S4, ESI†): δ 6.302 (d, J = 7.5 Hz, 4H), 7.00 (m, 4H), 7.024–7.11 (m, 8H), 7.68–7.71 (d, J = 6.6 Hz, 4H), 7.95–7.99 (t, J = 8.5 Hz, 4H), 8.01–8.30 (d, J = 6.6 Hz, 4H), 8.33–8.37 (t, J = 8.0 Hz, 4H), 8.339–8.416 (t, J = 7.5 Hz 4H), 10.29–10.29 (d, J = 12 Hz, 4H). 13C-NMR (500 MHz, DMSO-d6): δ 120.73, 123.25, 124.56, 125.85, 129.36, 130.78, 131.03, 131.85, 139.54, 140.77, 144.73, 150.05, 150.27, 156.07, 167.51, 206.06, 207.16.
Preparation of G-quadruplex DNA
Stock solutions of 50 μM oligonucleotides GQ1–GQ4 in sodium phosphate buffer (pH 7.4) containing 150 mM KCl were annealed at 90 °C for 10 min, cooled to room temperature, and stored in the freezer for further use.Absorption and emission measurements
Samples for absorption and emission measurements were prepared as follows: DNA (1–5 μM) and the Ir complex (5 μM) were diluted in sodium phosphate buffer (0.05 mM, pH 7.4) with 30 mM KCl to a final volume of 600 μL. The mixture was allowed to equilibrate for 1 h. UV-Visible and emission spectra were collected using a Perkin-Elmer model Lambda 2S UV/Vis and a Perkin-Elmer LS55 fluorescence spectrometer, respectively.CD measurements
Optical rotations of the Ir complexes with and without DNA were determined at ambient temperature using a JASCO J-810 polarimeter. CD experiments were performed at room temperature using a cell with a 1 cm path length; CD spectra were collected from 220 to 320 nm with a scanning speed of 200 nm min−1. The bandwidth was 5 nm. All CD spectra were baseline-corrected for signal contributions due to buffer.Cell culture
HeLa cell (human epithelial adenocarcinoma) lines were purchased from Korea Cell Line Bank (Seoul, Korea). Cells were grown in high glucose Dulbecco's modified Eagle's medium (DMEM) supplemented with 10% heat-inactivated fetal bovine serum, 100 U mL−1 penicillin and 100 U mL−1 streptomycin. All cells were maintained in an incubator at 37 °C and in a 5% CO2/air environment.Confocal microscopy imaging
Cells were seeded in 35 mm glass-bottomed dishes at a density of 3 × 10⁵ cells per dish in DMEM medium. After 24 h, 10 μM sensor (0.1% DMSO) was added to the cells and the cells were incubated for 1 h at 37 °C. After washing twice with Dulbecco's phosphate buffered saline (DPBS) to remove the residual probe, the cells were incubated with 1 μM ER-Tracker Green for ER staining (glibenclamide BODIPY FL, ThermoFisher Scientific, USA) and 0.5 μg mL−1 DAPI for nucleus staining (Sigma) in Hank's Balanced Salt Solution (HBSS) with calcium and magnesium for 30 min at 37 °C. After rinsing with DPBS, fluorescence images were acquired using a confocal laser scanning microscope (Fluoview 1200, Olympus, Japan). Excitation and emission conditions of each sample were as follows: probes 1 and 2 (ex. 405 nm laser diode/em. 575–675 nm), ER Tracker (ex. 473 nm laser diode/em. 490–590 nm), and DAPI (ex. 405 nm laser diode/em. 430–455 nm).To identify the energy dependent cellular uptake of the Ir probes, cells were pre-incubated at 4 °C or 37 °C for 30 min. After this pre-incubation, the probes were added to cell cultures and incubated at 4 °C or 37 °C for 1 h and the emission of each probe in the cell was imaged using confocal microscopy.
Cytotoxicity test
Cells were seeded in 96-well plates with culture media. After overnight culture, cells were incubated with either probe 1 or 2 for 24 h. To identify cell viability, reagents were removed, 0.5 mg mL−1 of 3-(4,5-dimethyl-2-thiazolyl)-2,5-diphenyltetrazolium bromide (MTT; Sigma) medium was added to wells, and the cells were incubated for 4 h at 37 °C in CO2. The produced formazan was dissolved in 0.1 mL DMSO and read at OD 650 nm with a Spectramax Microwell plate reader. Absorbance was determined, and the mean cell viability was calculated as a percentage of the mean vehicle control; experiments were performed in triplicate. IC50 values of each sample were calculated from plotted curve results using untreated cells as 100%.Results and discussion
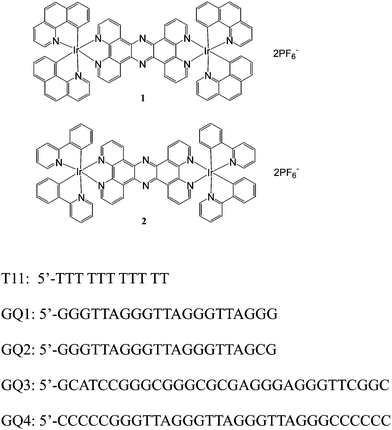
Two diiridium complexes benzo(h)quinoline (bhq) (1) and phenyl-pyridine (ppy) (2) containing tetrapyrido[3,2-a:2′,3′-c:3′′,2′′-h:2′′′,3′′′-j]phenazine (tppz) as the bridging ligand (Fig. 1) were prepared and their spectroscopic properties were studied in phosphate buffer at pH = 7.0. Complex 1 showed absorption bands at 239, 260, and 400 nm, and complex 2 at 268 and 390 nm (Fig. 2). The bands at 239 and 260 nm of 1 and that at 268 nm of 2 were derived from bhq- and ppy-centered π–π* electronic transitions, as assigned to other Ir(III) mononuclear complexes.46,47 The weak bands at 400 nm and 390 nm were attributed to the metal-to-ligand charge transfer transitions.48,49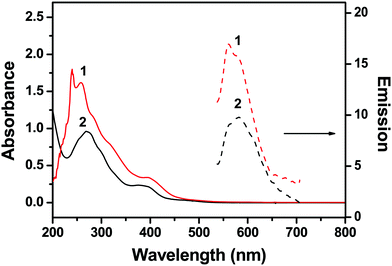 | ||
| Fig. 2 Absorption and emission spectra of 10 μM 1 and 2 in 50 mM Na-phosphate buffer (pH = 7.4). Emission spectra were obtained after excitation at 400 nm. | ||
Selective luminescence properties of G-quadruplex
Complex 1 showed a broad emission band at 565 nm and complex 2 at 570 nm (Fig. 2). Various Ru and Ir complexes containing conjugated aromatic ligands have been studied for emission properties during interaction with DNA, which often showed highly enhanced phosphorescence emissions. Such emission enhancements are usually derived from the hydrophobic interaction of metal complexes with the base pairs of double-stranded DNA. Therefore, complexes 1 and 2 were examined in order to investigate the interactions with DNA. Calf-thymus DNA (CT-DNA), single-stranded oligonucleotide T11, and four different single-stranded oligonucleotides containing G-rich sequences (GQ1–GQ4) were used in the photophysical studies on complexes 1 and 2 (Fig. 1). Oligonucleotides GQ1–GQ4 were treated with potassium ions to encourage them to fold as G-quadruplex structures before use (see Experimental section). Complex 1 showed enhanced emission bands at 570 nm upon interactions with GQ1–GQ4, but a decrease in emission with T11 and CT-DNA (Fig. 3). However, complex 2 showed enhancement with all DNA at 571 nm and no consistent trend in emission intensity for G-quadruplex structures (Fig. S5, ESI†). The emission bands of complexes 1 and 2 were slightly red-shifted after addition of DNA, and no significant red-shifts in the emission of RuII–IrIII complexes were observed after treatment with double-stranded DNA.50 Interestingly, the emission band of complex 1 was selectively enhanced with all G quadruplex structures compared with those obtained with CT-DNA and T11, but complex 2 showed no clear selectivity for the G quadruplexes. The emission enhancements of complex 1 with the G quadruplex structures indicated selective hydrophobic interactions with the G quadruplex structures. Reportedly, (phen)2Ru(dppz)Ru(phen)2 and (bpy)2Ru(dppz)Ru(bpy)2 complexes interact with calf-thymus DNA through non-intercalative groove-binding, based on binding affinity and viscosity studies.39 In a previous study on the interaction of G-quadruplexes with a dinuclear Ru(II) complex containing bpy, no clear interaction between electrostatic interaction and external stacking was found.43 However, extended planar aromatic electron-deficient organic molecules are reported to easily intercalate into G-quadruplexes and improve their stability. We believe that 1 also had such an interaction with G-quadruplex structures.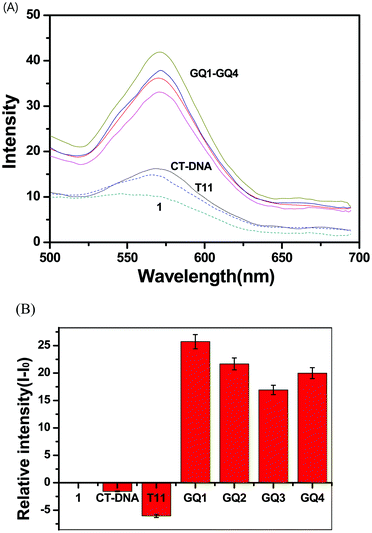 | ||
| Fig. 3 (A) Luminescence spectra of 1 (2.0 μM) in the presence of GQ1–GQ4, CT-DNA, and single-stranded T11 in 50 mM Na-phosphate buffer (pH = 7.4). (B) Relative intensity (I − Io) plots of 1. | ||
CD measurements with G-quadruplexes
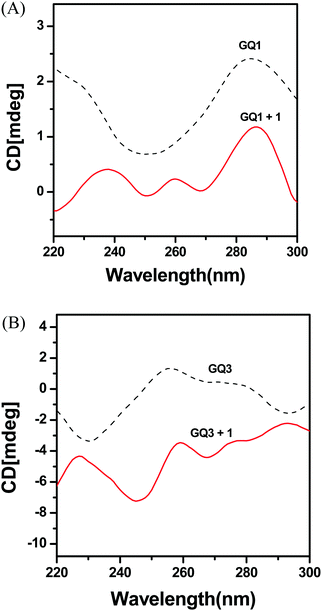
Circular dichroism (CD) spectra are associated with a specific difference in the features of strand folding, i.e., the relative orientation of the strands for G-quadruplex structures; antiparallel when having a positive peak around 290 nm and a negative peak near 260 nm; parallel when having a positive peak around 260 nm and a negative peak near 240 nm.42–45 GQ1 and GQ2 formed an antiparallel G-quadruplex in buffer, as shown by the positive and negative peaks at 290 nm and 260 nm, respectively (Fig. 4 and Fig. S6, ESI†). GQ3 and GQ4 generated parallel G-quadruplexes, as shown by the positive and negative peaks at 260 nm and 240 nm, respectively. Furthermore, CD spectra can be used to study the binding mode of metal complexes to G-quadruplex DNA. However, after addition of complexes 1 and 2 to GQ1–GQ4, dramatic changes in the CD spectra were observed due to the interaction between the Ir complex and DNA and the absorbance of the Ir complex. The positive and negative band characteristics of the parallel and antiparallel strands of most G-quadruplexes were significantly shifted after interaction with complex 1 or 2, indicating strong interactions of external stacking and electrostatic binding. The stacking interactions caused by intercalation often exhibit relatively lower intensity in a CD spectrum compared with groove binding because a groove binder usually interacts with a larger part of double-stranded DNA and twists to follow the groove.43,51 In the CD spectra of complex 1 with GQ1, GQ3, and GQ4, lower intensities were observed, indicating possible stacking interactions between them. However, significant decreases in the CD spectra of complex 2 with GQ1–GQ4 were not observed, suggesting an electrostatic interaction.Selective emission of liposomes
Lipids, as a main component of cell membranes, also provide a hydrophobic environment in biological systems. Emission changes of complexes 1 and 2 were examined after addition of liposomes in order to investigate a possible interaction with hydrophobic membranes in the cell. Complex 1 showed a significant increase in MLCT luminescence around 550 nm after treatment with liposomes (Fig. 5). The hydrophobic dppz ligand of (bpy)2Ru(dppz)2+ is known to intercalate into double-stranded DNA and gives a strong emission in the hydrophobic environment. Based on the well-reported photophysical properties of Ru(II) complexes, the hydrophobic interaction between complex 1 and liposomes resulted in shielding from water and caused enhanced emission. The addition of liposomes to complex 2 also produced an increase in luminescence, but the enhancement was similar to that observed with complex 1.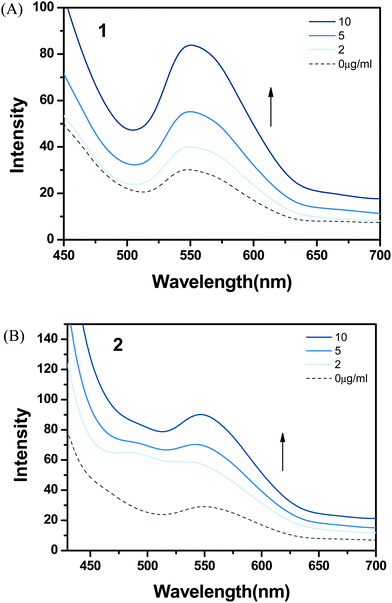 | ||
| Fig. 5 Emission spectra of (A) 1 and (B) 2 with addition of DOPC liposomes (0–10 μg mL−1) in 1% DMSO and SPB at pH 7 (excitation wavelength = 450 nm). | ||
Cellular imaging studies
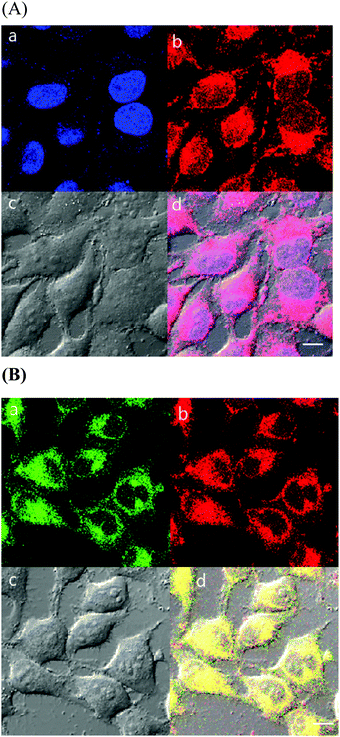
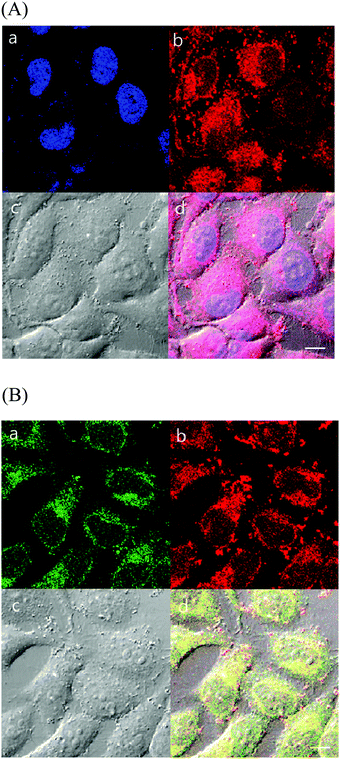
As complexes 1 and 2 possess excitation wavelengths in the visible region, large Stokes shift (more than 150 nm), and red MLCT emission, the efficacy of the Ir complexes for cellular-imaging applications was examined. To characterize the cell imaging properties of complexes 1 and 2, HeLa cells were used and visualized using confocal microscopy in live cells. Upon laser excitation at 405 nm, the HeLa cells treated with the Ir(III) probes produced emission at 575–675 nm (Fig. 6 and 7).As discussed above, probe 1 showed the ability to interact selectively with G-quadruplex DNA structures, and 1 and 2 exhibited an affinity for the hydrophobic membrane component. To further understand intracellular targeting, detailed co-localization studies were performed using overlapping emissions with established cellular emission staining markers. First, HeLa cells stained with 1 or 2 were co-stained with the nuclear dye 4′,6-diamidino-2-phenylindole (DAPI). Cellular co-localization analyses of the two emission signals showed poor overlaps of 1 as well as 2 with DAPI, demonstrating that the Ir(III) probes do not strongly co-localize with the cellular DNA probe (Fig. 6A and 7A). The poor overlap of 1 and DAPI was different from that of a similar dinuclear Ru(II) probe that demonstrated strong co-localization with DAPI emission.39 Our studies showed that aggregated chromosomes in cells remain unstained by 1 and 2, and the Ir(III) complexes in this study do not target cellular DNA under incubation conditions. This observation is not in good agreement with our in vitro results obtained with DNA, and indicates that dinuclear Ir(III) complexes are not easily internalized into the nucleus of HeLa cells within the incubation time.
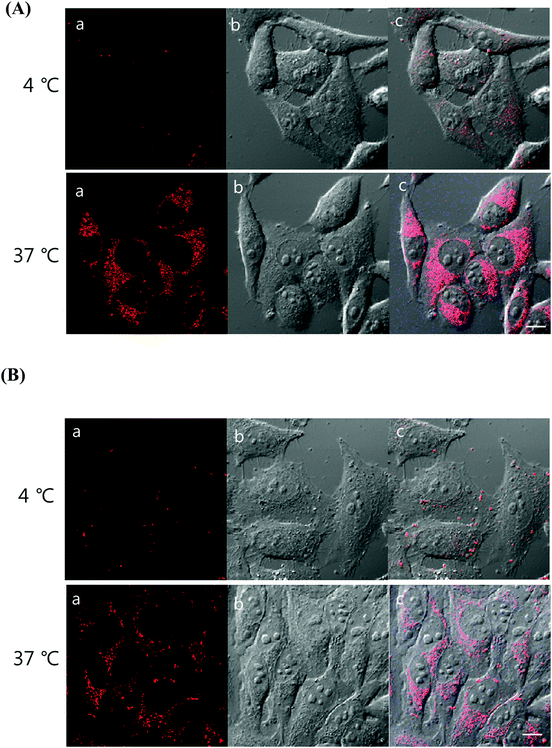
To understand the internalization mechanism of 1 and 2, HeLa cells were incubated with the Ir(III) probes at different temperatures (4 °C and 37 °C; Fig. 8). We hypothesized that the metal complexes would be internalized into the cells through passive diffusion or energy-dependent transport. Low-temperature incubation can inhibit active uptake through the energy-dependent transport mechanism. The cellular uptake of complexes 1 and 2 was temperature-dependent, resulting in significantly lower intracellular levels of the Ir(III) complexes at 4 °C than at 37 °C. As shown in Fig. 8, complex 1 was significantly more sensitive to temperature for intracellular internalization than was complex 2. The results obtained for probes 1 and 2 are in good agreement with those observed with similar dinuclear Ru(II) probes which proposed the involvement of an active transport mechanism.39 Puckett and Barton reported that increasing the lipophilicity of Ru(II)–dppz complexes can promote greater cellular uptake due to passive diffusion.37,52 As shown through the temperature dependence of complexes 1 and 2, a clear conclusion about the internalization mechanism was not obtained, but the significant difference in cellular uptake could be derived from the existence of the extra aromatic rings in complex 1.
As shown in the results obtained with liposomes above, 1 and 2 showed lipophilic properties that strongly interacted with membrane structures. The ER, a lipid-dense organelle within the cell, contains highly lipophilic regions. To understand the nature of the intracellular localization of 1 and 2, co-staining methods were employed using ER-Tracker Green. The cellular localization and co-staining results of ER-Tracker Green (λex = 473 nm, λem = 490–590 nm) and 1 (λex = 405 nm, λem = 575–675 nm) are shown in Fig. 6B. The emission co-staining of 1 and ER-Tracker Green revealed a clear overlap within HeLa cells. The same experiment with 2 (λex = 405 nm, λem = 575–675 nm) showed similar results (Fig. 7B). Complex 1 showed a clearer image of ER than complex 2. In other studies reported with Ru(II)–dppz systems, dinuclear Ru(II), and mononuclear Ir(III) complexes, the membrane-dense ER was also targeted in cells.37,39,53
We also examined color merging using a mitochondria-specific probe Mitotracker. Pink-colored Mitotracker merged in some part of the whole with red-colored 1, but some sections of red and pink colors showed no merging (Fig. S7, ESI†). Thus, 1 seems to have more efficient access to the ER in the cytoplasm. Probe 2 also showed similar results with Mitotracker (Fig. S8, ESI†).
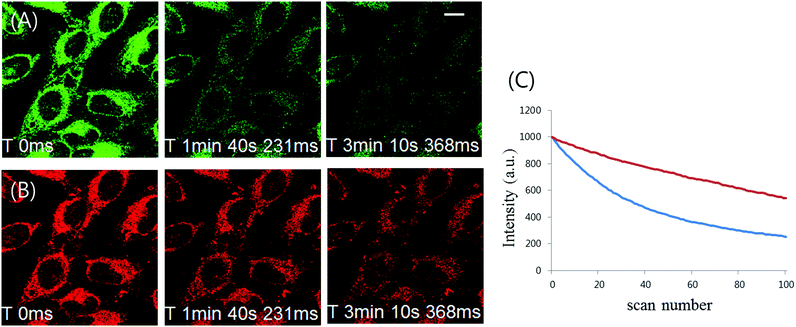
In order to be a more useful tool for dynamic cell tracking, the probe loaded into live cells should displayed strong resistance to photo-bleaching. Photostability comparison between 1 and ER tracker was thus performed by labeling the cells with these fluorophores. Fluorescence from ER tracker was rapidly eliminated and almost disappeared just within 5 min of exposure to their laser excitation source (Fig. 9A). In parallel to this, a photostability study demonstrated that the phosphorescence intensity of 1 decreased by about 35% after 100 scans (Fig. 9B and C). These photostability results present 1 and 2 as good labeling probes for applications requiring prolonged continuous excitation such as time-lapse confocal microscopy (Fig. S9, ESI†).
Cytotoxicity test
Complexes 1 and 2 were found to pass through the cell membrane and stain the organelles in the cytosol. Next, the cell viability of 1 and 2 toward cancer cell lines was examined. The cytotoxicity of 1 and 2 was examined using the MTT assay, affording half-inhibitory IC50 concentrations. The IC50 values of 1 and 2 were compared with the anticancer drug cisplatin used as a positive control for the cytotoxicity study (Table 1 and Fig. 10). The half inhibitory concentrations (IC50) of 1 and 2 were 15.6 and 18.2 μM, respectively, over a 24 h incubation period. Both probes demonstrated appreciable cytotoxicity toward the HeLa cell line. The cell viability was not significantly altered after treatment with 1 or 2 up to 10 μM in the culture medium (Fig. 10). The IC50 value of 1 was lower than that of 2, which is in good agreement with the cellular uptake results discussed above. Under the same conditions, the relatively good cellular uptake level of 1 could be the cause of the difference in the IC50 values between the complexes.| Reagent | IC50 (μM) |
|---|---|
| IC50 values of each sample were calculated from the plotted curves. The results are expressed as mean ± standard deviation of three independent experiments. | |
| 1 | 15.6 ± 1.5 |
| 2 | 18.2 ± 1.8 |
| Cisplatin | 31.3 ± 3.6 |
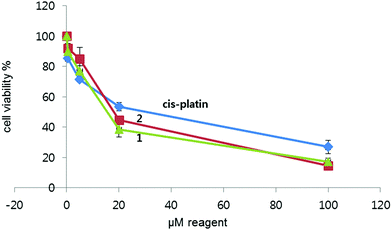 | ||
| Fig. 10 Cytotoxic effect of the iridium probes. HeLa cells were incubated with each concentration of 1 and 2 for 24 h at 37 °C. | ||
Conclusions
The physical properties of metal complexes can be altered by changing the hydrophobic characteristics or the charge of metal complexes to promote cellular internalization. Two new dinuclear Ir(III) complexes containing benzo(h)quinolone (bhq) or phenyl-pyridine (ppy) have been prepared with a bridging ligand of conjugated heterocyclic aromatic rings in order to study the functional properties, cellular uptake, and intracellular targeting. Both Ir(III) complexes showed an appreciable affinity for DNA, and the bhq complex possessed a unique affinity for G-quadruplex structures. However, cellular imaging of the two Ir(III) complexes illustrated non-nuclear staining, as reported with most other metal probes. Both Ir(III) complexes, which showed lipophilic interactions with liposomes, targeted the lipid-dense ER in live cells. Further studies on the interactions of metal complexes with organelles will provide more insights into specific organelle imaging and biomedical applications.Acknowledgements
This work was supported by the National Research Foundation of Korea's (NRF) grant funded by the Korean Government (MEST) (NRF-2016R1A2B4012488). This work was also supported by a grant from the National Creative Research Initiative Programs of the National Research Foundation of Korea (NRF) funded by the Korean Government (MSIP) (No. 2012R1A3A2048814).References
- K. K.-W. Lo, A. W.-T. Choi and W. H.-T. Law, Dalton Trans., 2012, 41, 6021 RSC.
- Q. Zhao, C.-C. Huang and F. Li, Chem. Soc. Rev., 2011, 40, 2508 RSC.
- E. Baggaley, J. A. Weinstein and J. A. G. Williams, Coord. Chem. Rev., 2012, 256, 1762 CrossRef CAS.
- C. Metcalfe and J. A. Thomas, Chem. Soc. Rev., 2003, 32, 215 RSC.
- M. Ardhammer, P. Lincoln and B. Norden, J. Phys. Chem. B, 2001, 105, 11363 CrossRef.
- J.-C. Chambron and J.-P. Sauvage, Chem. Phys. Lett., 1991, 182, 603 CrossRef CAS.
- A. E. Friedman, J.-C. Chambron, J.-P. Sauvage, N. J. Turro and J. K. Barton, J. Am. Chem. Soc., 1990, 112, 4960 CrossRef CAS.
- A. W. McKinley, P. Lincoln and E. M. Tuite, Coord. Chem. Rev., 2011, 255, 2676 CrossRef CAS.
- F. R. Svensson, M. Li, B. Norden and P. Lincoln, J. Phys. Chem. B, 2008, 112, 10969 CrossRef CAS PubMed.
- H.-J. Zhong, L. Lu, K.-H. Leung, C. C. L. Wong, C. Peng, S.-C. Yan, D.-L. Ma, Z. Cai H.-M. D. Wang and C.-H. Leung, Chem. Sci., 2015, 6, 5400 RSC.
- C. Yang, F. Mehmood, T. L. Lam, S. L.-F. Chan, Y. Wu, C.-S. Yeung, X. Guan, K. Li, C. Y.-S. Chung, C.-Y. Zhou, T. Zou and C.-M. Che, Chem. Sci., 2016, 7, 3132 Search PubMed.
- L.-J. Liu, L. Lu, H.-J. Zhong, B. He, D. W. J. Kwong, D.-L. Ma and C.-H. Leung, J. Med. Chem., 2015, 58, 6697 CrossRef CAS PubMed.
- D.-L. Ma, M. Wang, B. He, C. Yang, W. Wang and C.-H. Leung, ACS Appl. Mater. Interfaces, 2015, 7, 19060 CAS.
- M. Wang, W. Wang, T.-S. Kang, C.-H. Leung and D.-L. Ma, Anal. Chem., 2016, 88, 981 CrossRef PubMed.
- J. S. Nam, M.-G. Kang, J. Kang, S.-Y. Park, S. J. C. Lee, H.-T. Kim, J. K. Seo, O.-H. Kwon, M. H. Lim, H.-W. Rhee and T.-H. Kwon, J. Am. Chem. Soc., 2016, 138, 10968 CrossRef CAS PubMed.
- S. Mandal, D. K. Poria, R. Ghosh, P. S. Ray and P. Gupta, Dalton Trans., 2014, 43, 17463 RSC.
- J. Sun, F. Zhong, X. Yi and J. Zhao, Inorg. Chem., 2013, 52, 6299 CrossRef CAS PubMed.
- P. Majumdar, X. Yuan, S. Li, B. L. Guennic, J. Ma, C. Zhang, D. Jacquemin and J. Zhao, J. Mater. Chem. B, 2014, 2, 2838–2854 RSC.
- C. Dolan, R. D. Moriarty, E. Lestini, M. Devocelle, R. J. Forster and T. E. Keyes, J. Inorg. Biochem., 2013, 119, 63 CrossRef PubMed.
- V. Gabeilca, E. S. Baker, M.-P. Teulade-Fichou, E. De Pauw and M. T. Bowers, J. Am. Chem. Soc., 2007, 129, 895 CrossRef PubMed.
- G. Saretzki, Cancer Lett., 2003, 194, 209 CrossRef CAS PubMed.
- D. Sun, B. Thomposon, B. E. Cathers, M. Salazar, S. M. Kerwin, J. O. Trent, T. C. Jenkins, S. Neidle and L. H. Hurley, J. Med. Chem., 1997, 40, 2113 CrossRef CAS PubMed.
- M. A. Read, R. J. Harrison, B. Romagnoli, F. A. Tanious, S. H. Gowan, A. P. Reszka, W. D. Wilson, L. R. Kelland and S. Neidle, Proc. Natl. Acad. Sci. U. S. A., 2001, 98, 4844 CrossRef CAS PubMed.
- J.-L. Mergny, L. Lacroix, M.-P. Teulade-Fichou, C. Hounsou, L. Guittal, M. Hoarau, P. B. Arimondo, J.-P. Vigneron, J.-M. Lehn, J.-F. Riou, T. Garestier and C. He`le`lne, Proc. Natl. Acad. Sci. U. S. A., 2001, 98, 3062 CrossRef CAS PubMed.
- R. A. Heald, C. Modi, J. C. Cookson and I. Hutchinson, J. Med. Chem., 2002, 45, 590 CrossRef CAS PubMed.
- S. M. Kerwin, D. Sun, J. T. Kern, A. Rangan and P. W. Thomas, Bioorg. Med. Chem. Lett., 2001, 11, 2411 CrossRef CAS PubMed.
- H. N. Kim, E.-H. Lee, Z. Xu, H.-E. Kim, H.-S. Lee, J.-H. Lee and J. Yoon, Biomaterials, 2012, 33, 2282 CrossRef CAS PubMed.
- Y. Hai, J.-J. Chen, P. Zhao, H. Lv, Y. Yu, P. Xu and J.-L. Zhang, Chem. Commun., 2011, 47, 2435 RSC.
- T. Zou, C.-N. Lok, E. Fung and C.-M. Che, Chem. Commun., 2013, 49, 5423 RSC.
- M. F. Primik, S. Goschl, S. M. Meier, N. Eberherr, M. A. Jakupec, E. A. Enyedy, G. Novitchi and V. B. Arion, Inorg. Chem., 2013, 52, 10137 CrossRef CAS PubMed.
- B. K. McMahon, R. Pal and D. Parker, Chem. Commun., 2013, 49, 5363 RSC.
- S. Pandya, J. Yu and D. Parker, Dalton Trans., 2006, 2757 RSC.
- C. Tan, S. Wu, S. Lai, M. Wang, Y. Chen, L. Zhou, Y. Zhu, W. Lian, W. Peng, L. Ji and A. Xu, Dalton Trans., 2011, 40, 8611 RSC.
- R. B. P. Elmes, M. Erby, S. A. Bright, D. C. Williams and T. Gunnlaugsson, Chem. Commun., 2012, 48, 2588 RSC.
- H. Komatsu, K. Yoshihara, H. Yamada, Y. Kimura, A. Son, S.-I. Nishimoto and K. Tanabe, Chem. – Eur. J., 2013, 19, 1971 CrossRef CAS PubMed.
- K. K.-W. Lo, T. K. M. Lee, J. S. Y. Lau, W. L. Poon and S. H. Cheng, Inorg. Chem., 2008, 47, 200 CrossRef CAS PubMed.
- C. A. Puckett and J. K. Barton, J. Am. Chem. Soc., 2007, 129, 46 CrossRef CAS PubMed.
- M. R. Gill and J. A. Thomas, Chem. Soc. Rev., 2012, 41, 3179 RSC.
- M. R. Gill, D. Cecchin, M. G. Walker, R. S. Mulla, G. Battaglia, C. Smythe and J. A. Thomas, Chem. Sci., 2013, 4, 4512 RSC.
- J. Y. Seong, S. Hoe-Joo, S. Myungkwan, H. J. Sung and I. K. Young, Bull. Korean Chem. Soc., 2012, 33, 3645 CrossRef.
- N. Matsuo, Bull. Chem. Soc. Jpn., 2008, 47, 767 Search PubMed.
- H. Sun, Y. Tang, J. Xiang, G. Xu, Y. Zhang, H. Zhang and L. Xu, Bioorg. Med. Chem. Lett., 2006, 16, 3586 CrossRef CAS PubMed.
- S. Shi, J. Liu, T. Yao, X. Geng, L. Jiang, Q. Yang, L. Cheng and L. Ji, Inorg. Chem., 2008, 47, 2910 CrossRef CAS PubMed.
- S. Masiero, R. Trotta, S. Pieraccini, S. De Tito, R. Perone, A. Randazzo and G. P. Spada, Org. Biomol. Chem., 2010, 8, 2683 CAS.
- C. Ghimire, S. Park, K. Lida, P. Yangyuoru, H. Otomo, Z. Yu, K. Nagasawa, H. Sugiyama and H. Mao, J. Am. Chem. Soc., 2014, 136, 15537 CrossRef CAS PubMed.
- L. Flamigni, J. Collin and J. Sauvage, Acc. Chem. Res., 2008, 41, 857 CrossRef CAS PubMed.
- R. Ragni, E. A. Plummer, K. Brunner, J. W. Hofstraat, F. Babudri, G. M. Farinola, F. Naso and L. De Cola, J. Mater. Chem., 2006, 16, 1161 RSC.
- Y. You, J. Seo, S. H. Kim, K. S. Kim, T. K. Ahn, D. Kim and S. Y. Park, Inorg. Chem., 2008, 47, 1476 CrossRef CAS PubMed.
- S. Lamansky, P. Djurovich, D. Murphy, F. Abdel-Razzaq, H.-E. Lee, C. Adachi, P. E. Burrows, S. R. Forrest and M. E. Thompson, J. Am. Chem. Soc., 2001, 123, 4304 CrossRef CAS PubMed.
- A. Wragg, M. R. Gill, D. Turton, H. Adams, T. M. Roseveare, C. Smythe, X. Su and J. A. Thomas, Chem. – Eur. J., 2014, 20, 14004 CrossRef CAS PubMed.
- B. A. Armitage, Top. Curr. Chem., 2005, 253, 55 CAS.
- C. A. Puckett and J. K. Barton, Biochemistry, 2008, 47, 11711 CrossRef CAS PubMed.
- M. Matson, F. R. Svensson, B. Norden and P. Lincoln, J. Phys. Chem. B, 2011, 115, 1706 CrossRef CAS PubMed.
Footnote |
| † Electronic supplementary information (ESI) available: Additional data, such as ESI-MS, CD, and luminescence spectra. See DOI: 10.1039/c6nj02890j |
| This journal is © The Royal Society of Chemistry and the Centre National de la Recherche Scientifique 2017 |

