
Smart textiles of MOF/g-C3N4 nanospheres for the rapid detection/detoxification of chemical warfare agents†
Dimitrios A.
Giannakoudakis
 ab,
Yuping
Hu‡
a,
Marc
Florent
a and
Teresa J.
Bandosz
*ab
ab,
Yuping
Hu‡
a,
Marc
Florent
a and
Teresa J.
Bandosz
*ab
aDepartment of Chemistry, The City College of New York, New York, NY 10031, USA. E-mail: tbandosz@ccny.cuny.edu; Fax: +1-212650-6107; Tel: +1-212650-6017
bPh.D. Program in Chemistry, The Graduate Center of the City University of New York, New York, 10016, USA
First published on 28th July 2017
Abstract
Smart textiles consisting of cotton, Cu-BTC MOF and oxidized graphitic carbon nitride, g-C3N4-ox, nanospheres were synthesized and tested as nerve agent detoxification media and colorimetric detectors. Combining Cu-BTC and g-C3N4-ox resulted in a nanocomposite (MOFgCNox) of heterogeneous porosity and chemistry. Upon the deposition of MOFgCNox onto cotton textiles, a stable fabric with a supreme photocatalytic detoxification ability towards the nerve gas surrogate, dimethyl chlorophosphate, was obtained. The detoxification process was accompanied by a visible and gradual color change, which can be used for the selective detection of chemical warfare agents and for monitoring their penetration inside a protective layer. These smart textiles adsorbed almost 7 g of CWA surrogate/its detoxification products per gram of Cu. The superior performance was linked to the high dispersion of the MOF crystals on the fibers, and a specific texture promoting the availability of the active copper centers.
Conceptual insightsA bright turquoise colored cotton textile impregnated with a novel nanocomposite consisting of copper based MOF and oxidized graphitic carbon nitride (g-C3N4) nanospheres was prepared using a simple and quick impregnation route. This advanced hybrid textile showed a unique multifunctionality to adsorb, degrade, and sense a surrogate of the most dangerous and developed class of Chemical Warfare Agents (CWAs), the organophosphate nerve agents. The gradual color change of the modified cotton textile can be used to monitor the exhaustion level of this protection medium. Until now, most of the research regarding the detoxification ability of MOFs towards CWAs has focused on detoxification from a liquid phase. A vials-in-vial experimental setup developed in our laboratory allowed the examination of the interactions of the modified cotton textile against vapors of the surrogate, which is the state in which CWAs are usually deployed. The incorporation of the visible light active g-C3N4 nanospheres into the MOF not only led to mesoporosity but also drastically increased the surface reactivity. The nerve agent surrogate was oxidized to non-toxic compounds. The high dispersion of the active phase on the cotton textile resulted in a supreme adsorption of the CWA surrogate and its degradation products, which reached almost 7 grams per gram of copper. |
Introduction
Owing to political unrest in the world nowadays there is an urgent need to develop novel multifunctional materials that will efficiently protect against chemical warfare agents (CWAs). The major two categories of CWAs are the nerve agents (sarin, tabun, VX etc.) and the blistering agents (mustard gas, lewisite).1 Protective materials are expected to function either in the filters of gas masks, or as shield layers in military garments. The most common protective media/fillers currently used are impregnated activated carbons referred to as wheltherites.2,3 However, due to the growing threat posed by CWAs that can be easily and unexpectedly deployed not only in battlefields, but also in civil areas, a new generation of smart multifunctional materials is in demand. They should not only detoxify CWAs, but should also be able to detect the presence of toxic chemicals and to inform on the exposure level.Non-carbonaceous materials that have been extensively explored as CWA adsorbents/catalysts are metal oxides/hydroxides4–11 or MOFs.12,13 In the group of the latter, the most studied are NU-1000 and UiO-66,14–16 MOF-5,17 and Cu-BTC, known also as HKUST-1.18,19 The latter one, despite its sensitivity to humidity due to the open-copper sites, is an exceptionally attractive adsorbent/catalyst.17,20–22 Cu-BTC exhibits a high pore volume, and it can be synthesized on a large scale, even at room-temperature.23 So far, the application of MOFs for CWA detoxification has been only investigated with their surrogates in a liquid phase (solution or droplets).12–15,17,24,25 There are limited studies addressing the detoxification of CWAs in the vapor phase,26–29 which is the form in which they are/will be predominantly deployed. The reason for this is in the difficulties arising from handling highly toxic compounds.
Another new nonporous material that has recently gained increased attention, owing to its photoactivity in visible light, is graphitic carbon nitride (g-C3N4),30–34 referred to here as gCN. However, its photo-efficiency is rather low, because of fast electron–hole recombination.35–37 Several modification methods have been developed in order to overcome the fast recombination and also to develop porosity.38–41 Recently, we have reported that the strong oxidation of gCN resulted in gCN nanospheres (gCNox) with improved mesoporosity, high density of oxygen-containing functional groups and preserved photoreactivity in visible light.42,43 The incorporation of graphite oxide or gCN into a MOF structure was shown to be efficient to obtain better electron–hole separation and therefore an improved photocatalytic degradation of toxic compounds, compared to the parent components, mainly due to the synergistic effects of the composite formation.44–46
Cotton consists of the most abundant biopolymer, cellulose. Cotton fibers are spun into thread or yarn, forming soft, breathable, washable, and relatively cheap textiles.47 An important asset of cotton textiles for the durable deposition of advanced nanomaterials is their high hydrophilicity caused by hydroxyl groups of the cellulose. Thus, nanoengineered cotton textiles modified with metal nanoparticles exhibit new properties/functions, such as: water repellence, antistatic, wrinkle resistance, UV blocking, and antibacterial or fungicidal properties.48 However, there are no extensive studies on the possible application of nanoengineered cotton textiles in the field of the catalytic detoxification of CWAs. We have reported previously the successful deposition of a ferrihydrite active phase on cotton fibers using a simple dip-and-dry process.47 This deposition resulted in a drastically improved detoxification performance compared to bulk ferrihydrite, even though the content of the active phase was less than 10%. Unfortunately, such materials did not present the ability to sense toxic vapors.
Taking all of the above into account, as well as the need for an efficient CWA decontamination nanotechnology, the objective of this work was to introduce novel smart/multifunctional textiles of cotton fibers, modified with Cu-BTC and its nanocomposites with gCN or gCNox. Their ability to simultaneously adsorb, degrade and sense organophosphate nerve agents was tested with target-applications in a new generation of filters and protection garments. This is related to the fact that most of the nerve agents are odorless and their presence could go unnoticed until it is too late, in contrast to other CWAs such as mustard gas whose strong smell can be detected even at a very low concentration.
Experimental section
Synthesis of the materials
Graphitic carbon nitride (gCN) was prepared by heating dicyandiamide (Sigma-Aldrich) in a horizontal furnace at 550 °C for 4 h in air (heating rate of 2 °C min−1).36 Its oxidized form, gCNox, was prepared following a slightly altered Hummers oxidation method.43 Details of the preparation are presented elsewhere.42 Cu-BTC or HKUST-1 (referred here as MOF) was synthesized according to the procedure described by Millward and Yaghi,49 with small alterations. The nanocomposites were synthesized following the same procedure as for MOF, in the presence of gCN or gCNox (25 wt% of the final material). The cotton textiles were obtained from a 100% cotton white T-shirt. More details about the syntheses and the methods are described in the ESI.†Results and discussion
The first objective was to establish an economically feasible impregnation route that would result in stable multifunctional textiles. As an active phase, Cu-BTC, and its composites with gCN or oxidized gCN (addressed in ref. 46) were used. They are referred to as MOF, MOFgCN or MOFgCNox, respectively. The textiles impregnated with MOF, MOFgCN and MOFgCNox are referred to as T-M, T-MG and T-MGox, respectively. As seen in Fig. 1a, the turquoise color indicates that the active phase is homogeneously deposited on the textiles. From the thermal analysis in air, the amounts of deposited copper on T-M, T-MG and T-MGox were 1.56, 2.04, and 0.63% of the total mass of the textile, respectively. The textiles where exposed to numerous fold–unfold sequences and air blowing and the deposited phase did not detach from the textiles. This strong attachment to the fibers suggests the involvement of the OH groups of cellulose as crystal seeds for MOF growth. Details on the deposition procedure are provided in the ESI.† The successful deposition on a preserved fiber structure is also confirmed by SEM imaging (Fig. 1b). The micrographs show well-defined MOF crystals with sizes from 200 nm to 2.5 μm attached to the fibers. When the fibers were placed in an oven, the color changed from bright turquoise to dark blue, while upon exposure to ambient air, the color changed back to turquoise due to the presence of moisture (Fig. S1, ESI†). The same color changes are typical for any Cu-BTC materials. These color changes were repeatable for many cycles/days, revealing the stability of the active phase.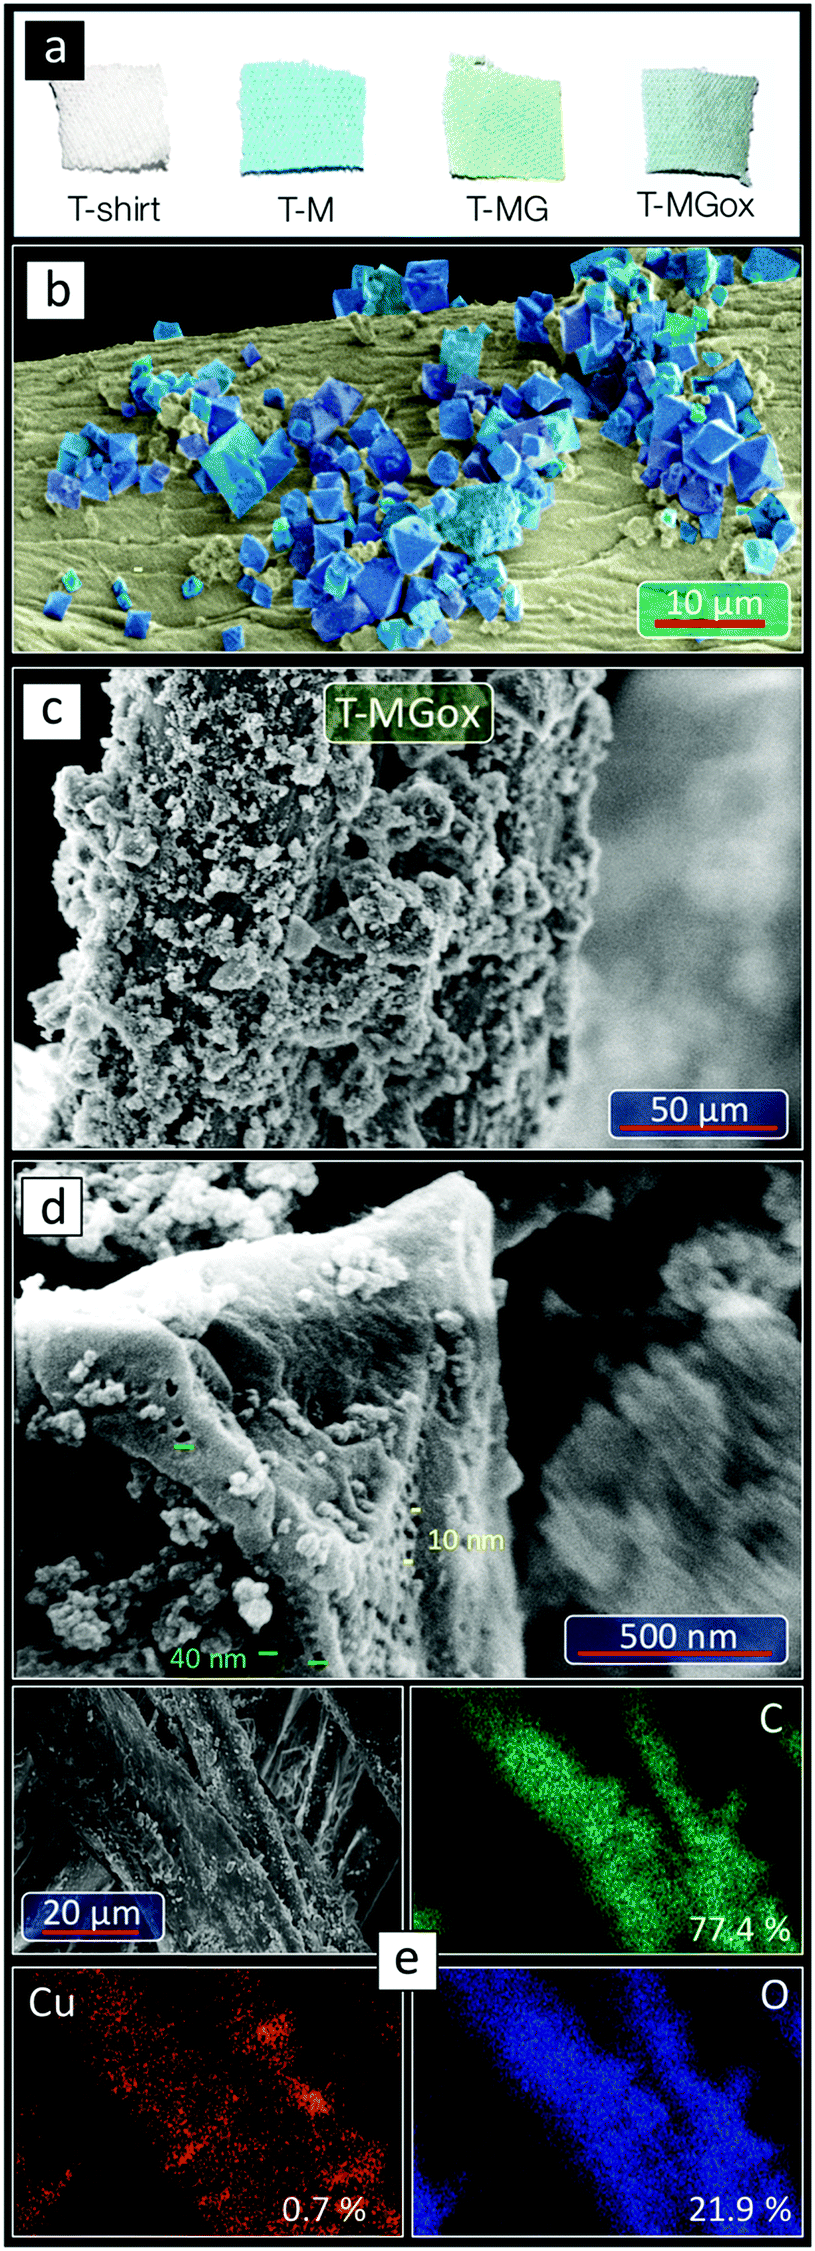 | ||
| Fig. 1 Images of the textiles. (a) Photographs of the textiles. (b) SEM image of the surface of one of T-M fibers. (c) SEM image of a fiber of T-MGox. (d) A close-up caption of a MOFgCNox crystal on the surface of T-MGox. (e) EDX elemental maps of T-MGox. | ||
The SEM images of T-MGox show that crystals of various sizes covered with graphitic carbon nitride nanospheres are homogeneously distributed on the surface of the fibers of the T-shirt. In Fig. 1d a crystal with an octahedral shape, covered with graphitic carbon nitride nanospheres is visible. The cavities on the surface of the crystal with sizes from 10 to 50 nm represent mesopores reported previously for MOFgCNox powder and linked to the composite formation.46 The EDX elemental maps showed very homogeneous dispersion of the inorganic phase on the fibers. The atomic content of copper (0.7%) is in good agreement with the results of the thermal analysis in air.
Our next and very essential task was to evaluate the multi-functionality of the hybrid textiles when exposed to DMCP vapors. As shown in Fig. 2a, the upper part of the textiles changed color, from turquoise to orange/yellowish almost instantly upon exposure. It is crucial to point out that in our vials-in-vial system, the evaporation of DMCP is a major limiting step of the reaction kinetics, since some time is needed for liquid DMCP to vaporize and saturate the headspace. The color changes gradually and after 90 minutes of exposure the modified textiles lost totally the turquoise color, and became yellowish. Bearing in mind that CWAs can be deployed as aerosols, we also tested the direct exposure of the textiles to nerve agent droplets of various volumes. T-M changed color directly after a contact with a droplet (4 μL) of DMCP (Fig. 2b). Exposure to a droplet of chloroethyl ethyl sulfide (CEES), a surrogate of mustard gas, was also tested, but no color change was observed. This indicates the selectivity of this textile to colorimetrically detect nerve gas surrogates (phosphates). The colors of the textiles exposed to 10 μL surrogate droplets are displayed in Fig. S4 (ESI†). The initial colors of the dried powdered active phases are presented in Fig. 2c. Both MOF and MOFgCN have the characteristic dark blue-mauve color, while MOFgCNox has a lighter hue of blue. The colors of MOF, MOFgCN, and MOFgCNox gradually changed during the exposure. The final color of MOF and MOFgCN after 192 hours of exposure was dark green. For MOFgCNox, the dark green color appeared after 120 hours (72 hours earlier than for the other two samples). Interestingly, the final color of this sample is light brown, suggesting differences in the surface reactivity.
 | ||
| Fig. 2 Sensing ability by color changes and adsorption performances of textiles exposed to DMCP vapors and droplets. (a) Color changes of all studied textiles after various exposure times. (b) A pristine T-shirt and T-M after the addition of 4 μL droplets of DMCP and CEES. (c) Gradual color changes as a result of the reactive adsorption process. (d) Normalized weight uptakes per gram of Cu after the subtraction of the weight uptake of the unmodified cotton textile (WUpCu). (e) The maximum weight uptakes (WUpCu) for all tested materials. (f) The role of mesoporosity in the adsorption process. (g) Availability of the reactive surface/copper sites. | ||
Another paramount important feature besides the CWA detection, is the adsorption/detoxification capability of the textiles. Thus, the weight uptakes, which are due to the adsorption of DMCP and its decomposition products, were measured for up to 192 hours of exposure at ambient light. The results showed that the deposition of the active phases on the textiles led to the increased weight uptakes per gram of copper (WUpCu, eqn (S1), ESI†) (Fig. 2d). Particularly for T-MGox, WUpCu reached 6.7 g g−1 of Cu after 192 hours of the exposure time. The maximum WUpCu was also reached faster on this sample compared to the other textiles. T-MGox showed three times higher maximum WUpCu than did T-M (Fig. 2e).
Testing of the powder form of the active phases showed that the weight uptakes on both composites in visible light were higher than that on MOF. It is important to mention that the porosity of the composites decreased compared to that of MOF (Fig. S3, ESI†). The surface areas for MOF, MOFgCN, and MOFgCNox were 1084, 710 and 392 m2 g−1, respectively.46 Interestingly, only the incorporation of the nanospheres inside the matrix of the metal organic framework led to a dramatic increase in the volume of mesopores. The observed stabilization of the weight uptake for MOFgCNox after 120 hours might be caused by this sample reaching the maximum adsorption capacity faster than the other two materials (similarly to T-MGox). Another factor might be the relatively small surface area of this composite and thus a fast filling of its pore volume. It is important to mention that pure gCN and gCNox showed the smallest weight uptakes (<100 mg g−1). This improvement in the adsorptive performance is an evidence of the synergistic effect and new chemical features, which trigger the surface reactivity. The analysis of the weight uptakes normalized per a unit surface area (Fig. S7, ESI†) confirms the enhanced activity. On MOFgCNox after 192 hours of exposure the weight uptake was 0.95 mg m−2, which is almost three times higher than the one on MOF (0.36 mg m−2) and 57% higher compared to that on MOFgCN (0.61 mg m−2).
The addition of graphitic carbon nitride to MOF resulted in an improved reactivity of the active-copper sites. The supreme weight uptake on T-MGox and MOFgCNox can be also linked to the developed mesoporosity (Fig. S3, ESI†). This mesoporosity can promote the collapse of the Cu-BTC crystals faster, since it facilitates the diffusion of DMCP to the active copper centers (Fig. 2f). The most noteworthy outcome of the adsorption tests is the dramatically higher WUpCu on the modified textiles than those on the bulk/powder active phases. This can be linked to the high dispersion of the active phase on the fibers, resulting in an increase in the accessibility and number of reactive centers/copper sites, which play a key role in the detoxification process (Fig. 2g).
Another important finding revealed by the adsorption test is the marked increase in the weight uptake (WU) of the composites measured in visible light in comparison to the results collected in the dark (Fig. 3a). This clearly indicates the photoactivity of these materials. In contrast, the amounts adsorbed on MOF are almost the same at both conditions. The band gaps of gCN and gCNox are 2.8 eV and 3.4 eV,42 respectively. Even though the band gap of the gCNox nanospheres suggests a photoactivity in the Near UV, its presence in the composite led to a remarkably high photoactivity under ambient light irradiation.42,46 This could be linked to the synergistic effects and the new bonds between MOF and gCNox affecting the photocatalytic response of the composite. Furthermore, the performance of pure gCNox is better than that of gCN. Such a trend was also noticed when gCNox and gCN were tested as reactive adsorbents of the mustard gas surrogate, 2-chloroethyl ethylsulfide.42 Correlations between WU and the surface areas or total pore volumes were found only in the dark indicating the importance of physical adsorption (Fig. 3b). Lack of this dependence in light further supports the photoactivity resulting from the incorporation of graphitic carbon nitride and leading to the catalytic conversions of DMCP.
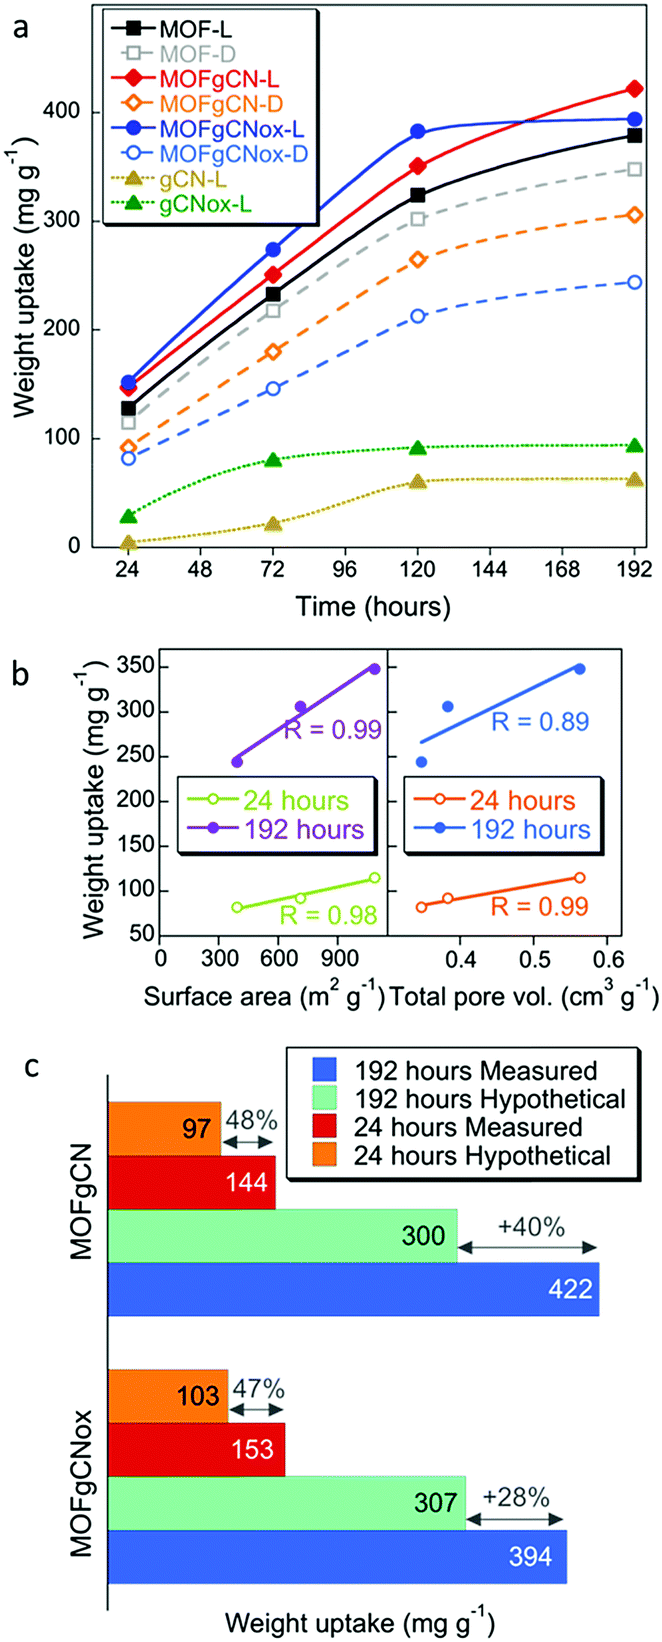 | ||
| Fig. 3 Weight uptake analysis of the powders after exposure to DMCP vapors. (a) Weight uptakes measured up to 192 hours (–L: in ambient light, –D: in the dark). (b) Dependence of the uptake on the surface area (left) and total pore volume (right) after 24 and 192 hours of exposure in the dark. (c) Comparison of the measured and hypothetical weight uptakes on the nanocomposites after 24 and 192 hours of DMCP exposure in ambient light. | ||
The comparison of the measured WU at light to the calculated hypothetical weight uptakes, assuming a physical mixture of the components (Fig. 3c), further supports the synergistic effects of the composite formation on photoreactivity.46 In a previous study, layered Cu(OH)3NO3 and its composites with graphite oxide also showed a high extent of DMCP vapor detoxification,50 but the weight uptakes (maximum ∼245 mg g−1 after 100 h) were significantly lower compared to those on materials addressed in this study.
The FTIR analysis of the exhausted T-M showed two new bands at 689 and 936 cm−1 (Fig. 4a). Those bands are assigned to formed Cu–Cl and P–OH bonds, respectively. This proves the detoxification of DMCP through hydrolysis.51 It is also associated with a collapse of the structure, which can be clearly seen in the high resolution SEM images of the initial and exposed to DMCP T-M samples (Fig. 4b). The color variations are the results of extensive changes in the coordination of copper. Considering that the color of tribasic copper chloride (Cu2(OH)3Cl) is green, the exchange of one BTC ligand of the framework with one chloride from DMCP is expected to bring a green hue to the spent materials. A further change to a yellowish color can be linked to the coordination of more Cl atoms to copper and to the formation of yellow-red CuCl2. Previously, for the spent Cu-BTC or Cu(OH)2 nanorods a color change from blue to black was reported after H2S adsorption.52,53 The color of copper hydroxyl nitrate also changed from blue-green to yellow-orange after exposure to DMCP vapors.50 In both cases, the color change was linked to the reactive adsorption, where new bonds between copper and sulfur or chlorine were formed.
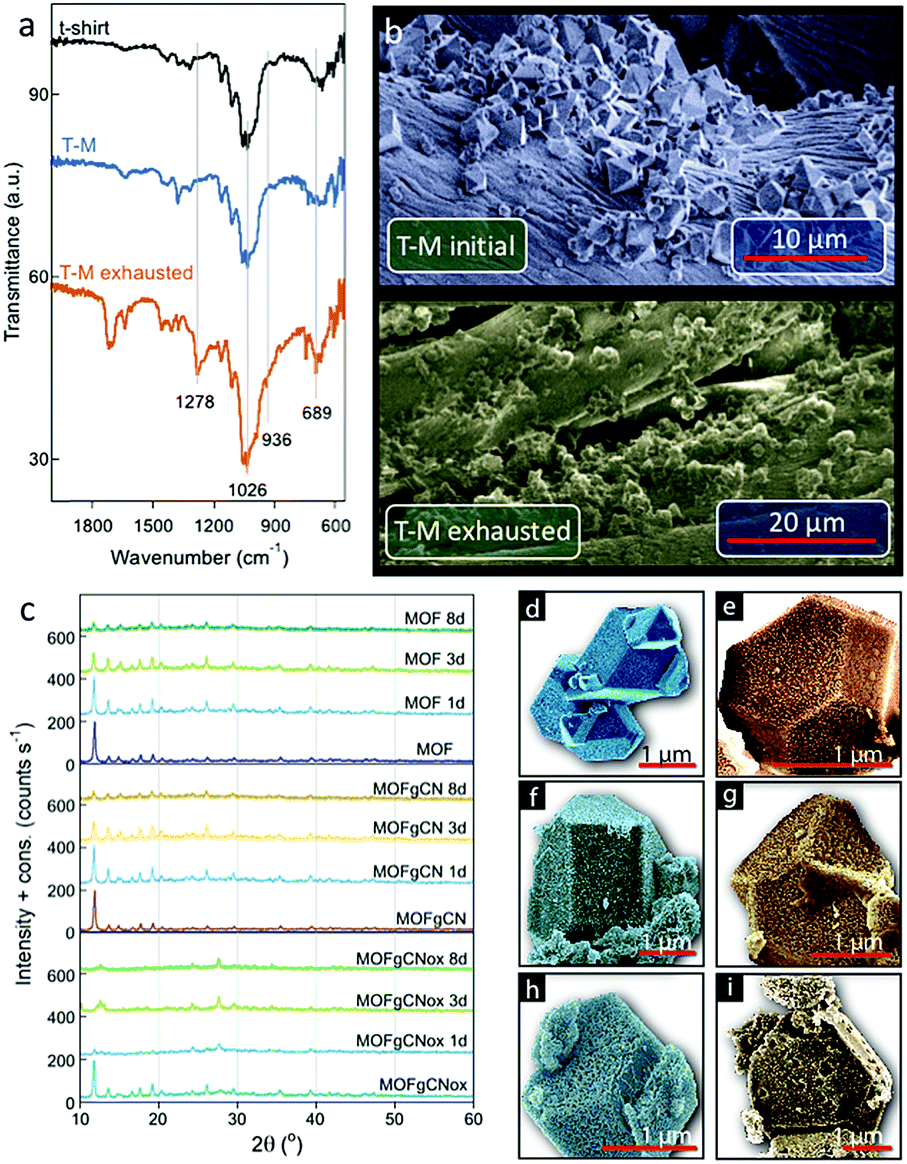 | ||
| Fig. 4 Chemical, structural and morphological analysis. (a) FTIR spectra of the initial textile, loaded with MOF (T-M) and T-M after exposure to DMCP vapors for 192 hours. (b) SEM images of the initial T-M and after exposure to DMCP vapors (90 min). (c) XRD patterns for Cu-BTC and its composites, initially and after exposure to DMCP for up to 8 days. (d and e) HRSEM images of the initial and exposed to DMCP MOF. (f and g) HRSEM images of the initial and exposed to DMCP MOFgCN. (h and i) HRSEM images of the initial and exposed to DMCP MOFgCNox. (Cyan color for the initial samples and orange color of the samples exposed to DMCP vapors for three days.) | ||
The small amount of the active phase on the tested textiles made the analysis rather difficult. In order to gain more information about the factors/properties that play a crucial role in the performance of our smart textiles and to determine the detoxification mechanisms, initial MOF, MOFgCN and MOFgCNox and their exposed-to-DMCP counterparts, were extensively characterized and analyzed. The differences in the structure of the samples after exposure to DCMP vapors are visible in the PXRD patterns after 24, 72 and 192 hours of exposure time (Fig. 4c). A gradual decrease in the intensity of the characteristic peaks attributed to Cu-BTC suggests continuous interactions of MOF with DCMP vapors. This leads to changes in its coordination chemistry and to the progressive collapse of the framework. These interactions are particularly substantial for MOFgCNox whose crystallographic structure is almost totally lost even after the first 72 hours of exposure. The remaining crystallinity of MOFgCN, on the other hand, may be related to its limited mesoporosity (0.045 m2 g−1) compared to that of MOFgCNox (0.177 m2 g−1) that hinders the diffusion of DMCP into the pore system. Longer exposure times led to the total disappearance of the characteristic peaks of Cu-BTC and thus to the formation of a highly amorphous phase. Interestingly, for exposed MOFgCNox the distinctive characteristic peak of g-C3N4 appears at 27.6°. This suggests that the collapse of the crystalline structure of Cu-BTC is more extensive than that in MOFgCN, leaving small amorphous particles deposited on the agglomerates of gCN flakes.
The morphological changes after exposure to DMCP can also be seen in the SEM images (Fig. 4d–f). After 3 days of exposure, even though well-defined particles are still visible, surface corrosion and cavities appear, especially for MOFgCNox. Such erosion could be caused by the release of gaseous species from the bulk of the crystals and the collapse of the framework. It is important to mention that all these changes occur simultaneously with about a 40% increase in the samples' weight.
Essential insights into the surface chemistry alterations and the degradation pathways of DMCP on the surface of our materials were obtained from the analysis of the FTIR spectra of the initial samples and those exposed to DMCP for various periods of time. All spectra along with their detailed analysis are presented in Fig. S9 and Table S2 (ESI†). For the exposed samples, the intensity of all bands representing coordinated carboxylic groups of the ligands decreased progressively. On the other hand, the intensity of the bands related to the ionic/acidic form of the uncoordinated BTC units gradually increased. This further supports the destruction of the MOF frameworks, as inferred from the X-ray diffractograms. In addition, the FTIR spectra suggest that DMCP vapors are initially adsorbed on the surface, and then gradually undergo hydrolysis to dimethyl phosphate (DMP). Indeed, the spectra of all exposed samples show bands at 977 and 939 cm−1 that are characteristic of the P–OH bond. For MOFgCNox, an additional band at 1021 cm−1 appeared, characteristic of the CH3–OH bond of methanol, suggesting that methanolysis took place. The latter decomposition pathway was observed only on the MOFgCNox composites exposed to DMCP under visible light. Taking into account the highest weight uptake and the lowest intensity of the band linked to DMP for this sample, it is concluded that exclusively on MOFgCNox the adsorbed DMP transforms to methanol and H3PO4. Moreover, a new band at 689 cm−1 indicates the formation of Cu–Cl bonds. All these processes are faster in the case of MOFgCNox than on the other studied powders.
The mechanism of reactive adsorption was also investigated by TA/MS (Fig. S8 and S9, ESI†). The Differential Thermal Gravimetric (DTG) curve of the MOF sample exposed to DMCP at light suggests that after 8 days of exposure the structure collapsed only partially, since the characteristic peak at 340 °C related to the decomposition of the framework has a high intensity. The structure of MOFgCN collapsed to a greater extent, and that of MOFgCNox totally collapsed, since the characteristic peak at 340 °C cannot be seen on its DTG curve. Based on the MS results, DMCP or dimethylphosphate (DMP) release occurred at two different temperatures (130 and 190 °C), which suggests chemical interactions with two energetically different sites (through hydrogen bonds or polar forces). A similar behavior was reported for various metal (hydr)oxides.54–57 Only for MOF, the thermal release of DMCP occurred close to its b.p., indicating physical adsorption. Finally, methanol (MeOH) was only detected for both composites, and only after their exposure to DMCP at light. Its amount was greater on MOFgCNox. Another fundamental finding is that the weakly adsorbed water, detected in the case of initial composites, was completely consumed during the DMCP exposure. This water likely provides hydrogen and hydroxyl radicals formed on the photoactive gCN and gCNox phases in the composites.42,46 The radicals can also oxidize nitrogen-containing functional groups at the edges of gCN/gCNox, releasing NOx. And indeed, the headspaces of the vials-in-vial system gradually gain a pale reddish color during DMCP exposure. This directed us to measure the NO/NO2 concentration (Fig. S8, ESI†). It was higher in the vessel with MOFgCNox than in that with MOFgCN. The continuous formation of NOx even in the dark suggests that it is one of the major reactions taking place during the interactions of DMCP vapors with the composites, while the enhanced release of NOx at light supports the involvement of the formed radicals. A limited NOx content was also found in the headspace of MOF, due to the impurities of unreacted Cu(NO3)2, which are estimated to be about 3.6 wt%.
The interactions of the vapors with all MOFgCNox involve a complex mechanism of several steps. Firstly, the vaporized DMCP molecules are adsorbed on the surface through various pathways. These include the complexation of the DMCP molecule on the copper sites through its P![[double bond, length as m-dash]](https://www.rsc.org/images/entities/char_e001.gif) O group, and specific interactions between DMCP and the copper-based amorphous phase that originates from the collapse of the Cu-BTC structure. The latter involves the formation of hydrogen bonds or polar interactions between the PO group and the hydroxyl groups of the uncoordinated BTC units or positively charged Cu2+, respectively. These interactions are supported by the TA-MS analysis, which showed two energetically different sites of DMCP adsorption. Similar interactions can also take place between DMCP and –NHx, –NOx and –OH groups of the gCNox phase, and this can be a crucial reason for the higher and faster weight uptake on MOFgCNox.
O group, and specific interactions between DMCP and the copper-based amorphous phase that originates from the collapse of the Cu-BTC structure. The latter involves the formation of hydrogen bonds or polar interactions between the PO group and the hydroxyl groups of the uncoordinated BTC units or positively charged Cu2+, respectively. These interactions are supported by the TA-MS analysis, which showed two energetically different sites of DMCP adsorption. Similar interactions can also take place between DMCP and –NHx, –NOx and –OH groups of the gCNox phase, and this can be a crucial reason for the higher and faster weight uptake on MOFgCNox.
The second step involves the decomposition of DMCP to DMP through hydrolysis (Fig. 5a). This reaction involves the replacement of the chlorine atom of DMCP with a hydroxyl group originating from water molecules. The Cl− ion bonds to a copper center replacing a coordinated bond with the ligand, leading to the partial collapse of the MOF framework. The formation of a new Cu–Cl bond can explain the gradual appearance of the yellowish hue. In the case of MOFgCNox, photoactivity arises from the synergistic effect between the two phases.44,46 gCNox nanospheres promote the methanolysis (Fig. 5b), by serving as the semiconductor phase, where e−/h+ pairs form. The formed CH3O˙ and ˙PO(OCH3)(OH) radicals react with H˙ and OH˙, respectively, forming methanol and methyl dihydrogen phosphate (monomethyl phosphate, MMP). The later undergoes a further photocatalytic cleavage of the remaining P–OCH3 bond, and the formed intermediate ˙PO(OH)2 transforms to H3PO4.
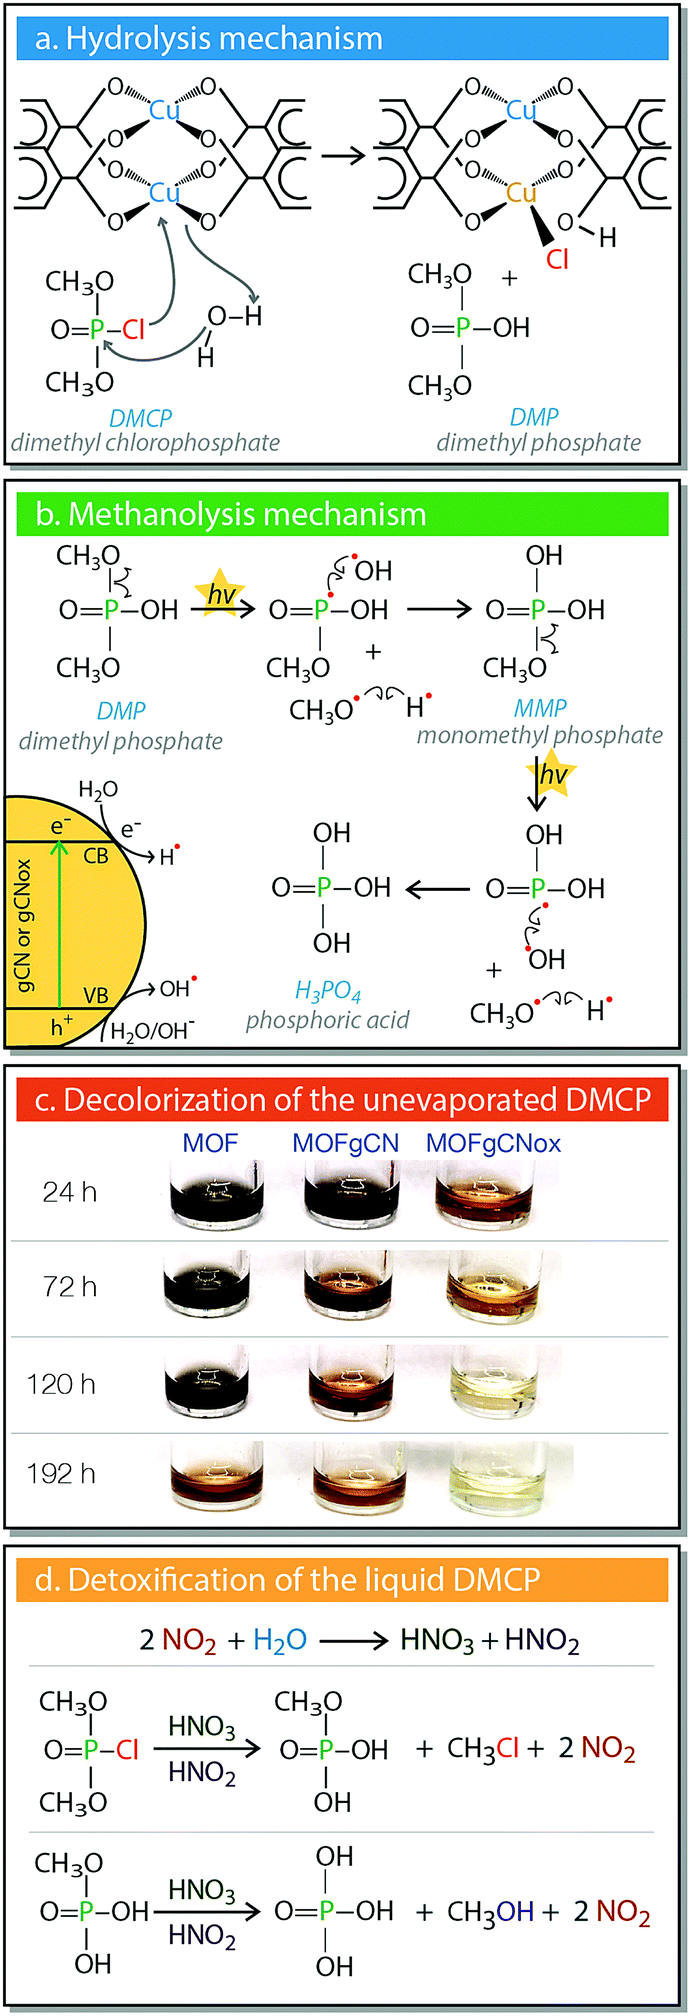 | ||
| Fig. 5 The detoxification mechanisms. (a) Hydrolysis. (b) Photocatalytic degradation to methanol and phosphoric acid. (c) Decolorization reactions of liquid DMCP. (d) The color of the liquid phase of DMCP for all samples as a result of the interactions with the gas/vapor phase. | ||
Another marked effect detected in our systems is the discoloration of the residual liquid DMCP (Fig. 5c), which is the fastest in the case of MOFgCNox. It is important to mention that the liquids were never in direct contact with the solid adsorbents, since they are located in different containers (Fig. S2, ESI†). The initial color of DMCP is black and during the adsorption it changed to deep orange and further to light yellowish. The FTIR analysis revealed the disappearance of the bands related to DMCP. On the spectra new bands linked to the P–OH stretching vibrations of the hydrated H3PO4 and to the vibrations related to methanol50,58 were detected. The gradual decolorization supports the generation of NO2 on the composites exposed to DMCP vapors under light, as discussed above. This NO2 catalytically transforms DMCP to H3PO4, as summarized in Fig. 5d.50
The T-shirt modified with MOFgCNox is the material that reached the maximum weight uptake after 72 hours of interactions with DMCP. The color of this material turned to yellowish even after 90 minutes of exposure. On the other hand, the MOFgCNox powder showed a continuous weight uptake even after 72 hours of interaction with the vapors. This was accompanied by a continuous color change. The reactivity can be also seen indirectly based on the formation of NOx species even after 72 hours (Fig. S5, ESI†). Moreover, the XRD and FTIR analyses revealed that the structure and surface chemistry of the MOFgCNox powder are altered even after 72 hours. These findings further support the fact that interactions continue to occur after 72 hours of exposure.
Both the rate and kinetics of the degradation are important aspects of the activity of reactive adsorbents of CWAs. The reactive adsorption of DMCP was found to be a complex combination of numerous interactions that occur simultaneously. The FTIR spectra showed that the intensities of new bands linked to the formation of new bonds on the surface of the powdered materials increase and the color of the DMCP liquid gradually turns to transparent. The XRD revealed that the structure of the crystals changed during the interactions. Taking into consideration the above mentioned surface chemistry and structural alterations, and the fact that the decomposition of DMCP to smaller compounds occurs simultaneously with adsorption, the evolution of the degradation could not be monitored.
Conclusions
Impregnation of an active phase consisting of the most studied Metal Organic Framework, HKUST-1 or Cu-BTC proved to be an effective, simple, and economically feasible procedure. The produced modified textile showed an advantageous performance for the detoxification of a nerve gas surrogate. More importantly, this material can be nominated as a “smart textile”, since it is capable of simultaneously adsorbing, degrading and sensing vapors or droplets of the toxic surrogate. The gradual color change that occurred upon exposure to the vapors is also a beneficial asset, because the exhaustion level can be observed. The addition of oxidized graphitic carbon nitrate nanospheres led to the formation of a novel nanocomposite, which has dramatically improved the detoxification function. When the above mentioned nanocomposite was deposited on the T-shirt fabrics, the adsorption reached almost 7 gram of vapor per gram of copper, while the introduced photoreactivity enhanced the degradation of the vapors. Finally, the formation of a limited amount (ppm) of NO2/NO species during the interactions with the vapors further facilitated the absorbent performance, since these species catalytically degrade the surrogate to non-toxic products. Even though our composites were built with only one specific ratio of the components, this factor is expected to affect their final properties and performance.Acknowledgements
This work was supported by the US Army Research Office (grant No. W911-13-0225). The help of Nikolina Travlou in the synthesis is appreciated. YH is thankful for a scholarship from the National Natural Science Foundation of China (No. 21267003). D. A. G. is grateful for the partial scholarship from Onassis foundation.References
- T. C. Marrs, R. L. Maynard and F. R. Sidell, Chemical Warfare Agents: Toxicology and Treatment, John Wiley & Sons, Ltd, 2nd edn, 2007 Search PubMed.
- D. A. Giannakoudakis, PhD thesis, CUNY Academic Works, 2017.
- P. Lodewyckx, in Activated Carbon Surfaces in Environmental Remediation, ed. T. J. Bandosz, Elsevier, 1st edn, 2006, vol. 7, pp. 475–528 Search PubMed.
- A. V. Vorontsov, L. Davydov, E. P. Reddy, C. Lion, E. N. Savinov and P. G. Smirniotis, New J. Chem., 2002, 26, 732–744 RSC.
- D. B. Mawhinney, J. A. Rossin, K. Gerhart and J. T. Yates, Langmuir, 1999, 15, 4789–4795 CrossRef CAS.
- M. Verma, R. Chandra and V. K. Gupta, J. Environ. Chem. Eng., 2016, 4, 219–229 CrossRef CAS.
- T. H. Mahato, B. Singh, A. K. Srivastava, G. K. Prasad, A. R. Srivastava, K. Ganesan and R. Vijayaraghavan, J. Hazard. Mater., 2011, 192, 1890–1895 CrossRef CAS PubMed.
- D. A. Giannakoudakis, J. A. Arcibar-Orozco and T. J. Bandosz, Appl. Catal., B, 2015, 174, 96–104 CrossRef.
- D. A. Giannakoudakis, J. K. Mitchell and T. J. Bandosz, J. Mater. Chem. A, 2016, 4, 1008–1019 CAS.
- J. A. Arcibar-Orozco and T. J. Bandosz, J. Mater. Chem. A, 2015, 3, 220–231 CAS.
- T. J. Bandosz, M. Laskoski, J. Mahle, G. Mogilevsky, G. W. Peterson, J. A. Rossin and G. W. Wagner, J. Phys. Chem. C, 2012, 116, 11606–11614 CAS.
- A. Roy, A. K. Srivastava, B. Singh, T. H. H. Mahato, D. Shah and a. K. K. Halve, Microporous Mesoporous Mater., 2012, 162, 207–212 CrossRef CAS.
- J. B. DeCoste and G. W. Peterson, Chem. Rev., 2014, 114, 5695–5727 CrossRef CAS PubMed.
- M. J. Katz, J. E. Mondloch, R. K. Totten, J. K. Park, S. T. Nguyen, O. K. Farha and J. T. Hupp, Angew. Chem., Int. Ed., 2014, 53, 497–501 CrossRef CAS PubMed.
- J. E. Mondloch, M. J. Katz, W. C. Isley III, P. Ghosh, P. Liao, W. Bury, G. W. Wagner, M. G. Hall, J. B. Decoste, G. W. Peterson, R. Q. Snurr, C. J. Cramer, J. T. Hupp and O. K. Farha, Nat. Mater., 2015, 14, 1–5 CrossRef PubMed.
- J. Zhao, D. T. Lee, R. W. Yaga, M. G. Hall, H. F. Barton, I. R. Woodward, C. J. Oldham, H. J. Walls, G. W. Peterson and G. N. Parsons, Angew. Chem., Int. Ed., 2016, 55, 13224–13228 CrossRef CAS PubMed.
- C. Montoro, F. Linares, E. Quartapelle Procopio, I. Senkovska, S. Kaskel, S. Galli, N. Masciocchi, E. Barea and J. A. R. Navarro, J. Am. Chem. Soc., 2011, 133, 11888–11891 CrossRef CAS PubMed.
- G. W. Peterson and G. W. Wagner, J. Porous Mater., 2014, 21, 121–126 CrossRef.
- S. S.-Y. Chui, S. M.-F. Lo, J. P. H. Charmant, A. Guy Orpen and I. D. Williams, Science, 1999, 283, 1148–1150 CrossRef CAS PubMed.
- C. Ge, Y. Du, R. Wang, L. Xue, Z. Wu, T. Xing, X. Ji, L. Ma and X. Zhang, J. Porous Mater., 2016, 23, 1537–1545 CrossRef CAS.
- C. Petit and T. J. Bandosz, Adv. Mater., 2009, 21, 4753–4757 CrossRef CAS.
- I. Senkovska and S. Kaskel, Microporous Mesoporous Mater., 2008, 112, 108–115 CrossRef CAS.
- J. Zhao, W. T. Nunn, P. C. Lemaire, Y. Lin, M. D. Dickey, C. J. Oldham, H. J. Walls, G. W. Peterson, M. D. Losego and G. N. Parsons, J. Am. Chem. Soc., 2015, 137, 13756–13759 CrossRef CAS PubMed.
- O. K. Farha, I. Eryazici, N. C. Jeong, B. G. Hauser, C. E. Wilmer, A. a. Sarjeant, R. Q. Snurr, S. T. Nguyen, A. Ö. Yazaydin and J. T. Hupp, J. Am. Chem. Soc., 2012, 134, 15016–15021 CrossRef CAS PubMed.
- S.-Y. Moon, E. Proussaloglou, G. W. Peterson, J. B. DeCoste, M. G. Hall, A. J. Howarth, J. T. Hupp and O. K. Farha, Chem. – Eur. J., 2016, 22, 14864–14868 CrossRef CAS PubMed.
- G. K. Prasad, T. H. Mahato, K. Ganesan and B. Singh, J. Sci. Ind. Res., 2007, 66, 582–585 CAS.
- G. K. Prasad, B. Singh, M. V. S. Suryanarayana and B. S. Batra, J. Hazard. Mater., 2005, 121, 159–165 CrossRef CAS PubMed.
- A. Saxena, B. Singh, A. Sharma, V. Dubey, R. P. Semwal, M. V. S. Suryanarayana, V. K. Rao and K. Sekhar, J. Hazard. Mater., 2006, 134, 104–111 CrossRef CAS PubMed.
- A.-T. Vu, K. Ho and C.-H. Lee, Chem. Eng. J., 2016, 283, 1234–1243 CrossRef CAS.
- X. Wang, K. Maeda, A. Thomas, K. Takanabe, G. Xin, J. M. Carlsson, K. Domen and M. Antonietti, Nat. Mater., 2009, 8, 76–80 CrossRef CAS PubMed.
- Y. Dong, Q. Wang, H. Wu, Y. Chen, C.-H. Lu, Y. Chi and H.-H. Yang, Small, 2016, 12, 5376–5393 CrossRef CAS PubMed.
- Y. Oh, V. Le, U. N. Maiti, J. O. Hwang, W. J. Park, J. Lim, K. E. Lee, Y.-S. Bae, Y.-H. Kim and S. O. Kim, ACS Nano, 2015, 9, 9148–9157 CrossRef CAS PubMed.
- G. Algara-Siller, N. Severin, S. Y. Chong, T. Björkman, R. G. Palgrave, A. Laybourn, M. Antonietti, Y. Z. Khimyak, A. V. Krasheninnikov, J. P. Rabe, U. Kaiser, A. I. Cooper, A. Thomas and M. J. Bojdys, Angew. Chem., Int. Ed., 2014, 53, 7450–7455 CrossRef CAS PubMed.
- Y. Zhao, M. Shalom and M. Antonietti, Appl. Catal., B, 2017, 207, 311–315 CrossRef CAS.
- Z. Zhao, Y. Sun and F. Dong, Nanoscale, 2015, 7, 15–37 RSC.
- M. Seredych, S. Łoś, D. A. Giannakoudakis, E. Rodríguez-Castellón and T. J. Bandosz, ChemSusChem, 2016, 9, 795–799 CrossRef CAS PubMed.
- S. A. Shevlin and Z. X. Guo, Chem. Mater., 2016, 28, 7250–7256 CrossRef CAS.
- H. Wei, Q. Zhang, Y. Zhang, Z. Yang, A. Zhu and D. D. Dionysiou, Appl. Catal., A, 2016, 521, 9–18 CrossRef CAS.
- F. Zhao, H. Cheng, Y. Hu, L. Song, Z. Zhang, L. Jiang and L. Qu, Sci. Rep., 2014, 4, 1–7 Search PubMed.
- M. Groenewolt and M. Antonietti, Adv. Mater., 2005, 17, 1789–1792 CrossRef CAS.
- P. Niu, L. Zhang, G. Liu and H. M. Cheng, Adv. Funct. Mater., 2012, 22, 4763–4770 CrossRef CAS.
- D. A. Giannakoudakis, M. Seredych, E. Rodríguez-Castellón and T. J. Bandosz, ChemNanoMat, 2016, 2, 268–272 CrossRef CAS.
- W. S. Hummers and R. E. Offeman, J. Am. Chem. Soc., 1958, 80, 1339 CrossRef CAS.
- J. Hong, C. Chen, F. E. Bedoya, G. H. Kelsall, D. O'Hare and C. Petit, Catal. Sci. Technol., 2016, 6, 5042–5051 CAS.
- H. Wang, X. Yuan, Y. Wu, G. Zeng, X. Chen, L. Leng and H. Li, Appl. Catal., B, 2015, 174–175, 445–454 CrossRef CAS.
- D. A. Giannakoudakis, N. A. Travlou, J. Secor and T. J. Bandosz, Small, 2017, 13, 1601758 CrossRef PubMed.
- R. Wallace, D. A. Giannakoudakis, M. Florent, C. Karwacki and T. J. Bandosz, J. Mater. Chem. A, 2017, 5, 4972–4981 CAS.
- A. K. Yetisen, H. Qu, A. Manbachi, H. Butt, M. R. Dokmeci, J. P. Hinestroza, M. Skorobogatiy, A. Khademhosseini and S. H. Yun, ACS Nano, 2016, 10, 3042–3068 CrossRef CAS PubMed.
- A. R. Millward and O. M. Yaghi, J. Am. Chem. Soc., 2005, 127, 17998–17999 CrossRef CAS PubMed.
- J. A. Arcibar-Orozco, D. A. Giannakoudakis and T. J. Bandosz, Adv. Mater. Interfaces, 2015, 2, 1–9 Search PubMed.
- C. N. Rusu and J. T. Yates, J. Phys. Chem. B, 2000, 104, 12292–12298 CrossRef CAS.
- C. Petit, B. Mendoza and T. J. Bandosz, ChemPhysChem, 2010, 11, 3678–3684 CrossRef CAS PubMed.
- D. A. Giannakoudakis, M. Jiang and T. J. Bandosz, ACS Appl. Mater. Interfaces, 2016, 8, 31986–31994 CAS.
- J. A. Arcibar-Orozco, S. Panettieri and T. J. Bandosz, J. Mater. Chem. A, 2015, 3, 17080–17090 CAS.
- J. A. Arcibar-Orozco, D. A. Giannakoudakis and T. J. Bandosz, Chem. Eng. J., 2016, 303, 123–136 CrossRef CAS.
- D. A. Giannakoudakis, J. A. Arcibar-Orozco and T. J. Bandosz, Appl. Catal., B, 2016, 183, 37–46 CrossRef CAS.
- M. Florent, D. A. Giannakoudakis, R. Wallace and T. J. Bandosz, J. Hazard. Mater., 2017, 329, 141–149 CrossRef CAS PubMed.
- W. W. Rudolph, Dalton Trans., 2010, 39, 9642–9653 RSC.
Footnotes |
| † Electronic supplementary information (ESI) available. See DOI: 10.1039/c7nh00081b |
| ‡ On leave from College of Chemistry and Chemical Engineering Guangxi University for Nationalities, Nanning, 530006, China and Guangxi Key Laboratory of Chemistry and Engineering of Forest Products, Nanning, 530006, China. |
| This journal is © The Royal Society of Chemistry 2017 |