
 Open Access Article
 This Open Access Article is licensed under a
 Creative Commons Attribution 3.0 Unported Licence
Quantitative determination of the sulfur-containing antioxidant ergothioneine by HPLC/ICP-QQQ-MS†
Nina
Kroepfl
 a,
Talke A.
Marschall
b,
Kevin A.
Francesconi
a,
Tanja
Schwerdtle
b and
Doris
Kuehnelt
*a
a,
Talke A.
Marschall
b,
Kevin A.
Francesconi
a,
Tanja
Schwerdtle
b and
Doris
Kuehnelt
*a
aInstitute of Chemistry, Analytical Chemistry, NAWI Graz, University of Graz, Universitaetsplatz 1, 8010 Graz, Austria. E-mail: doris.kuehnelt@uni-graz.at; Tel: +43 316 380 5316
bInstitute of Nutritional Science, University of Potsdam, Arthur-Scheunert-Allee 114-116, 14558 Nuthetal, Germany
First published on 26th June 2017
Abstract
Interest in the sulfur-containing antioxidant ergothioneine calls for reliable analytical methods for its quantification. In this work, a method based on reversed-phase high performance liquid chromatography (RP-HPLC) coupled with elemental mass spectrometry detection in mass shift mode (inductively coupled plasma triple quadrupole mass spectrometry, ICP-QQQ-MS) using oxygen as the reaction gas was developed for the element-selective determination of ergothioneine in complex biological matrices. Application of an instrumental setup using a 6-port-valve and the introduction of a methanol gradient allowed the time-efficient analysis of samples containing strongly retained sulfur species besides ergothioneine without compromising ICPMS detection. In aqueous solution, limits of detection and quantification (LOD and LOQ) of the optimized method for m/z 32 → 48 (SO+) were 0.23 μg S per L and 0.80 μg S per L, respectively; measurements in a complex matrix (human hepatocyte carcinoma cells, HepG2) resulted in an LOD of 0.6 μg S per L and an LOQ of 2.3 μg S per L. Recoveries of ergothioneine from cell pellets spiked with the analyte before cell lysis (97 ± 3%) matched those obtained for cell culture medium spiked before syringe filtration (96 ± 9%) demonstrating that sample preparation did not impair the quantitative determination of ergothioneine. When HepG2 cells were exposed to ergothioneine via the culture medium, they showed low absorption; approximately 3% of the added ergothioneine was found in cell lysates, while most of it (≥85%) remained in the cell culture medium. The method is capable of separating ergothioneine from other biologically relevant sulfur-containing species and is expected to be of broad future use. Furthermore, the potential use for the simultaneous separation of selenium species, thereby extending the scope of possible applications, was demonstrated by applying it to water extracts of oyster mushrooms.
Introduction
Ergothioneine, a natural sulfur-containing histidine derivative, was first isolated in 1909 from Claviceps purpurea, an ergot fungal infection of rye grain.1 Synthesized only by non-yeast-like fungi, bacteria of the order Actinomycetales, and cyanobacteria,2–4 ergothioneine is taken up by plants and animals through their roots and diet.5–7 The interest in ergothioneine derives from its antioxidant activity and cytoprotective effects, demonstrated by various in vitro studies;8 further investigations into the effects of ergothioneine call for analytical methods to accurately quantify this sulfur species.Quantitative determination of ergothioneine in biological samples is usually performed by HPLC with detection by either molecular mass spectrometry4,9–12 or UV absorbance.13–19 Element-selective detection by ICPMS represents an interesting alternative to these techniques as it is robust, sensitive, and allows the recording of the complete speciation of an element in a sample. Although due to these advantages HPLC/ICPMS is a common technique for elemental speciation analysis it has not been widely applied to sulfur species, mainly because of isobaric interferences on the main sulfur isotope 32S+. Approaches applied to reduce these interferences include the use of high resolution ICPMS, reaction/collision cell technology,20 or ICP-triple quadrupole-MS (ICP-QQQ-MS),21,22 with the last approach being particularly promising.
For the measurement of S by ICP-QQQ-MS, the first quadrupole selects ions of the target mass (m/z 32), which then pass through to the oxygen-charged reaction cell. Here, the analyte ions yield SO+ ions, with a mass shift to m/z 48, which are then selected for by the third quadrupole. Thus in comparison with single quadrupole/reaction cell systems, the triple quadrupole system provides great selectivity and lower background counts, which translates into better detection limits for sulfur.23 ICP-QQQ-MS has been so far mainly applied to the determination of sulfur in the field of protein quantification,23–27 with samples including solutions of sulfur-containing compounds,23,25 DNA–protein cross-linking reaction products,24 human plasma25,26 and snake venom.27
We present here a HPLC/ICP-QQQ-MS method for the quantitative determination of the health-relevant sulfur compound ergothioneine and its application to cell culture media and cell pellets. Reversed-phase chromatography was used to separate ergothioneine from other biologically relevant sulfur-containing species, and we applied a methanol gradient in combination with a 6-port-valve for the time-efficient removal of strongly retained sulfur species without compromising the stability of the ICP. With a view to future investigations comparing the biological chemistry of sulfur and selenium, we also demonstrate the potential of the method to provide simultaneous measurements of selenium and sulfur species by a first analysis of aqueous extracts of oyster mushrooms.
Experimental
Chemicals, reagents and standards
Solutions were prepared from analytical grade chemicals and Milli-Q water (18.2 MΩ cm) throughout. Ammonium formate (≥95%), ammonia solution (25%, p.a.) and hydrochloric acid (fuming, 37%, p.a.) were obtained from Carl Roth GmbH + Co. KG (Karlsruhe, Germany). Methanol (HPLC gradient grade) and acetonitrile (HPLC grade) were purchased from VWR International (Fontenay-sous-Bois, France) and Chem Lab NV (Zedelgem, Belgium), respectively. Glutathione reduced (≥98%) and glutathione oxidized (≥98%) were obtained from Carl Roth GmbH + Co. KG. L-Ergothioneine (≥98%) and L-cysteine (99+%) were purchased from Tetrahedron (Paris, France) and Acros Organics (Geel, Belgium), respectively. L-Cystine (puriss.), D,L-methionine (≥99.0%) and D,L-selenomethionine (>99%) were obtained from Fluka (Buchs, St Gallen, Switzerland). D,L-Selenocystine was purchased from Sigma Aldrich (Karlsruhe, Germany). The selenosugars methyl-2-acetamido-2-deoxy-1-seleno-β-D-galactopyranoside (selenosugar 1), methyl-2-acetamido-2-deoxy-1-seleno-β-D-glucopyranoside (selenosugar 2) and methyl-2-amino-2-deoxy-1-seleno-β-D-galactopyranoside (selenosugar 3) were synthesized in-house as previously reported.28,29 Sulfur and selenium standards were prepared by dilution of aqueous stock standard solutions of the respective sulfur or selenium compounds with water. To prepare stock solutions of selenocystine and cystine, total dissolution was ensured by adding 5 (selenocystine) or 10 (cystine) drops of a HCl solution (37% HCl diluted 1 + 1 with water) to the compounds before adding water.Basic cell culture medium (minimum essential medium (MEM) (Eagle)) and non-essential amino acids (NEAs) were from Biochrom (Berlin, Germany). Penicillin/streptomycin (PS) and trypsin were obtained from Sigma Aldrich (Steinheim, Germany) and fetal calf serum (FCS) was purchased from PAA Laboratories (Cölbe, Germany). Cell culture medium used for cell experiments consisted of 440 mL basic cell culture medium, 50 mL FCS, 10 mL PS and 5 mL NEA. The mobile phase (20 mM aqueous ammonium formate, pH 9.0) for the HPLC separation of sulfur and selenium species was prepared by weighing in the appropriate amount of ammonium formate, dissolving it in water, and adjusting the pH to 9.0 by addition of ammonia solution.
Samples
Human hepatocyte carcinoma cells (HepG2, liver cells) were obtained from the European Collection of Cell Cultures (ECACC; number 85011430, Salisbury, UK). As described earlier30 HepG2 cell culturing was performed in plastic culture dishes as monolayers in supplemented MEM at 37 °C, 5% CO2 and 100% atmospheric humidity. Every two to three days, cells were split using 0.25% trypsin. For the preparation of cell pellets 25![[thin space (1/6-em)]](https://www.rsc.org/images/entities/char_2009.gif) 000 cells per cm2 were seeded. After three days of proliferation, cells were incubated with 1 mM ergothioneine for 1 h. Control cells remained untreated. Subsequently, cell culture medium was removed, and cells were washed with 37 °C warm phosphate-buffered saline (PBS) and detached with trypsin at 37 °C. Thereafter, cells were suspended in ice-cold PBS and the cell volume and cell number were measured using an automated cell counting system (Casy TTCs, Roche Innovatis AG, Bielefeld, Germany). Following centrifugation (5 min, 4 °C, 300 × g), the supernatant was removed and the cell pellet was carefully washed with ice-cold PBS. The final cell pellet was obtained by one more centrifugation (5 min, 4 °C, 600 × g) and removal of the supernatant. The cell pellets and cell culture medium either native (control medium and pellets) or incubated with 1 mM (32 mg S per L) ergothioneine for one hour (ergothioneine-treated medium and pellets) were prepared at the University of Potsdam, Germany, and sent to Graz, Austria, on dry ice, where they were immediately stored at −80 °C until analysis.
000 cells per cm2 were seeded. After three days of proliferation, cells were incubated with 1 mM ergothioneine for 1 h. Control cells remained untreated. Subsequently, cell culture medium was removed, and cells were washed with 37 °C warm phosphate-buffered saline (PBS) and detached with trypsin at 37 °C. Thereafter, cells were suspended in ice-cold PBS and the cell volume and cell number were measured using an automated cell counting system (Casy TTCs, Roche Innovatis AG, Bielefeld, Germany). Following centrifugation (5 min, 4 °C, 300 × g), the supernatant was removed and the cell pellet was carefully washed with ice-cold PBS. The final cell pellet was obtained by one more centrifugation (5 min, 4 °C, 600 × g) and removal of the supernatant. The cell pellets and cell culture medium either native (control medium and pellets) or incubated with 1 mM (32 mg S per L) ergothioneine for one hour (ergothioneine-treated medium and pellets) were prepared at the University of Potsdam, Germany, and sent to Graz, Austria, on dry ice, where they were immediately stored at −80 °C until analysis.
Muscle from fresh tuna (Thunnus albacares from the Indian Ocean, stored on ice) for the preparation of a fraction naturally containing 2-selenyl-Nα,Nα,Nα-trimethyl-L-histidine (selenoneine) was purchased from a local fish supplier. Oyster mushrooms were obtained from two local commercial suppliers (referred to as “mushroom sample 1” and “mushroom sample 2”) and stored in the refrigerator at 4 °C before sample preparation.
Sample preparation
Samples stored at −80 °C were thawed and subjected to further sample preparation procedures.380 × g (D3024R High Speed Refrigerated Micro-Centrifuge, SCILOGEX, LLC., Rocky Hill, Connecticut, USA). After centrifugation, the supernatant was filtered through a syringe filter (0.2 μm nylon membrane).
Determination of sulfur and selenium species by HPLC/ICP-QQQ-MS
| Typical ICP-QQQ-MS settings | |||
| RF power | 1550 W | Spray chamber temperature | 2 °C |
| RF matching | 1.88 V | Extract 1 | 0.0 V |
| Sampling depth | 8.0 mm | Extract 2 | −150.0 V |
| Carrier gas flow | 0.97 L min−1 | Omega bias | −90 V |
| Makeup gas flow | 0.13 L min−1 | Omega lens | 8.0 V |
| Q1 bias | −3.0 V | Q1 entrance | −6.1 V |
| Q1 prefilter bias | −22.0 V | Q1 exit | 0.0 V |
| Q1 postfilter bias | −20.0 V | Cell focus | 0.0 V |
| Cell gas (O2 in Ar) | 30% | Cell entrance | −50 V |
| Octopole bias | −5.0 V | Cell exit | −60 V |
| Octopole RF | 191 V | Deflect | 4.0 V |
| Energy discriminator | −7.0 V | Plate bias | −60 V |
|
|||
| HPLC settings for isocratic elution | |||
| Mobile phase | 20 mM ammonium formate, pH 9.0 | Flow rate | 0.7 mL min−1 |
| Injection volume | 10 μL | Column temperature | 30 °C |
|
|||
| HPLC settings for gradient elution | |||
| Eluent A | 20 mM ammonium formate, pH 9.0 | Eluent B | Methanol |
| Gradient | Time [min] | Eluent B [%] | Flow rate [mL min−1] |
|---|---|---|---|
| 0–9 | 0 | 0.7 | |
| 9–11 | 0–80 | 0.5 | |
| 11–18 | 80 | 0.5 | |
| 18–20 | 80–0 | 0.5 | |
| 20–24 | 0 | 0.5 | |
| 24–25 | 0 | 0.5–0.7 | |
| 25–31 | 0 | 0.7 | |
| 6-Port-valve | 0–9 min | Position 1; effluent from column to ICP | |
| 9–29 min | Position 2; effluent from column to waste | ||
| 29–31 min | Position 1; effluent from column to ICP |
Analytical figures of merit
Cell culture medium was spiked with ergothioneine either before or after syringe filtration. Spiking concentrations ranged between 2.5 μg S per L and 300 μg S per L ergothioneine for control and ergothioneine-treated cell culture medium.
HPLC conditions were the same as for HPLC/ICP-QQQ-MS. MS was performed in the positive mode and source settings were: gas temperature 465 °C, flow rates 58 (sheath) and 17 (aux) instrument units, spray voltage 3500 V and capillary temperature 285 °C. The full scan range was m/z 200–600 and a resolution of 70000 (full width half-maximum, FWHM), an automatic gain control (AGC) target of 3 × 10⁶, and a maximum injection time (IT) of 200 ms were used.
MS/MS for the precursor ion at m/z 230 was performed after recording of full scans. A collision energy of 20-30-35 (stepped) instrument units was used. MS/MS settings were: maximum injection time 50 ms, AGC target 1 × 10⁵, resolution 17500 FWHM. An isolation window of 4 (offset 1) Thomson (mass/charge) was selected.
Results and discussion
Determination of sulfur and selenium species by HPLC/ICP-QQQ-MS
Element-selective detection by ICPMS is sensitive and robust towards matrix effects, which is advantageous with respect to quantification, and additionally offers the possibility of obtaining a complete picture of the speciation of an element or even several elements in one run. The triple quadrupole system enables the detection of sulfur despite spectral interferences on the main sulfur isotopes (m/z 32 and m/z 34) by using oxygen as the reaction gas and operating the instrument in mass shift mode. Oxygen readily reacts with sulfur, shifting the analyte ion from S+ to SO+. Because selenium behaves similarly forming the SeO+ ion, the mass shift mode using oxygen as a reaction gas is applicable to the simultaneous determination of selenium and sulfur species. With respect to the determination of ergothioneine, we expected ICP-QQQ-MS detection to be more selective and sensitive than UV detection and more robust towards matrix effects than molecular MS detection.We performed preliminary tests investigating various separation mechanisms (reversed-phase, cation-exchange, hydrophilic interaction liquid chromatography) to separate several biologically relevant sulfur and selenium species. The various functional groups in the target molecule ergothioneine and its selenium analogue selenoneine can be deprotonated or protonated depending on the pH of the mobile phase, but at pH 9.0 both have a net charge of zero making them amenable to reversed-phase chromatography. Thus, the Gemini C6-Phenyl column, chosen because of its stability over the wide pH range (pH 1 to 12), in combination with a mobile phase of 20 mM ammonium formate at pH 9.0 was capable of separating ergothioneine from the other biologically relevant sulfur-containing species tested (Fig. 1). The same chromatographic conditions separated selenoneine from all of the tested selenium species (Fig. 2).
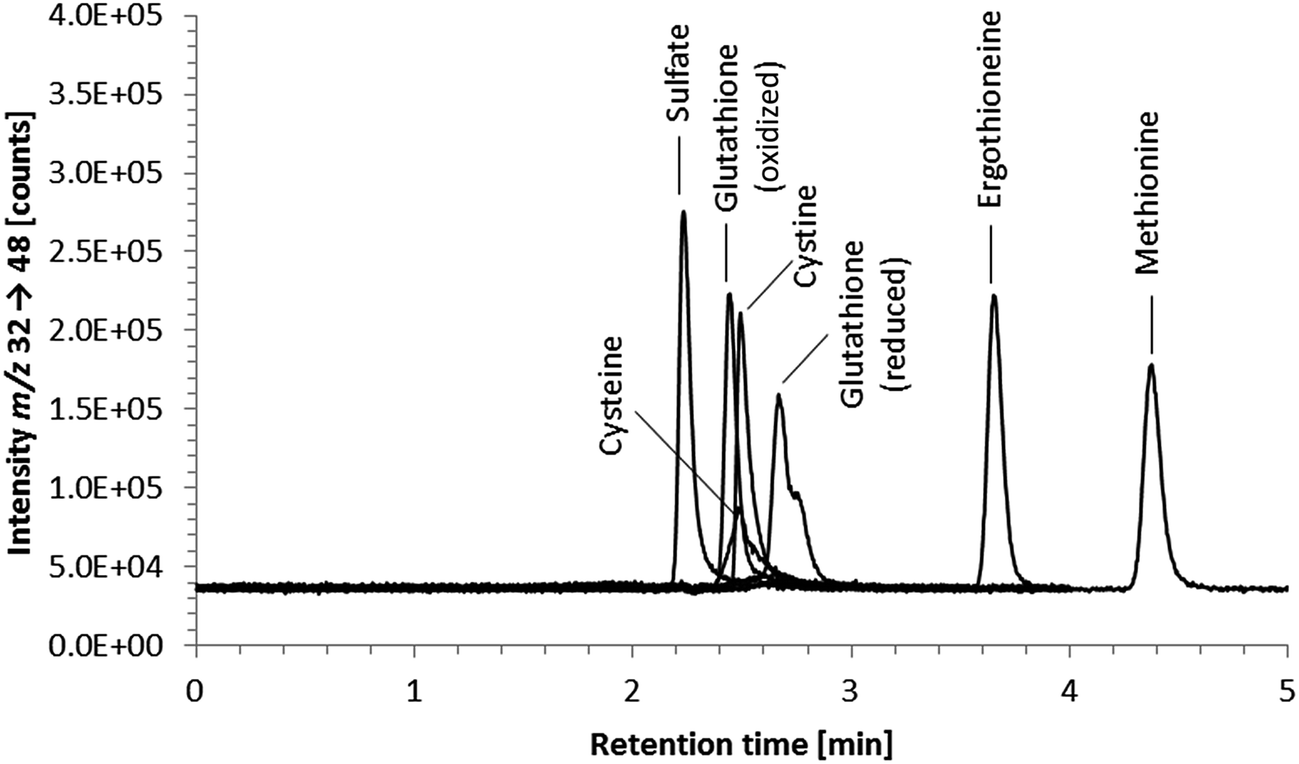 | ||
| Fig. 1 HPLC/ICP-QQQ-MS chromatograms of 100 μg S per L standard solutions of various biologically relevant sulfur-containing species; chromatographic conditions as follows: Gemini C6-Phenyl 4.6 × 150 mm; column temperature, 30 °C; injection volume, 10 μL; mobile phase, 20 mM ammonium formate pH 9.0; flow rate, 0.7 mL min−1. | ||
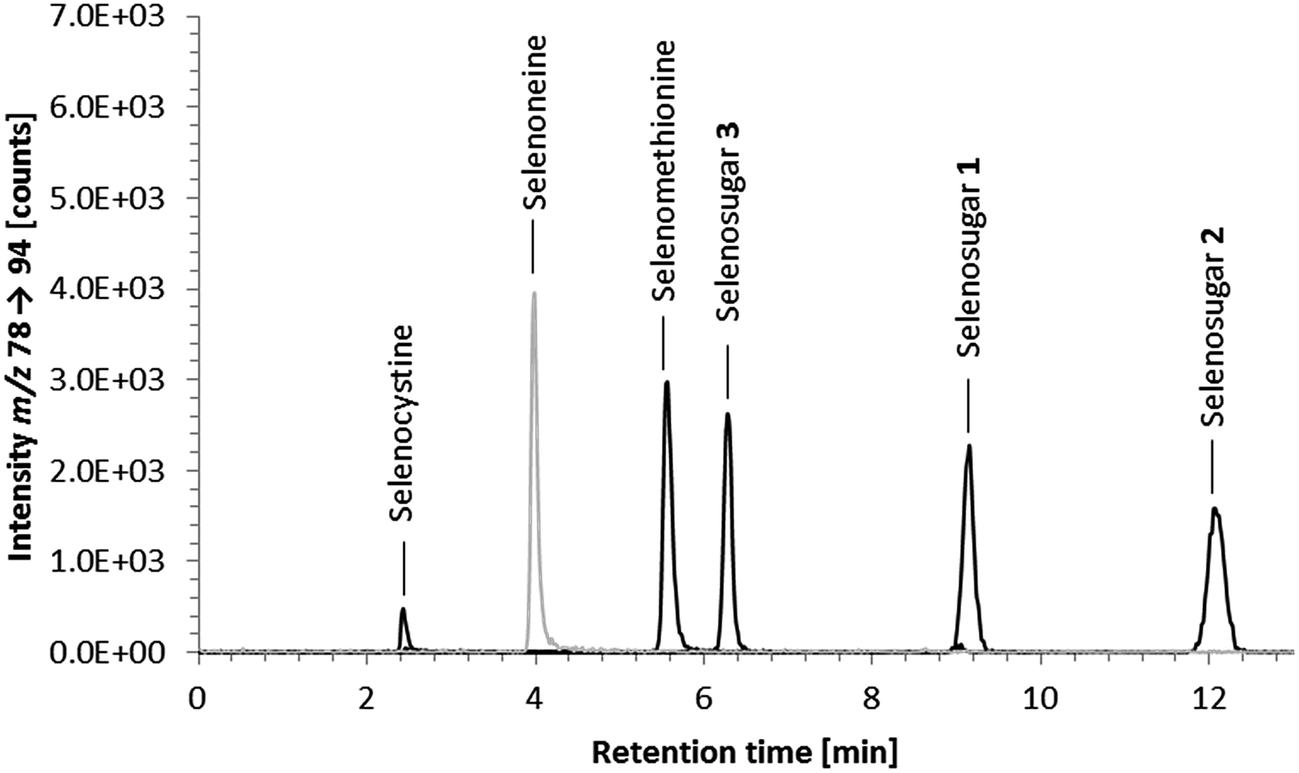 | ||
| Fig. 2 HPLC/ICP-QQQ-MS chromatograms of 20 μg Se per L standard solutions of various biologically relevant selenium-containing species and a fraction from a water extract of tuna muscle containing selenoneine; 20 μg Se per L standard solutions of selenium-containing species (solid black line) and fraction containing selenoneine (solid light grey line); chromatographic conditions as follows: Gemini C6-Phenyl 4.6 × 150 mm; column temperature, 30 °C; injection volume, 10 μL; mobile phase, 20 mM ammonium formate pH 9.0; flow rate, 0.7 mL min−1. | ||
Analysis of cell culture matrices
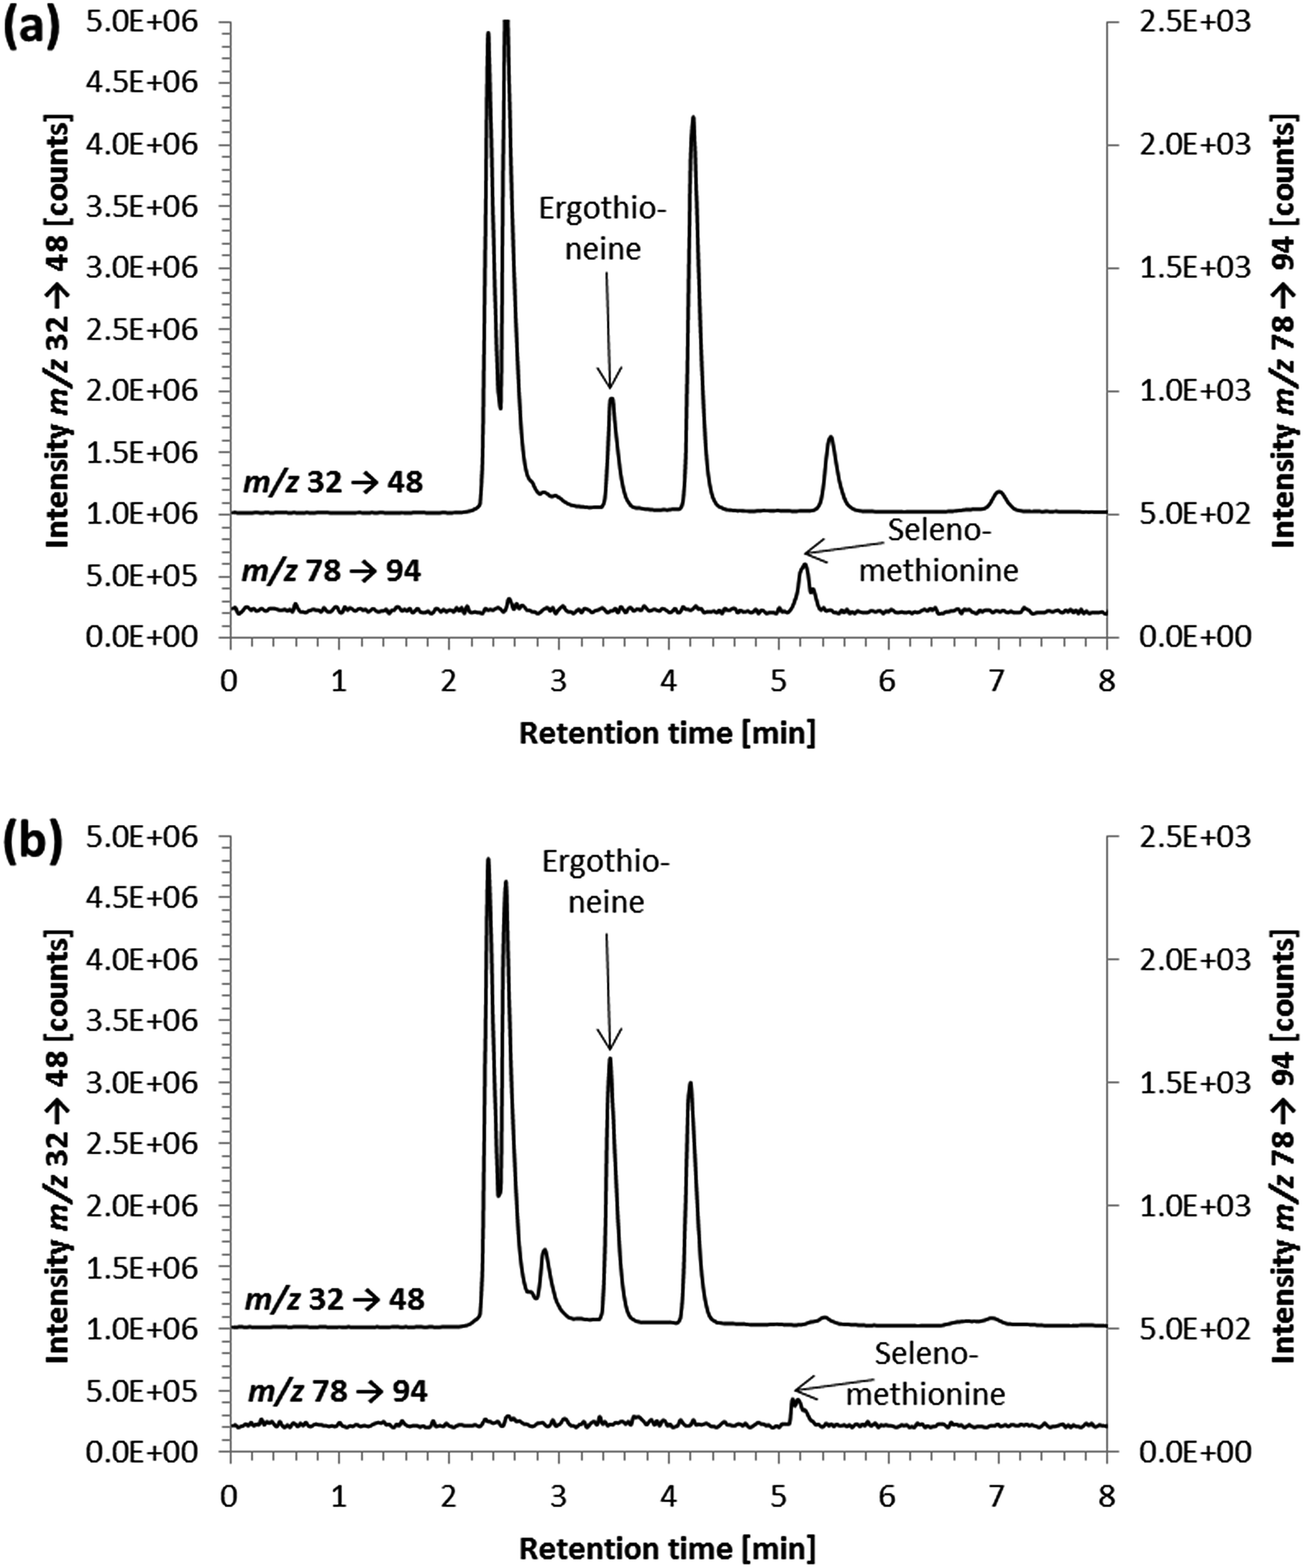
As in vitro studies into the fate and action of ergothioneine are amongst the potential applications for the developed HPLC/ICP-QQQ-MS method, we employed it for the analysis of human hepatocyte carcinoma cells (HepG2) and the corresponding cell culture medium.Several sulfur species were detected in the cell culture medium (Fig. 3a). Peak identification for the two sulfur-containing constituents thiamine and phenol red of the cell culture medium was not attempted due to the lack of available standard compounds. Besides sulfate and methionine contained in the minimum essential medium (Eagle), we observed the presence of a sulfur compound with a similar retention time to the ergothioneine standard (Fig. 3a). This signal was also detected in FCS, when analyzed separately (data not shown). However, due to the results of spiking experiments showing slight differences in the retention times of unspiked and spiked cell culture medium (Fig. 3a), it is doubtful that the control cell culture medium contained ergothioneine. Due to the complex matrix of the cell culture medium and the vast number of sulfur-containing species present in biological samples, this peak is likely to derive from another sulfur-containing species in the medium. As its concentration was low (approximately 10 μg S per L when quantified against ergothioneine) it was negligible for the quantification of ergothioneine in the in vitro experiment discussed later.
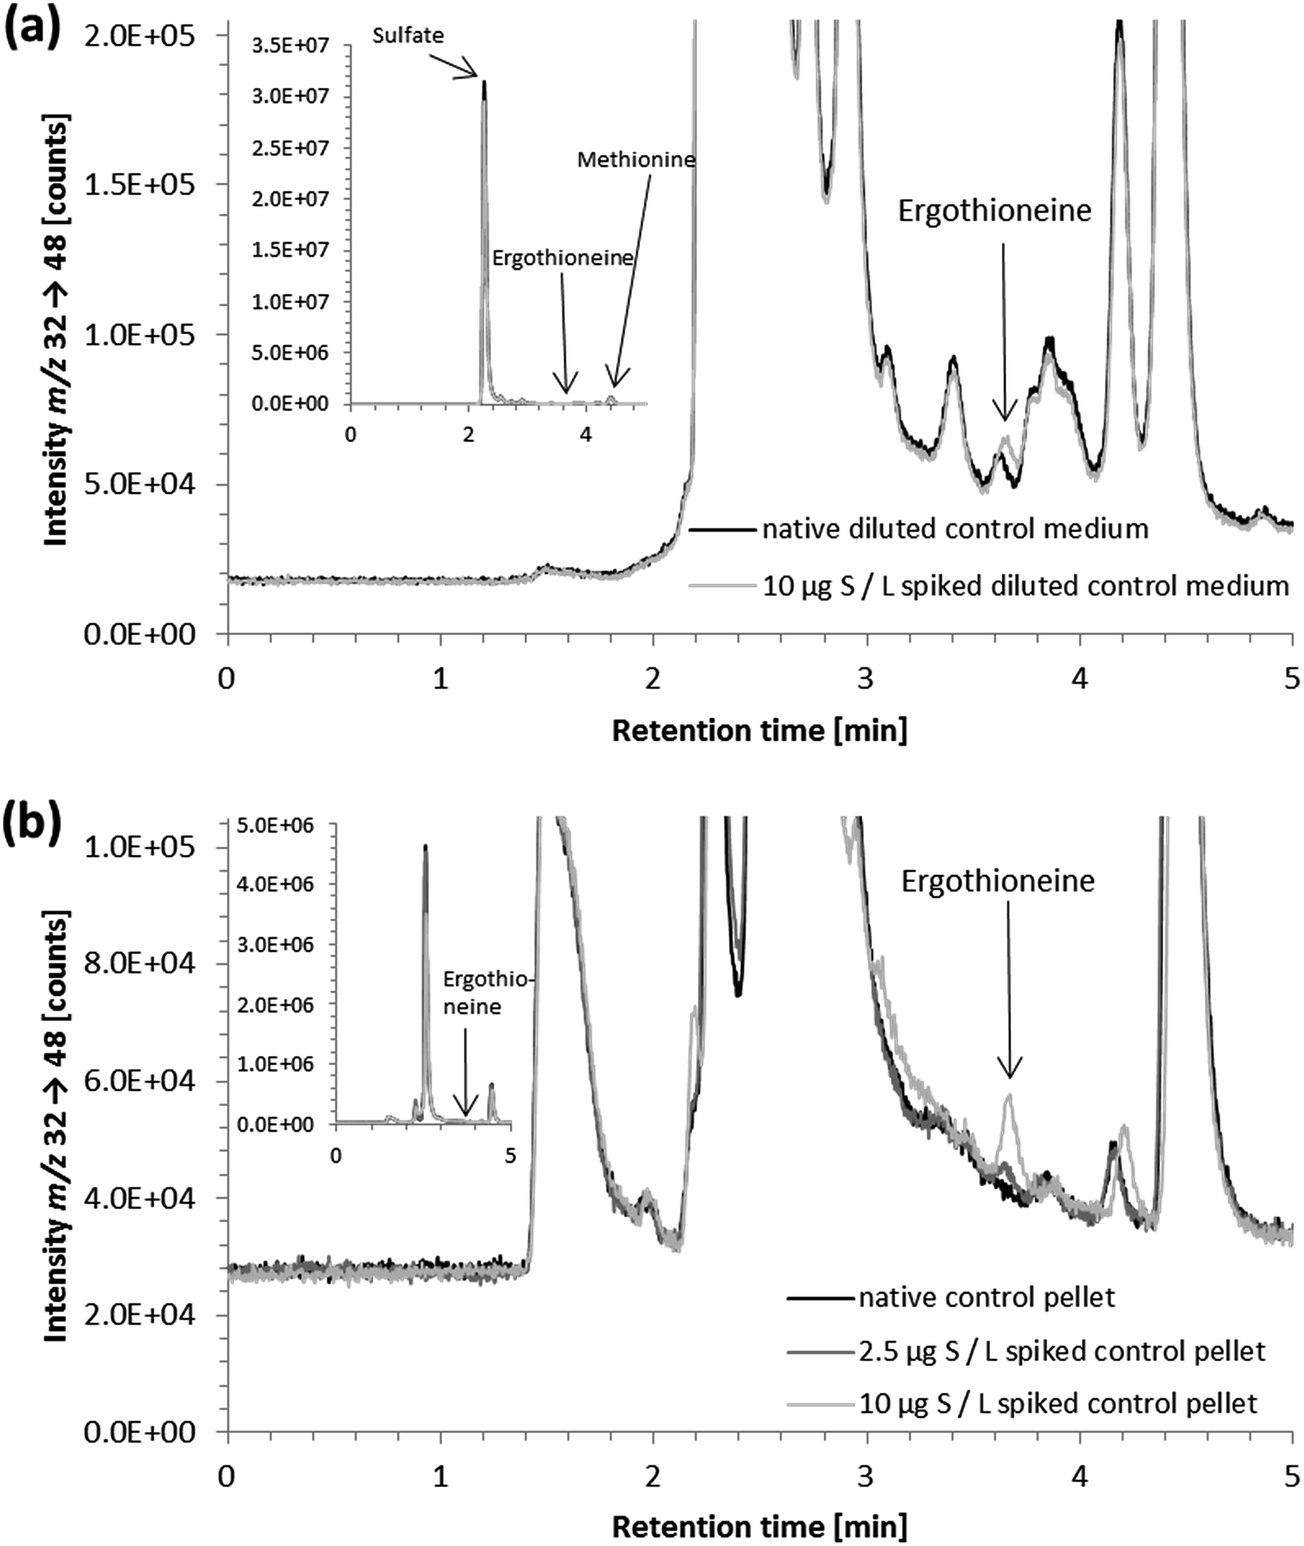 | ||
| Fig. 3 HPLC/ICP-QQQ-MS chromatograms of (a) native and spiked 1 + 1 dilution of control cell culture medium (a retention time shift upon spiking indicated that another sulfur-containing species eluting close to ergothioneine was present in the cell culture medium at a very low concentration) and (b) native and spiked lysate of a control cell pellet (recoveries for control cell pellets spiked with 10 or 2.5 μg S per L ergothioneine: 96 ± 1% and 88 ± 2% (n = 3 in both cases), respectively); insets showing the whole chromatograms; native sample (solid black line), 2.5 μg S per L ergothioneine spiked sample (solid dark grey line) and 10 μg S per L ergothioneine spiked sample (solid light gray line); chromatographic conditions as follows: Gemini C6-Phenyl 4.6 × 150 mm; column temperature, 30 °C; injection volume, 10 μL; mobile phase, eluent A: 20 mM ammonium formate pH 9.0 and eluent B: methanol (gradient elution using the 6-port-valve in the case of (a), isocratic elution with eluent A in the case of (b)); flow rate, (a) 0.5–0.7 mL min−1 and (b) 0.7 mL min−1. | ||
Furthermore, strongly retained sulfur species with retention times up to two hours were detected. They were shown to result from the penicillin/streptomycin mixture that was an additive to the cell culture medium; their presence in the samples necessitated exceedingly long chromatographic runtimes. Neither the addition of acetonitrile (for protein precipitation) nor cut-off filtration adapted from previous procedures34–36 resulted in the removal of these species (data not shown). To overcome problems resulting from the strongly retained sulfur species, we then tried a different approach based on a method reported for the reversed-phase separation of selenium species applying a methanol gradient.32 Thus, a 6-port-valve was introduced to the instrumental setup directing the column effluent either to the ICP-QQQ-MS or to the waste. The column effluent was directed to the ICP-QQQ-MS for the first 9 minutes of analysis, before the methanol gradient was started and the effluent from the column was directed to the waste to prevent the plasma from extinguishing due to the high amount of organic solvent. To avoid a high backpressure on the chromatographic column during gradient elution, the flow rate was reduced and the time for re-equilibration at the lower flow rate was optimized.
We then tested the applicability of the gradient elution method for determining ergothioneine in cell culture medium with the penicillin/streptomycin mixture containing the strongly retained sulfur species. No peaks were detected in the chromatograms obtained after gradient elution, ensuring the removal of the strongly retained sulfur-containing species with the methanol gradient from the column (Fig. 4). Both the peak area and the retention time of the ergothioneine peak were unchanged, compared to the isocratic elution method. This approach is also expected to be applicable to other matrices containing strongly retained sulfur species. Thus, with the developed method using gradient elution and the 6-port-valve, it was possible to reduce the time for analysis of cell culture medium from 120 to 31 minutes per sample. This analysis time is still substantially longer than that of LC/MSMS methods designed for the determination of ergothioneine in food,9,11 but comparable to that of a method using UV detection.19
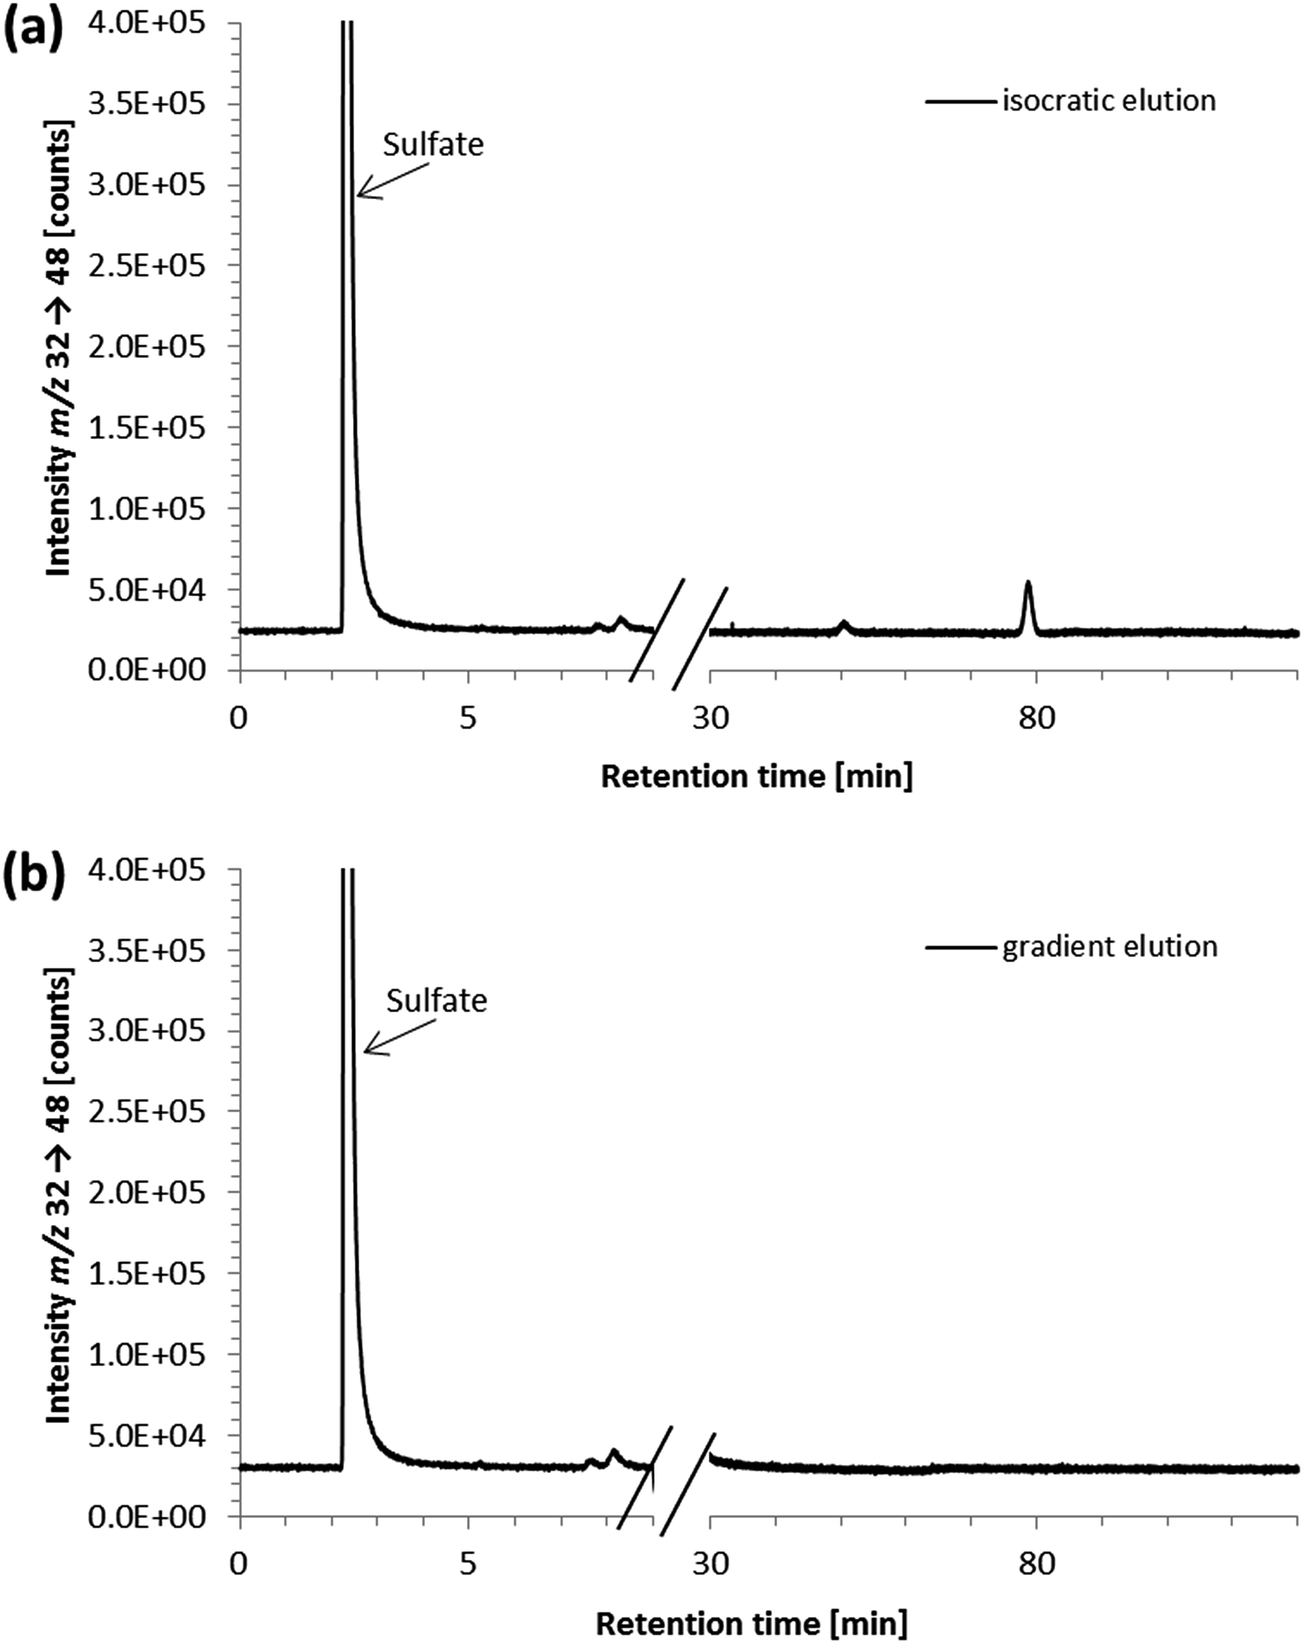 | ||
| Fig. 4 HPLC/ICP-QQQ-MS chromatograms of a 1 + 99 dilution of a penicillin/streptomycin (PS) cell culture additive subjected to HPLC separation with (a) isocratic elution or (b) gradient elution; the sulfate peak derived from streptomycin, present as streptomycin sulfate in the PS additive; to prove the removal of strongly retained sulfur species after application of the methanol gradient, signals of a penicillin/streptomycin cell culture additive were monitored for 1.5 hours after re-establishing starting conditions (100% 20 mM ammonium formate, pH 9.0 with a flow rate of 0.7 mL min−1); chromatographic conditions as follows: Gemini C6-Phenyl 4.6 × 150 mm; column temperature, 30 °C; injection volume, 10 μL; mobile phase, eluent A: 20 mM ammonium formate pH 9.0 and eluent B: methanol (isocratic elution with eluent A in the case of (a), gradient elution using the 6-port-valve in the case of (b)); flow rate, (a) 0.7 mL min−1 and (b) 0.5–0.7 mL min−1. | ||
In lysates of the control cell pellets, HPLC/ICP-QQQ-MS showed various sulfur-containing species between 1.3 and 5.0 minutes (Fig. 3b). Small peaks eluting after 5.0 minutes were also detected, nevertheless, chromatographic separation of sulfur species in lysates of cell pellets using isocratic elution was completed within 23 minutes obviating the need for gradient elution for the analysis of cell pellets. In contrast to the cell culture medium, no peaks were detected near the retention time of ergothioneine in the control cell pellets. Identification of sulfur-containing species other than ergothioneine in cell pellets was not attempted.
Analytical figures of merit
Even with an elevated baseline in the region of ergothioneine elution, due to the sulfur-rich matrix of the cell pellet sample, the HPLC/ICP-QQQ-MS method was able to detect 2.5 μg S per L ergothioneine spiked to the lysate of a control cell pellet with a recovery of 88 ± 2% (n = 3); the LOD and LOQ, estimated according to Eurachem,33 were 0.6 μg S per L and 2.3 μg S per L, respectively. Matrix influence was more severe in cell culture medium because of the presence of the sulfur compound with a similar retention time to the ergothioneine standard as discussed before.
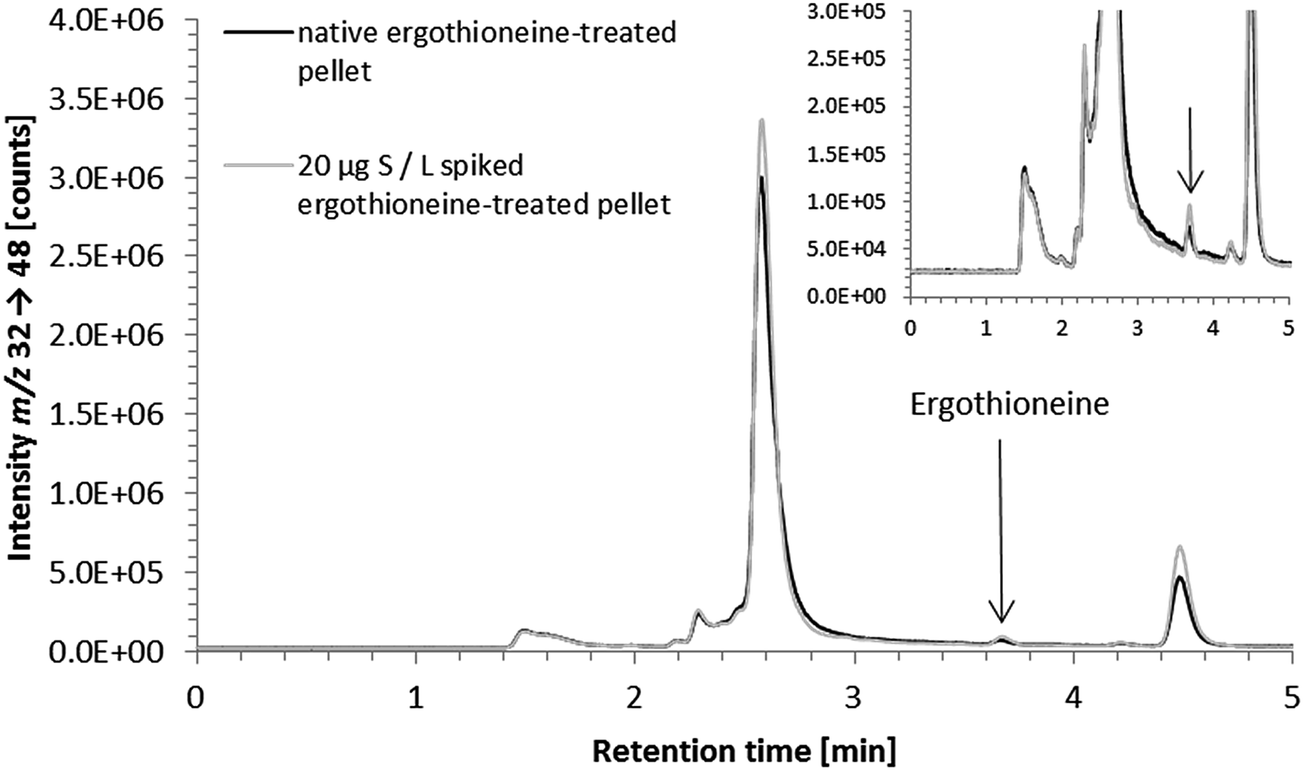 | ||
| Fig. 5 HPLC/ICP-QQQ-MS chromatograms of a native and a spiked lysate of an ergothioneine-treated cell pellet; inset showing a zoom into the area of ergothioneine elution with the arrow indicating the ergothioneine peak; native ergothioneine-treated cell pellet (solid black line) and 20 μg S per L ergothioneine spiked ergothioneine-treated cell pellet (solid light gray line); chromatographic conditions as follows: Gemini C6-Phenyl 4.6 × 150 mm; column temperature, 30 °C; injection volume, 10 μL; mobile phase, 20 mM ammonium formate pH 9.0; flow rate, 0.7 mL min−1. | ||
Sample preparation of cell culture medium (syringe filtration) was demonstrated not to compromise the quantitative determination of ergothioneine (recovery of 300 μg S per L ergothioneine spiked to control cell culture medium: 96 ± 9%, 3 dilutions of 3 spiked control cell culture media; for chromatograms of spiked ergothioneine-treated cell culture medium see ESI Fig. S-2†).
Applications
| Ergothioneine-treated cell pellets | |||
|---|---|---|---|
| a n = 3 injections. b n = 3 dilutions. | |||
| Pellet 1 | Pellet 2 | Pellet 3 | |
| ng S in the form of ergothioneine in the pelleta | 11.8 ± 0.2 | 15.4 ± 0.2 | 15.0 ± 0.3 |
| Ergothioneine concentrationa [mg S per L cell volume] | 0.78 ± 0.06 | 1.13 ± 0.07 | 1.08 ± 0.11 |
| Percentage of added ergothioneinea [%] | 2.4 ± 0.2 | 3.5 ± 0.2 | 3.4 ± 0.3 |
No cytotoxic effects were observed, when cell numbers of control cells and cells treated with 1 mM ergothioneine were compared, probably due to the low uptake by the cells. This low absorption of ergothioneine was not unexpected because there was no detectable gene expression of the ergothioneine specific transporter OCTN1 in HepG2 cells.37 In accord with the low uptake of ergothioneine by the cells, the concentrations of ergothioneine in the incubated cell culture media remained high – the measured concentration of 29.2 ± 2.5 mg S per L, represented around 91 ± 8% of the added ergothioneine (Table 2).
 | ||
| Fig. 6 HPLC/ICP-QQQ-MS chromatograms of water extracts of (a) oyster mushroom sample 1 and (b) oyster mushroom sample 2; m/z 32 → 48 y-axis offset of 1 × 10⁶ counts and m/z 78 → 94 y-axis offset of 1 × 10² counts; chromatographic conditions as follows: Gemini C6-Phenyl 4.6 × 150 mm; column temperature, 30 °C; injection volume, 10 μL; mobile phase, 20 mM ammonium formate 1% methanol pH 9.0; flow rate, 0.7 mL min−1. | ||
Conclusions
A HPLC/ICP-QQQ-MS method was developed for the quantitative determination of the antioxidant ergothioneine in biological samples. It was successfully applied to quantify this health-relevant sulfur species in complex matrices such as cell pellets and culture medium and aqueous mushroom extracts. With the method, the fate of ergothioneine in in vitro experiments can be investigated to further elucidate its biological role. Furthermore, the method is expected to offer a broad field of future applications like the monitoring of ergothioneine in food or body fluids. We also show that the method has the potential to simultaneously determine sulfur and selenium species thereby yielding a picture of the speciation of both elements in one run, and, hence, could be used in studies investigating similarities and differences between these two elements and their species in biological systems with likely significant applications in human health research in the future.Author contributions
The manuscript was written with contributions from all authors. All authors have given approval to the final version of the manuscript.Conflicts of interest
The authors declare that they have no competing interests.Acknowledgements
We thank the Austrian Science Fund (FWF, project number I 2262-N28) and the “Deutsche Forschungsgemeinschaft” (DFG, project grant number SCHW 903/9-1) for funding this research. We also thank the “NutriAct – Competence Cluster Nutrition Research Berlin-Potsdam” funded by the Federal Ministry of Education and Research (project number 01EA1408B) and the “Fonds der Chemischen Industrie” for financial support. We thank Kenneth Jensen and the NAWI Graz Central Lab – Metabolomics for high resolution mass spectra.References
- M. C. Tanret, C. R. Hebd. Seances Acad. Sci., 1909, 149, 222–224 Search PubMed.
- D. S. Genghof and O. van Damme, J. Bacteriol., 1964, 87, 852–862 CAS.
- D. S. Genghof, J. Bacteriol., 1970, 103, 475–478 CAS.
- C. Pfeiffer, T. Bauer, B. Surek, E. Schömig and D. Gründemann, Food Chem., 2011, 129, 1766–1769 CrossRef CAS.
- G. W. Jones, S. Doyle and D. A. Fitzpatrick, Gene, 2014, 549, 161–170 CrossRef CAS PubMed.
- D. Gründemann, Prev. Med., 2012, 54, S71 CrossRef PubMed.
- C. E. Hand and J. F. Honek, J. Nat. Prod., 2005, 68, 293–308 CrossRef CAS PubMed.
- I. K. Cheah and B. Halliwell, Biochim. Biophys. Acta, Mol. Basis Dis., 2012, 1822, 784–793 CrossRef CAS PubMed.
- J. Ey, E. Schömig and D. Taubert, J. Agric. Food Chem., 2007, 55, 6466–6474 CrossRef CAS PubMed.
- P. Tepwong, A. Giri, F. Sasaki, R. Fukui and T. Ohshima, Food Chem., 2012, 131, 247–258 CrossRef CAS.
- Y. Sapozhnikova, W. C. Byrdwell, A. Lobato and B. Romig, J. Agric. Food Chem., 2014, 62, 3034–3042 CrossRef CAS PubMed.
- L.-Z. Wang, W.-L. Thuya, D. S.-L. Toh, M. G.-L. Lie, J.-Y. A. Lau, L.-R. Kong, S.-C. Wan, K.-N. Chua, E. J.-D. Lee and B.-C. Goh, J. Mass Spectrom., 2013, 48, 406–412 CrossRef CAS PubMed.
- N. Dubost, B. Ou and R. Beelman, Food Chem., 2007, 105, 727–735 CrossRef CAS.
- T. H. Nguyen, A. Giri and T. Ohshima, Food Chem., 2012, 133, 585–591 CrossRef CAS PubMed.
- T. H. Nguyen, R. Nagasaka and T. Ohshima, Int. J. Food Sci. Technol., 2012, 47, 1193–1205 CrossRef CAS.
- S.-Y. Chen, K.-J. Ho, Y.-J. Hsieh, L.-T. Wang and J.-L. Mau, LWT--Food Sci. Technol., 2012, 47, 274–278 CrossRef CAS.
- S. Sotgia, A. Zinellu, G. Pintus, G. A. Pinna, L. Deiana and C. Carru, J. Sep. Sci., 2013, 36, 1002–1006 CrossRef CAS PubMed.
- A. Z. Woldegiorgis, D. Abate, G. D. Haki and G. R. Ziegler, Food Chem., 2014, 157, 30–36 CrossRef CAS PubMed.
- Q. Liu, W. Zhang, H. Wang, Y. Li, W. Liu, Q. Wang, D. Liu, N. Chen and W. Jiang, J. Chromatogr. Sci., 2016, 54, 934–938 CAS.
- D. Pröfrock and A. Prange, Appl. Spectrosc., 2012, 66, 843–868 CrossRef PubMed.
- J. Giner Martínez-Sierra, O. Galilea San Blas, J. M. Marchante Gayón and J. I. García Alonso, Spectrochim. Acta, Part B, 2015, 108, 35–52 CrossRef.
- L. Balcaen, E. Bolea-Fernandez, M. Resano and F. Vanhaecke, Anal. Chim. Acta, 2015, 894, 7–19 CrossRef CAS PubMed.
- S. D. Fernández, N. Sugishama, J. R. Encinar and A. Sanz-Medel, Anal. Chem., 2012, 84, 5851–5857 CrossRef PubMed.
- J. Gong, M. J. Solivio, E. J. Merino, J. A. Caruso and J. A. Landero-Figueroa, Anal. Bioanal. Chem., 2015, 407, 2433–2437 CrossRef CAS PubMed.
- G. Hermann, L. H. Møller, B. Gammelgaard, J. Hohlweg, D. Mattanovich, S. Hann and G. Koellensperger, J. Anal. At. Spectrom., 2016, 31, 1830–1835 RSC.
- L. H. Møller, A. Macherius, T. H. Hansen, H. M. Nielsen, C. Cornett, J. Østergaard, S. Stürup and B. Gammelgaard, J. Anal. At. Spectrom., 2016, 31, 1877–1884 RSC.
- F. Calderón-Celis, S. Diez-Fernández, J. M. Costa-Fernández, J. R. Encinar, J. J. Calvete and A. Sanz-Medel, Anal. Chem., 2016, 88, 9699–9706 CrossRef PubMed.
- P. Traar, F. Belaj and K. A. Francesconi, Aust. J. Chem., 2004, 57, 1051–1053 CrossRef CAS.
- D. Kuehnelt, N. Kienzl, P. Traar, N. H. Le, K. A. Francesconi and T. Ochi, Anal. Bioanal. Chem., 2005, 383, 235–246 CrossRef CAS PubMed.
- T. A. Marschall, J. Bornhorst, D. Kuehnelt and T. Schwerdtle, Mol. Nutr. Food Res., 2016, 60, 2622–2632 CAS.
- N. Kroepfl, K. B. Jensen, K. A. Francesconi and D. Kuehnelt, Anal. Bioanal. Chem., 2015, 407, 7713–7719 CrossRef CAS PubMed.
- S. Kokarnig, N. Kroepfl, D. Kuehnelt and K. A. Francesconi, Anal. Methods, 2014, 6, 1603–1607 RSC.
- Eurachem Guide. The Fitness for Purpose of Analytical Methods – A Laboratory Guide to Method Validation and Related Topics, ed. B. Magnusson and U. Örnemark, 2nd edn, 2014 Search PubMed.
- R. Raml, G. Raber, A. Rumpler, T. Bauernhofer, W. Goessler and K. A. Francesconi, Chem. Res. Toxicol., 2009, 22, 1534–1540 CrossRef CAS PubMed.
- S. Kokarnig, D. Kuehnelt, M. Stiboller, U. Hartleb and K. A. Francesconi, Anal. Bioanal. Chem., 2011, 400, 2323–2327 CrossRef CAS PubMed.
- K. Flouda, J. M. Dersch, C. Gabel-Jensen, S. Stürup, S. Misra, M. Björnstedt and B. Gammelgaard, Anal. Bioanal. Chem., 2016, 408, 2293–2301 CrossRef CAS PubMed.
- G. Ahlin, C. Hilgendorf, J. Karlsson, C. A.-K. Szigyarto, M. Uhlen and P. Artursson, Drug Metab. Dispos., 2009, 37, 2275–2283 CrossRef CAS PubMed.
- V. Gergely, K. M. Kubachka, S. Mounicou, P. Fodor and J. A. Caruso, J. Chromatogr. A, 2006, 1101, 94–102 CrossRef CAS PubMed.
- V. Díaz Huerta, A. Sanz-Medel and M. L. Fernández Sánchez, Anal. Bioanal. Chem., 2006, 384, 902–907 CrossRef PubMed.
Footnote |
| † Electronic supplementary information (ESI) available: Examples of external calibration plots for the quantitative determination of ergothioneine, HPLC/ICP-QQQ-MS chromatograms of native and spiked 1 + 199 dilutions of an ergothioneine-treated cell culture medium and high resolution mass spectra of an aqueous ergothioneine standard solution, an ergothioneine-treated cell pellet and a water extract of oyster mushrooms. See DOI: 10.1039/c7ja00030h |
| This journal is © The Royal Society of Chemistry 2017 |