 Open Access Article
Creative Commons Attribution 3.0 Unported Licence
An optimised synthesis of high performance radiation-grafted anion-exchange membranes†
Lianqin
Wang
*a,
Emanuele
Magliocca
ab,
Emma L.
Cunningham
a,
William E.
Mustain
ac,
Simon D.
Poynton
a,
Ricardo
Escudero-Cid
ad,
Mohamed M.
Nasef
ae,
Julia
Ponce-González
 a,
Rachida
Bance-Souahli
a,
Robert C. T.
Slade
a,
Daniel K.
Whelligan
a and
John R.
Varcoe
a
a,
Rachida
Bance-Souahli
a,
Robert C. T.
Slade
a,
Daniel K.
Whelligan
a and
John R.
Varcoe
a
aDepartment of Chemistry, University of Surrey, Guildford GU2 7XH, UK. E-mail: lianqin.wang@surrey.ac.uk
bDipartimento di Chimica, La Sapienza Università di Roma, Roma 00185, Italy
cDepartment of Chemical & Biomolecular Engineering, University of Connecticut, Storrs, USA
dDepartamento de Quimica Fisica Aplicada, Universidad Autonoma de Madrid, Madrid, Spain
eMalaysia–Japan International Institute of Technology (MJIIT), Universiti Teknologi Malaysia (UTM), International Campus, Jalan, Semarak, 54100 Kuala Lumpur, Malaysia
First published on 23rd November 2016
Abstract
High performance benzyltrimethylammonium-type alkaline anion-exchange membranes (AEM), for application in electrochemical devices such as anion-exchange membrane fuel cells (AEMFC), were prepared by the radiation grafting (RG) of vinylbenzyl chloride (VBC) onto 25 μm thick poly(ethylene-co-tetrafluoroethylene) (ETFE) films followed by amination with trimethylamine. Reductions in the electron-beam absorbed dose and amount of expensive, potentially hazardous VBC were achieved by using water as a diluent (reduced to 30–40 kGy absorbed dose and 5 vol% VBC) instead of the prior state-of-the-art method that used organic propan-2-ol diluent (required 70 kGy dose and 20 vol% VBC monomer). Furthermore, the water from the aqueous grafting mixture was easily separated from the residual monomer (after cooling) and was reused for a further grafting reaction: the resulting AEM exhibited an ion-exchange capacity of 2.1 mmol g−1 (cf. 2.1 mmol g−1 for the AEM made using a fresh grafting mixture). The lower irradiation doses resulted in mechanically stronger RG-AEMs compared to the reference RG-AEM synthesised using the prior state-of-the-art method. A further positive off-shoot of the optimisation process was the discovery that using water as a diluent resulted in an enhanced (i.e. more uniform) distribution of VBC grafts as proven by Raman microscopy and corroborated using EDX analysis: this led to enhancement in the Cl− anion-conductivities (up to 68 mS cm−1 at 80 °C for the optimised fully hydrated RG-AEMs vs. 48 mS cm−1 for the prior state-of-the-art RG-AEM reference). A down-selected RG-AEM with an ion-exchange capacity = 2.0 mmol g−1, that was synthesised using the new greener protocol with a 30 kGy electron-beam absorbed dose, led to an exceptional beginning-of-life H2/O2 AEMFC peak power density of 1.16 W cm−2 at 60 °C in a benchmark test using industrial standard Pt-based electrocatalysts and unpressurised gas supplies: this was higher than the 0.91 W cm−1 obtained with the reference RG-AEM (IEC = 1.8 mmol g−1) synthesised using the prior state-of-the-art protocol.
Introduction
Background to the interest in anion-exchange membranes (AEM)
Due to the geopolitics related to fossil fuel supplies and the need to lower CO2 emissions, there has been an extensive investigation into fuel cells over a number of decades. Proton-exchange membrane fuel cells (PEMFC) represent one of the most researched, and well known, energy conversion technologies available today.1–3 Even though commercial PEMFC vehicles are now on the market (e.g. the Toyota Mirai fuel cell car), a large-scale market introduction of PEMFCs continues to face challenges such as durability, the lack of H2 infrastructure, and the continued use of Pt-based electrocatalysts. The catalysts comprise nearly half of the high-volume cost of PEMFCs.5,6The use of alkaline anion-exchange membranes (AEM)7 in anion-exchange membrane fuel cells (AEMFC), which have a high pH in situ environment, holds the promise of the ability to use a wider range of non-Pt-group electrocatalysts compared to PEMFCs.8,9 Furthermore, AEMFCs offer other potential advantages, such as lower membrane cost and cheaper cell components (e.g. thin, easily stamped, metal bipolar plates) due to a less corrosive in situ environment compared with the use of polymeric superacid materials in PEMFCs. As a consequence, the development of AEMs and AEMFCs has become a significant avenue of fuel cell research, particularly in the last 10 years.10
Radiation-grafted (RG) membranes
A useful method for the production of membranes such as ion-exchange membranes, is radiation induced graft polymerisation.11,12 Radiation grafting (RG) is the process by which a precursor material is treated with high energy radiation (such as that from the commercial electron-beam accelerators or 60Co γ-ray facilities used to sterilise baby bottles or medical products in the UK) to produce an activated material that contains either radicals or peroxide groups (without and with the presence of O2, respectively, during the irradiation step): hence the precursor material is turned into a graft initiating material that can then react with vinyl monomers. RG membranes have several points of attractiveness including: the utilisation of pre-formed commercial polymer films (thus no film formation step through solvent casting is required), the ease of control of the degree of monomer grafting via adjustment of a number of reaction parameters, and having no requirements for the use of highly reactive chemical initiators or catalysts (that can leave chemical fragments in the final product). Thus, RG is an especially convenient method for the repeatable synthesis of large batches of functional membranes for fundamental studies, for the wider distribution of samples for evaluation by other teams, and ultimately for use in a variety of applications (ion-exchange, energy conversion etc.). This includes facilitating the comparison of the properties of a range of ion-exchange membranes where they feature comparable ion-exchange capacities (IEC) and the same precursor material but with different ionic moieties (i.e. the only effective variable between different ion-exchange membranes is the ionic head-group).13However, radiation induced grafting usually requires large radiation absorbed doses to obtain high levels of monomer (e.g. styrene) grafting throughout the thicknesses of the polymer films.14 The use of high irradiation doses typically results in a detrimental reduction in the mechanical properties of the synthesised membranes (e.g. undesirable breaking of C–C bonds in the precursor polymer backbone).15 For example, a rule of thumb is that the mechanical properties of poly(ethylene-co-tetrafluoroethylene) (ETFE) films excessively degrade after absorbing radiation doses of more than 30–50 kGy in air.15 Therefore, there is a need for the synthesis of RG ion-exchange membranes with high IECs using lower radiation doses.
Prior state-of-the-art RG-AEMs
RG-based AEMs have been researched by many groups using a variety of strategies involving the RG of vinyl monomers onto fluorinated (FEP),16 partially-fluorinated (e.g. ETFE17 and PVDF18) and non-fluorinated (e.g. LDPE)19,20 films with subsequent amination to yield anion-exchange (anion conducting) materials. Vinylbenzyl chloride (VBC) is an ideal monomer for the preparation of AEMs due to its dual reactive –CH![[double bond, length as m-dash]](https://www.rsc.org/images/entities/char_e001.gif) CH2 and –CH2Cl functional groups. However, VBC is both expensive and hazardous when used in large quantities (e.g. potentially mutagenic and acutely toxic). It is therefore vital to significantly reduce the quantity of VBC monomers used in the grafting step. This has been carried out most widely by the dilution of VBC with organic solvents such as propanol4,21 and toluene.22 Specifically, our group has previously used propan-2-ol diluent to lower the VBC concentration to 20 vol% for grafting onto ETFE film that had been electron-beam irradiated to a high 70 kGy absorbed dose (the prior state-of-the-art “reference” method).4
CH2 and –CH2Cl functional groups. However, VBC is both expensive and hazardous when used in large quantities (e.g. potentially mutagenic and acutely toxic). It is therefore vital to significantly reduce the quantity of VBC monomers used in the grafting step. This has been carried out most widely by the dilution of VBC with organic solvents such as propanol4,21 and toluene.22 Specifically, our group has previously used propan-2-ol diluent to lower the VBC concentration to 20 vol% for grafting onto ETFE film that had been electron-beam irradiated to a high 70 kGy absorbed dose (the prior state-of-the-art “reference” method).4
RG-membranes using water as an alternative solvent in the grafting step
From the perspective of green sustainable chemistry, an organic solvent-free method is desirable. Wada et al.23 found that the water-based, emulsion graft polymerisation of vinyl acetate onto poly(3-hydroxybutyrate) film enhanced the degree of grafting by ca. 100 times higher than when an organic diluent, such as methanol, was used. The study of Mohamed et al.24 suggests that this emulsion graft mechanism is governed by diffusion of monomer micelles to the base polymer material.Aim and objectives of this study
The aim of the study is to optimise the method for synthesising AEMs containing a benchmark cationic head-group chemistry (benzyltrimethylammonium chloride) by pre-irradiation grafting of VBC monomers onto electron-beamed (in air) 25 μm ETFE film. The objectives include: a significant reduction in the concentration of VBCs, elimination of the organic diluent, and minimisation of the absorbed doses (for maximum mechanical stabilities). The successful fulfilment of these objectives and the production of high performance RG-AEMs, with enhanced properties compared to the reference AEM synthesised using the prior state-of-the-art protocol, are reported in this article. In parallel, the power of Raman microscopy through-plane mapping for studying the poly(VBC) graft distributions in RG-AEMs is demonstrated. It should be noted that this paper is not designed to be an exhaustive study of the physicochemical properties of the obtained RG-AEMs: only selected characterisations and tests were used to aid the elucidation of the most optimal synthesis of benchmark RG-AEMs.Experimental
Chemicals and materials
Nowoflon ET ETFE film (25 μm and 50 μm thick,) was supplied by Nowofol Kunststoffprodukte GmbH (Germany). VBC monomer (mixture of 3- and 4-isomers; 500–100 ppm tert-4-butylcatechol and 700–1100 ppm nitromethane inhibitors) was used without removal of the inhibitor and was supplied by Sigma-Aldrich. 1-Octyl-2-pyrrolidone and aqueous trimethylamine solution (TMA, 45 wt%) were also purchased from Sigma-Aldrich. Propan-2-ol and toluene were of reagent grade and supplied by Fisher Scientific (UK). All chemicals were used as received and the ultra-pure water (UPW) used was of resistivity = 18.2 MΩ cm.RG-AEM(Cl−) preparation using 25 μm ETFE
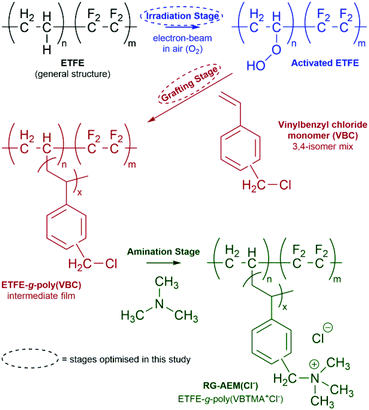
A schematic summary of the preparation of ETFE-based RG-AEMs is shown in Scheme 1. The AEMs were prepared from pre-formed ETFE films using the pre-irradiation (in air) method previously reported10 with modifications to the grafting step as detailed below and summarised in Table 1.| RG-AEM(Cl−) | E-R | E-1 | E-2 | E-3 | E-4 | E-5 | E-6 | E-7 |
|---|---|---|---|---|---|---|---|---|
| a Reference RG-AEM synthesised using the prior state-of-the-art protocol.4 b Diluent system used (vol%) = 100 − 1 vol% (surfactant) − VBC (vol%). c Degree of grafting (calculated using eqn (1)). d Ion-exchange capacity (calculated using eqn (4)). e Gravimetric water uptake (calculated using eqn (2)). f Thickness of fully dehydrated RG-AEM(Cl−1). g Thickness of fully hydrated RG-AEM(Cl−1). h Through plane (thickness) swelling (calculated using eqn (3)). i Fully hydrated Cl− in-plane anion conductivity measured in water using a 4-point probe method (data taken from Fig. 7 and calculated using eqn (5)). | ||||||||
| Electron-beam dose/kGy | 70 | 40 | 40 | 40 | 40 | 40 | 30 | 20 |
| [VBC] (vol%) | 20 | 20 | 5 | 20 | 5 | 5 | 5 | 5 |
Propan-2-ol![[thin space (1/6-em)]](https://www.rsc.org/images/entities/char_2009.gif) : :![[thin space (1/6-em)]](https://www.rsc.org/images/entities/char_2009.gif) H2Ob H2Ob |
1![[thin space (1/6-em)]](https://www.rsc.org/images/entities/char_2009.gif) : :![[thin space (1/6-em)]](https://www.rsc.org/images/entities/char_2009.gif) 0 0 |
1![[thin space (1/6-em)]](https://www.rsc.org/images/entities/char_2009.gif) : :![[thin space (1/6-em)]](https://www.rsc.org/images/entities/char_2009.gif) 0 0 |
1![[thin space (1/6-em)]](https://www.rsc.org/images/entities/char_2009.gif) : :![[thin space (1/6-em)]](https://www.rsc.org/images/entities/char_2009.gif) 0 0 |
1![[thin space (1/6-em)]](https://www.rsc.org/images/entities/char_2009.gif) : :![[thin space (1/6-em)]](https://www.rsc.org/images/entities/char_2009.gif) 1 1 |
1![[thin space (1/6-em)]](https://www.rsc.org/images/entities/char_2009.gif) : :![[thin space (1/6-em)]](https://www.rsc.org/images/entities/char_2009.gif) 1 1 |
0![[thin space (1/6-em)]](https://www.rsc.org/images/entities/char_2009.gif) : :![[thin space (1/6-em)]](https://www.rsc.org/images/entities/char_2009.gif) 1 1 |
0![[thin space (1/6-em)]](https://www.rsc.org/images/entities/char_2009.gif) : :![[thin space (1/6-em)]](https://www.rsc.org/images/entities/char_2009.gif) 1 1 |
0![[thin space (1/6-em)]](https://www.rsc.org/images/entities/char_2009.gif) : :![[thin space (1/6-em)]](https://www.rsc.org/images/entities/char_2009.gif) 1 1 |
| DoGc (%) | 50 | 23 | 2 | 31 | 48 | 89 | 76 | 20 |
| IECd/mmol g−1 | 1.81 ± 0.01 | 1.09 ± 0.05 | <0.1 | 1.44 ± 0.07 | 1.69 ± 0.05 | 2.13 ± 0.05 | 2.01 ± 0.02 | 0.87 ± 0.06 |
| WUe (%) | 67 ± 4 | 14 ± 4 | <1% | 30 ± 4 | 35 ± 2 | 57 ± 5 | 53 ± 6 | 15 ± 5 |
T
dry![[thin space (1/6-em)]](https://www.rsc.org/images/entities/char_2009.gif) f/μm f/μm |
43 ± 2 | 32 ± 2 | 25 ± 2 | 45 ± 2 | 39 ± 3 | 47 ± 2 | 47 ± 2 | 36 ± 2 |
T
hyd![[thin space (1/6-em)]](https://www.rsc.org/images/entities/char_2009.gif) g/μm g/μm |
56 ± 2 | 39 ± 2 | 25 ± 2 | 50 ± 2 | 45 ± 2 | 62 ± 3 | 60 ± 2 | 40 ± 3 |
| TPSh (%) | 29 ± 4 | 22 ± 4 | 0 | 13 ± 6 | 15 ± 4 | 32 ± 4 | 28 ± 4 | 10 ± 6 |
| σ (80 °C, hydrated)i/mS cm−1 | 48 ± 2 | 24 ± 3 | <1 | 32 ± 2 | 46 ± 4 | 68 ± 3 | 60 ± 2 | 16 ± 3 |
After the grafting step, the ETFE-g-poly(VBC) grafted films were thoroughly washed in toluene, and then heated in toluene at 70 °C for 5 h: this process is employed to remove excess unreacted VBC and any poly(VBC) homopolymer (polymerised VBC that is not chemically bound to the ETFE) that may be present in the grafted films. The resulting intermediate ETFE-g-poly(VBC) films were subsequently dried at 70 °C for 5 h in a vacuum oven to remove all traces of solvent. The degree of grafting (DoG, %) of the ETFE-g-poly(VBC) intermediate membranes was calculated as follows:
 | (1) |
Optimised RG-AEM(Cl−) preparation using thicker 50 μm ETFE
This study is primarily targeted at the development of thin RG-AEMs that were prepared using 25 μm ETFE films: thinner electrolytes generally perform better in electrochemical applications (especially AEMFCs). However, for scientific rigor and comparison purposes, the optimal electron-beam dose, diluent system, and VBC monomer concentration were also determined when using thicker 50 μm ETFE films: parameters such as the grade and supplier of the ETFE, the temperature and the surfactant content were identical to those used for the grafting of the thinner ETFE. The key details of the synthesis of thicker RG-AEM(Cl−) are presented in ESI Table S2† with selected data highlighted at the end of this article.Gravimetric water uptake (WU) and through-plane swelling (TPS)
Excess surface water on fully hydrated RG-AEMs(Cl−) samples directly removed from UPW storage, was removed by dabbing with filter paper before immediate recording of the hydrated masses (mhyd) and thicknesses (Thyd). Thicknesses were recorded using an outside digital micrometer (error = ±2 μm). The RG-AEMs(Cl−) samples were subsequently dried in a vacuum oven at 50 °C for 15 h before the dry masses (mdry) and thicknesses (Tdry) were recorded. All measurements were conducted with triplicate samples of each RG-AEM(Cl−). The gravimetric water uptakes (WU) and through-plane swellings (TPS) were calculated by: | (2) |
 | (3) |
Ion-exchange capacities (IEC)
The ion exchange capacities (IEC) were determined using the dried RG-AEM(Cl−) samples recovered from the WU measurements (above). The RG-AEM(Cl−) samples, of known dried mass, were immersed in aqueous NaNO3 solution (20 cm3, 2.4 mol dm−3) for 5 h. The solutions were subsequently acidified with aqueous HNO3 (2 cm3, 2 mol dm−3) and titrated with standardised aqueous AgNO3 solution (20.00 ± 0.06 mmol dm−3). A Metrohm 848 Titrino Plus autotitrator equipped with an Ag Titrode (Cl− anion selective electrode) was used for the titrations. The IEC (mmol g−1) was calculated from the end point (Ep, cm3), taken as the maxima in the first differential plot of the Ag Titrode potential vs. volume data: | (4) |
Ionic conductivity (Cl− anions, in-plane, fully hydrated)
The membrane samples tested for ionic conductivity were taken directly from the RG-AEM(Cl−)s, which were stored in UPW after synthesis. The Cl− conductivities of fully hydrated RG-AEMs were measured using a Solartron 1260/1287 combination controlled by ZPlot/ZView software (Scribner Associates, USA). Impedance spectra were collected over a frequency range of 0.3 Hz–100 kHz (10 mV amplitude) with the samples mounted in a 4-probe BekkTech BT-112 test cell (supplied by Alvatek, UK) that was submerged in UPW at controlled temperatures. Ionic resistance values were extracted from the low frequency x-axis intercept. The conductivity (σ/mS cm−1) was then calculated using: | (5) |
Raman micro-spectroscopy
A DXR Raman microscope (Thermo Scientific) was used in this study. This instrument includes a near-IR (780 nm) excitation laser and a confocal microscope. Raman microscopy was used to visualize the through-plane distributions of components throughout the thickness of samples of each RG-AEM and their intermediate ETFE-g-poly(VBC) membranes. A 50× objective was used and the resulting laser spot diameter was 1–2 μm. Raman measurements were recorded with 24 mW of laser power and a 50 μm slit aperture. Spectra were collected using OMNIC™ software with an Array Automation function. Line maps were obtained using 1 μm sized steps across the cross-sections of the pre-aminated ETFE-g-poly(VBC) samples. The area maps were recorded with 2 μm sized steps in both x and y directions of the RG-AEM sample cross-sections. The vertical z displacement was fixed. A single spectrum was recorded at each point (shift range of 3350–200 cm−1, resolution <9 cm−1). Each spectrum was averaged over 4 acquisitions for line maps and 2 acquisitions for the area maps (21 s per acquisition). Each pixel represents data extracted from each acquired spectrum.Energy-dispersive X-ray spectroscopy (EDX) analysis
EDX line map data were used to corroborate Raman through-plane distribution data for each intermediate (pre-aminated) ETFE-g-poly(VBC) membrane. The film samples were first placed vertically in a cured disk of Struers’ epoxy resin and the surface was then polished using a diamond to obtain a flat (<0.04 μm deviation) cross-sectional area of each membrane sample. To make the samples electronically conductive, all the EDX samples were coated with a 3 nm carbon layer. SEM images were obtained with a JSM-7100F Field Emission Scanning Electron Microscope (SEM). To study the distribution of the poly(VBC) grafts through the thickness of the ETFE-g-poly(VBC) samples, elemental EDX line maps, Cl (on the poly(VBC) grafts) and F (on ETFE base polymer), were recorded using a Noran system seven (v. 3.1) ultradry SSD X-ray detector.Relative tensile stress–strain testing
Mechanical tensile strength testing of the electron-beamed ETFE base polymer films and RG-AEM(Cl−) samples were characterised for modulus and ultimate tensile strength using stress–strain data recorded with a universal mechanical tester (Instron® 5500 Series Single Column Testing System). A rectangular membrane sample (6 cm × 1.5 cm) was stretched at a constant rate of 2 mm min−1 until failure: the tests were repeated on n = 3 samples of each RG-AEM tested. These simple tests are for relative comparison between the samples only: we are not reporting absolute mechanical properties against ASTM standards.H2/O2 anion-exchange membrane fuel cell (AEMFC) benchmark testing
Results and discussion
Effect of irradiation and grafting conditions on the IEC, WU and TPS of the resulting RG-AEM(Cl−)s
ETFE-g-poly(vinylbenzyltrimethylammonium chloride)-type RG-AEMs (ETFE-g-poly(VBTMA+Cl−)) have been developed and studied at the University of Surrey over the last decade.4,13,17,27 The prior state-of-the-art synthesis protocol involved radiation-induced grafting of ETFE films at 70 °C using grafting mixtures consisting of 79 vol% propan-2-ol, 1 vol% surfactant (1-octyl-2-pyrrolidone) and 20 vol% VBC monomers.4 However, the use of these conditions mandated the use of a high absorbed dose of electron-beam radiation (70 kGy), which led to RG-AEMs with sub-optimal mechanical strengths. Therefore, a key priority of this study was the development of a new synthesis protocol that required lower absorbed doses of <50 kGy. As can be seen in Table 1 and Fig. 1, lowering the absorbed dose to 40 kGy without changing the other parameters, led to a 40% drop in IEC (E-1vs.E-R).‡ In addition, VBC is an expensive and toxic monomer, making the reduction in its use during reaction a priority. When both the radiation dose and the VBC concentration were simultaneously reduced (40 kGy, 5 vol% VBC), while still using propan-2-ol diluent, the IEC of the resulting RG-AEM (E-2) reduced to effectively zero.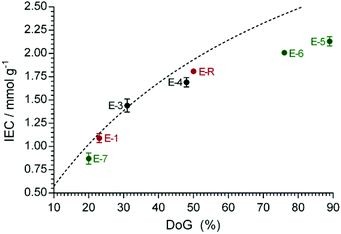 | ||
Fig. 1 The relationship between ion-exchange capacity (IEC) and degree of grafting (DoG) for the RG-AEM(Cl−)s synthesised using propan-2-ol (red), 1![[thin space (1/6-em)]](https://www.rsc.org/images/entities/char_2009.gif) : :![[thin space (1/6-em)]](https://www.rsc.org/images/entities/char_2009.gif) 1 propan-2-ol 1 propan-2-ol![[thin space (1/6-em)]](https://www.rsc.org/images/entities/char_2009.gif) : :![[thin space (1/6-em)]](https://www.rsc.org/images/entities/char_2009.gif) water (black) and water (green) as diluents in the grafting step. The data for E-2 is omitted for clarity as the IEC is effectively zero. Error bars give the sample standard deviations for measurements on n = 3 samples of each RG-AEM. The dashed line gives the calculated IECs as a function of DoG (see eqn (6)). water (black) and water (green) as diluents in the grafting step. The data for E-2 is omitted for clarity as the IEC is effectively zero. Error bars give the sample standard deviations for measurements on n = 3 samples of each RG-AEM. The dashed line gives the calculated IECs as a function of DoG (see eqn (6)). | ||
Therefore, a change of diluent system was investigated to see what effect this had on the grafting process. It has been reported that enhanced grafting is achieved with the use of a non-solvent diluent.28 Moreover, addition of water to the propan-2-ol was found to enhance the kinetics of styrene grafting onto FEP.29 Thus, three different diluent mixtures were investigated with 5 vol% VBC and ETFE electron-beamed to 40 kGy absorbed dose: propan-2-ol only (E-2), 1![[thin space (1/6-em)]](https://www.rsc.org/images/entities/char_2009.gif) :
:![[thin space (1/6-em)]](https://www.rsc.org/images/entities/char_2009.gif) 1 (v/v) propan-2-ol
1 (v/v) propan-2-ol![[thin space (1/6-em)]](https://www.rsc.org/images/entities/char_2009.gif) :
:![[thin space (1/6-em)]](https://www.rsc.org/images/entities/char_2009.gif) water (E-4), and water only (E-5). The addition of water in the grafting step enhanced the IECs to values that were higher than when propan-2-ol and 20 vol% VBC were used (E-4 IEC = 1.69 ± 0.05 mmol g−1 and E-5 IEC = 2.13 ± 0.05 mmol g−1vs.E-1 IEC = 1.09 ± 0.05 mmol g−1, see Table 1). The VBC
water (E-4), and water only (E-5). The addition of water in the grafting step enhanced the IECs to values that were higher than when propan-2-ol and 20 vol% VBC were used (E-4 IEC = 1.69 ± 0.05 mmol g−1 and E-5 IEC = 2.13 ± 0.05 mmol g−1vs.E-1 IEC = 1.09 ± 0.05 mmol g−1, see Table 1). The VBC![[thin space (1/6-em)]](https://www.rsc.org/images/entities/char_2009.gif) :
:![[thin space (1/6-em)]](https://www.rsc.org/images/entities/char_2009.gif) water volume ratios for E-4 and E-5 were 1
water volume ratios for E-4 and E-5 were 1![[thin space (1/6-em)]](https://www.rsc.org/images/entities/char_2009.gif) :
:![[thin space (1/6-em)]](https://www.rsc.org/images/entities/char_2009.gif) 9 and 1
9 and 1![[thin space (1/6-em)]](https://www.rsc.org/images/entities/char_2009.gif) :
:![[thin space (1/6-em)]](https://www.rsc.org/images/entities/char_2009.gif) 19, respectively. The increase in the water content affects the amount, size, and life time of the colloidal micelles in the grafting mixture: the use of water increases the size of the micelles (ESI Table S3†), which had been previously reported to enhance the DoG.30 For scientific rigor, a higher VBC content was investigated with the mixed propan-2-ol and water system (E-3, VBC
19, respectively. The increase in the water content affects the amount, size, and life time of the colloidal micelles in the grafting mixture: the use of water increases the size of the micelles (ESI Table S3†), which had been previously reported to enhance the DoG.30 For scientific rigor, a higher VBC content was investigated with the mixed propan-2-ol and water system (E-3, VBC![[thin space (1/6-em)]](https://www.rsc.org/images/entities/char_2009.gif) :
:![[thin space (1/6-em)]](https://www.rsc.org/images/entities/char_2009.gif) water volume ratio = 1
water volume ratio = 1![[thin space (1/6-em)]](https://www.rsc.org/images/entities/char_2009.gif) :
:![[thin space (1/6-em)]](https://www.rsc.org/images/entities/char_2009.gif) 2). This led to a drop in IEC to 1.44 ± 0.07 mmol g−1.
2). This led to a drop in IEC to 1.44 ± 0.07 mmol g−1.
As the IEC of E-5 (made using 40 kGy and water diluent) was so high, an attempt was made to lower the dose further. The IEC of E-6 (30 kGy and water diluent) remained high (2.01 ± 0.02 mmol g−1) but a further reduction to 20 kGy (E-7) led to a large drop in IEC (0.87 ± 0.06 mmol g−1). Therefore, electron-beam doses of <30 kGy can't be used for this specific RG process.
The relationship between the DoG and the IEC is shown in Fig. 1. The theoretical IECcalc values were calculated as a function of DoG, assuming full amination of the poly(VBC) grafted chains and no side reactions (e.g. cross-linking) upon the exposure of ETFE to radiation and on grafting:
 | (6) |
From Fig. 2, it can be seen that the gravimetric WU and TPS values generally increase with IEC, with the RG-AEM(Cl−)s synthesised using only propan-2-ol as diluent leading to larger deviations from the general trend. These data are early indications that RG using VBC in organic-diluent-free media (water only) produced RG-AEMs with more enhanced and predictable properties (especially at lower absorbed doses).
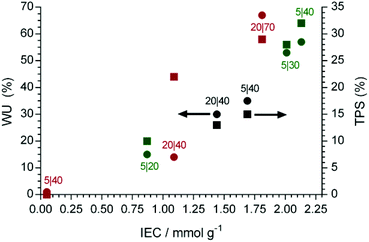 | ||
Fig. 2 A comparison between the gravimetric water uptake (WU, ●) and through plane swelling (TPS, ■) vs. IEC for the RG-AEM(Cl−)s synthesised using propan-2-ol only (red), 1![[thin space (1/6-em)]](https://www.rsc.org/images/entities/char_2009.gif) : :![[thin space (1/6-em)]](https://www.rsc.org/images/entities/char_2009.gif) 1 propan-2-ol (black) and water only (green) diluents in the grafting step. The A|B numbers (e.g. 5|30) represent the VBC (vol%)|radiation dose (kGy), respectively. The means of n = 3 repeats are shown and errors bars are omitted for clarity (the errors are presented in Table 1). 1 propan-2-ol (black) and water only (green) diluents in the grafting step. The A|B numbers (e.g. 5|30) represent the VBC (vol%)|radiation dose (kGy), respectively. The means of n = 3 repeats are shown and errors bars are omitted for clarity (the errors are presented in Table 1). | ||
Raman micro-spectroscopic and EDX data
Raman spectroscopy was used to compare the chemical composition of the virgin ETFE precursor film (before electron-beaming), an intermediate ETFE-g-poly(VBC) grafted membrane (that was ultimately used to produce E-5), and the final target RG-AEMs (Fig. 3). The spectrum of the ETFE showed CF2 stretches at 833 cm−1 and a CH2 bend at 1442 cm−1 as expected. The reaction of VBC with the irradiated ETFE film introduced new bands including an aromatic ring quadrant stretch at 1610 cm−1,32 an aromatic meta stretch at 999 cm−1,32§ C–Cl stretches between 600–800 cm−1, and the highly characteristic CH2 wag of the –CH2Cl at 1268 cm−1.32 This latter band is highly diagnostic of the level of amination: in this study it disappears during the amination stage of the synthesis (quaternisation with trimethylamine), indicating complete conversion of the –CH2Cl to the target benzyltrimethylammonium (BTMA) chloride groups. A new band at 753 cm−1 was observed after quaternisation, which is indicative of the presence of –N+(CH3)3 groups.4,32,33 Three different RG-AEMs (E-2, E-4, and E-5) were chosen for further discussion for their low, medium and high DoGs and where the only difference between the synthesis of these RG-AEMs is the diluent used in the grafting stage. The differences in the DoG correlated with the relative intensity of the Raman bands at 1610 cm−1 and 999 cm−1 (that derive from the poly(VBC) grafts) vs. the intensity of the band at 833 cm−1 (that derives from the ETFE precursor component).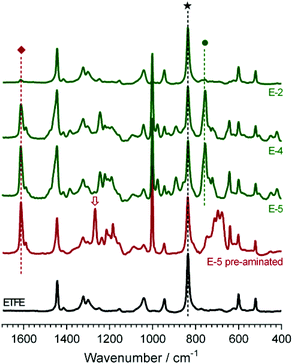 | ||
| Fig. 3 The Raman spectra (780 nm laser) of the precursor (pre-electron-beamed) ETFE film (black), the ETFE-g-poly(VBC) intermediate film used to produce E-5 (red) and the RG-AEMS E-2, E-4, and E-5 (green, with DoG = 2, 48, and 89%, respectively). The spectra were normalised to the intensity of the ETFE-derived peak at 835 cm−1 (★) for ease of visual comparison. The band at 1610 cm−1 (◆) relates to the benzene ring in the poly(VBC) grafts and the band at 753 cm−1 (●) relates to the trimethylammonium group in the target RG-AAEMs. The band at 1268 cm−1 (⇩) relates to the –CH2Cl group in the ETFE-g-poly(VBC) intermediate (pre-aminated) membranes, which disappears on full amination. A complete set-of spectra for all RG-AEM(Cl−)s is presented in ESI Fig. S1.† | ||
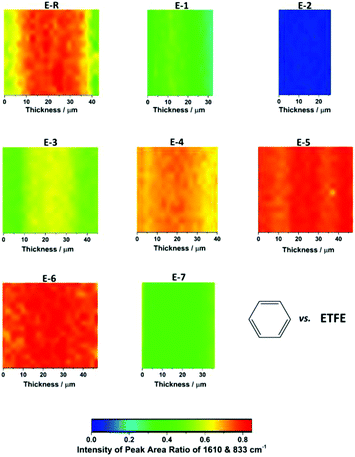
The through-plane profile of poly(VBC) grafts was analysed using Raman spectroscopic mapping. The absolute values of the intensities of the spectroscopic bands can vary from spectra to spectra due non-uniformity of the evenness of the surface (relative to the incident angle and focal point of the laser beam) and changes in the fluorescence background (due to impurities or defects). Hence, the relative intensities of the bands vs. an internal benchmark (the ETFE-derived CF2 band at 833 cm−1) were used to generate accurate maps. Fig. 4 shows the Raman maps for the synthesized RG-AEMs that mapped the relative area of the 1611 cm−1 band (related to the grafted poly(VBC) component) vs. the area of the 833 cm−1 band. The general intensities of the maps correlate well with the IECs and the thicknesses of the RG-AEMs: the higher the IEC, the higher the relative intensity of the 1610 cm−1 band and the thicker the AEMs appear in the Raman maps. The reference RG-AEM E-R showed the least uniform grafting profile with lower levels of grafting at the surfaces of the membrane. This trend appears to be different from the grafting-front behaviour reported simultaneous grafting polymerisation, where the base polymers are submerged in the monomer solution and irradiated in situ.34 The RG-AEMs synthesised using water as diluent and with absorbed doses of 30–40 kGy showed the highest levels of grafting.
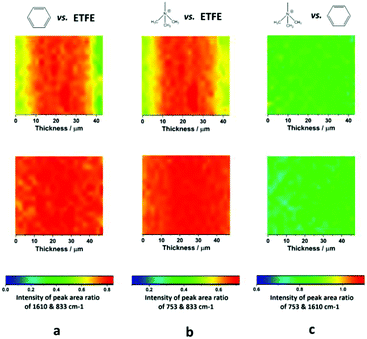
However, the distribution of benzyl groups may not represent the final distribution of trimethylammonium groups in the RG-AEMs. Hence, Fig. 5 shows Raman area ratio maps for E-6 and E-R: 1610 cm−1/833 cm−1 (benzene vs. ETFE), 753 cm−1/833 cm−1 (trimethylammonium vs. ETFE), and 753 cm−1/1610 cm−1 (trimethylammonium vs. benzene). These data clearly show that the distributions of grafts (and hence the polymer-bound ammonium cations) are more uniform with the new optimised synthesis protocol, even with radiation absorbed doses as low as 30 kGy. These data also show that amination is uniform.
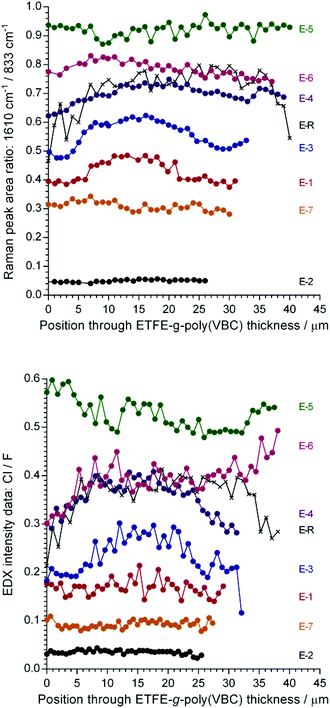
Raman line maps across a sample cross-section of each ETFE-g-poly(VBC) intermediate (pre-aminated) membrane (Fig. 6 (top)) correlated to the cross-sectional area maps recorded on the final RG-AEM(Cl−)s (as expected). These line maps were recorded so that the Raman data could be validated with an EDX line map (Fig. 6 (bottom)): as the F distribution represents the ETFE backbone and the Cl distribution represents the grafts (–CH2Cl groups),35 the grafting level is represented by the Cl/F ratio. A comparison of Fig. 6 (top) and (bottom) clearly shows that the graft distributions recorded by both techniques closely match.
Cl− anion conductivities
One of the most important properties of any AEM is ion conductivity. It is important to note that the conductivities in this work were for the AAEMs in the as-synthesised Cl− form. This is the form of the RG-AEMs that is directly synthesised; this is before any exposure to extreme pH environments that may lead to changes in, or degradation of, the membranes (E-5 was found to lose 16% of its IEC when treated in an accelerated degradation study involving immersion in aqueous potassium hydroxide (1 mol dm−3) at 80 °C for 28 d, which is in line with observations from our recent head-group chemistry study).36 These Cl− anion conductivities translate into OH− conductivities of over 130 mS cm−1 at 80 °C (ref. 36), a value that is competitive to other state-of-art high conductive AEMs, such as for the polymers based on poly(2,6-dimethyl-1,4-phenylene oxide) backbones that have reported OH− conductivities in the range 89–200 mS cm−1 at 80 °C.37–39The in-plane ion conductivities of the fully hydrated RG-AEM(Cl−) were measured at various temperatures by the four-probe impedance technique (Fig. 7). E-5, with the highest IEC (2.13 mmol g−1), showed the highest Cl− conductivity in water at 80 °C (68 ± 3 mS cm−1), while reducing the radiation absorbed dose from 40 kGy to 30 kGy only led to a marginal drop in Cl− conductivity under the same conditions (E-6, 60 ± 2 mS cm−1). Both of the RG-AEM(Cl−)s, synthesised using water diluent, gave higher Cl− conductivities than the reference (E-R, 48 ± 2 mS cm−1) that was synthesised using propan-2-ol diluent and a high absorbed dose (70 kGy). From Fig. 7 (bottom), it is clear that the Cl− conductivities generally increase with IEC.
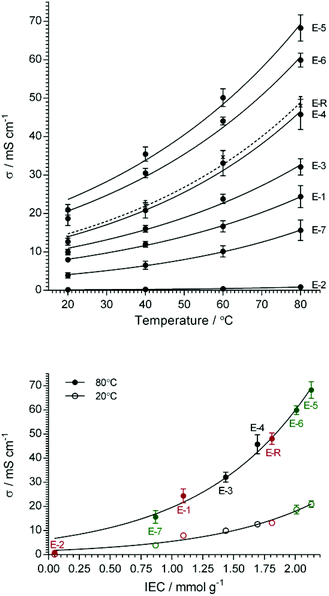 | ||
Fig. 7 The Cl− anion conductivities of the RG-AEM(Cl−) as a function of temperature (top plot) and IEC (bottom plot). Error bars are sample standard deviations of measurements on n = 3 samples of each RG-AEM(Cl−). The lines are arbitrary exponential growth fits as a visual guide only. The activation energies (Ea/kJ mol−1) calculated from Arrhenius log![[thin space (1/6-em)]](https://www.rsc.org/images/entities/char_2009.gif) σ/T−1 data, that is derived from the top plot, are presented in Table 2. σ/T−1 data, that is derived from the top plot, are presented in Table 2. | ||
The Cl− conduction activation energies (Ea/J mol−1) were calculated using:
| Ea = −b × R | (7) |
Tensile strength testing
The tensile mechanical data for Nowoflon ETFE before and after exposure to electron-beam radiation are presented in Fig. 8 and Table 3. It is clear that exposure to increasing absorbed doses of radiation leads to both a decrease in the Young's modulus (from the initial slope of the curves below 3% strain) and the ultimate tensile strength of the ETFE. This is likely due to the increased levels of C–C bond breakage in the ETFE backbone.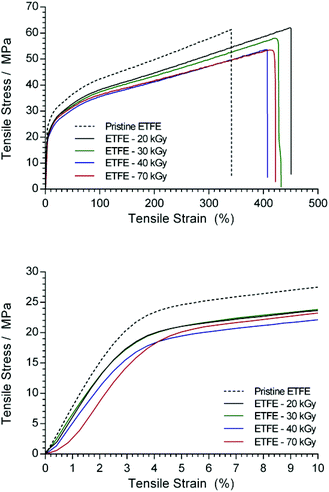 | ||
| Fig. 8 Tensile measurements of the 25 μm ETFE before and after exposure to various absorbed radiation doses (4.5 MeV energy electron-beam). | ||
| Young's modulus/MPa | Stress at break/MPa | Elongation at break (%) | |
|---|---|---|---|
| ETFE – pristine | 729 ± 26 | 62 ± 7 | 350 ± 29 |
| ETFE – 20 kGy | 620 ± 101 | 59 ± 3 | 461 ± 35 |
| ETFE – 30 kGy | 618 ± 92 | 57 ± 3 | 415 ± 72 |
| ETFE – 40 kGy | 530 ± 59 | 53 ± 3 | 407 ± 42 |
| ETFE – 70 kGy | 495 ± 72 | 52 ± 6 | 374 ± 49 |
| E-R | 110 ± 38 | 18 ± 4 | 148 ± 39 |
| E-5 | 262 ± 9 | 27 ± 2 | 219 ± 46 |
| E-6 | 416 ± 17 | 30 ± 8 | 189 ± 17 |
After grafting and amination, the tensile properties of the RG-AEM(Cl−)s dramatically decreased (Fig. 9), especially for the reference E-R. However, it was evident that a reduction in the electron-beam absorbed dose produced stiffer and stronger RG-AEM(Cl−)s (Table 3): E-6 (30 kGy) yielded the best mechanical properties of the RG-AEM(Cl−)s tested. Furthermore, dynamic mechanical analysis (DMA) was used to compare the storage and loss modulus of E-R and E-6 over a larger temperature range up to 175 °C (ESI Fig. S4†). The modulus of E-6 is higher than E-R for the entire temperature range.
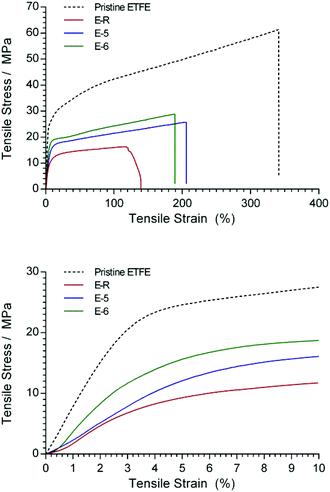 | ||
| Fig. 9 Tensile measurements of the 25 μm pristine ETFE and the RG-AEM(Cl−)s E-R, E-5, and E-6 (the latter two made using water diluent and 5 vol% VBC). | ||
H2/O2 Anion-Exchange Membrane Fuel Cell (AEMFC) benchmark testing of E-6 and E-R at 60 °C
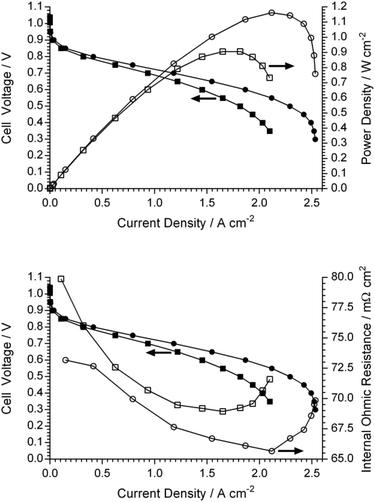
On a balance between the homogeneity of grafting, ionic conductivities, and mechanical properties of the RG-AEM(Cl−)s, E-6 was down-selected for a beginning-of-life AEMFC test with a relative comparison with the reference E-R (Fig. 10). The test conditions were highly optimised to produce the best performances (fast, fully humidified gas flows and the use of Pt-based catalysts) but these allow meaningful relative performance evaluation of the RG-AEM(OH−)s under practically identical test conditions. PtRu/C and Pt/C were chosen as anode and cathode catalysts, respectively, as they were proven to have high performance in AEMFC:40 this meant that electrocatalytic performance losses were minimised. The AEMFC test temperature was limited to 60 °C to minimise any in situ degradation of the RG-AEM and ionomer components.The peak power density of the AEMFC containing the reference E-R (geometric power density of 0.91 W cm−2) is comparable to the highest performing examples in the AEMFC literature (operated under similar conditions),40–43 including the record performances reported by Zhuang et al.40 It is clear that the AEMFC performance of E-6 (1.16 W cm−2) is higher relative to E-R with limiting current densities of 2.5 and 2.1 A cm−2, respectively. The improved performance of E-6 cannot be wholly explained by differences in the internal ohmic resistance: 67 mΩ cm2vs. 69 mΩ cm2 for E-R at ca. 1.5 A cm−2 would only lead to a 3 mV ohmic loss at this current density for E-R (and the difference in cell potential at this current density is larger than this). It is clear that mass transport losses initiate at lower current densities for E-R. This may arise from lower levels of back-diffusion of water from the anode (where it is generated) to cathode (where it is consumed), for this reference RG-AEM(OH−), leading to larger levels of flooding at the anode. Recall that the reference E-R had poorer grafting homogeneity. In summary, the higher performance of the AEMFC containing E-6 is attributed to the higher conductivity and more homogenous grafting of this RG-AAEM(OH−).
Comparison with the optimal conditions for the synthesis of RG-AEMs using thicker 50 μm ETFE base films
As a small side study, the effect of water and propanol content in the grafting step was also investigated for thicker 50 μm thick ETFE base films. ESI Table S2† summarises the synthesis variables and selected resulting properties of all six thicker RG-AEMs investigated. In contrast to the thinner RG-AEMs (made from 25 μm thick ETFE), a mixed diluent (propan-2-ol![[thin space (1/6-em)]](https://www.rsc.org/images/entities/char_2009.gif) :
:![[thin space (1/6-em)]](https://www.rsc.org/images/entities/char_2009.gif) H2O = 1
H2O = 1![[thin space (1/6-em)]](https://www.rsc.org/images/entities/char_2009.gif) :
:![[thin space (1/6-em)]](https://www.rsc.org/images/entities/char_2009.gif) 3 or 1
3 or 1![[thin space (1/6-em)]](https://www.rsc.org/images/entities/char_2009.gif) :
:![[thin space (1/6-em)]](https://www.rsc.org/images/entities/char_2009.gif) 1) yielded the most optimal level of grafting: the RG-AEMs synthesised from the thicker ETFE clearly require the presence of propan-2-ol in the grafting mixture. This may relate to the speed of penetration of the VBC monomer into the full thickness of the 50 μm thick ETFE during the grafting step and the facilitation of this by the presence of propan-2-ol. The above trend is clearly seen in Fig. 11, which compares the IECs of the thicker AEMs with the thinner AEMs as a function of water content in the grafting mixture.
1) yielded the most optimal level of grafting: the RG-AEMs synthesised from the thicker ETFE clearly require the presence of propan-2-ol in the grafting mixture. This may relate to the speed of penetration of the VBC monomer into the full thickness of the 50 μm thick ETFE during the grafting step and the facilitation of this by the presence of propan-2-ol. The above trend is clearly seen in Fig. 11, which compares the IECs of the thicker AEMs with the thinner AEMs as a function of water content in the grafting mixture.
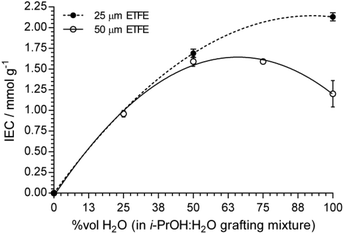 | ||
Fig. 11 The relationship between IEC and the water content (vol%) in the propan-2-ol![[thin space (1/6-em)]](https://www.rsc.org/images/entities/char_2009.gif) : :![[thin space (1/6-em)]](https://www.rsc.org/images/entities/char_2009.gif) H2O diluent mixture for the RG-AEM(Cl−)s made using 50 μm ETFE (open) and 25 μm ETFE (solid). The RG-AEMs were made using 40 kGy electron-beam absorbed dose and grafted at 70 °C with 5 vol% VBC and 1 vol% surfactant (see Table S2†). The lines are arbitrary 2nd order polynomial fits as a visual guide only. Error bars are sample standard deviation for data collected on n = 3 samples of each RG-AEM(Cl−). H2O diluent mixture for the RG-AEM(Cl−)s made using 50 μm ETFE (open) and 25 μm ETFE (solid). The RG-AEMs were made using 40 kGy electron-beam absorbed dose and grafted at 70 °C with 5 vol% VBC and 1 vol% surfactant (see Table S2†). The lines are arbitrary 2nd order polynomial fits as a visual guide only. Error bars are sample standard deviation for data collected on n = 3 samples of each RG-AEM(Cl−). | ||
Fig. S2† shows the Raman area maps (ratio of the areas of the 1610 cm−1 to 833 cm−1 bands) of the ETFE-g-poly(VBC) intermediate membranes used to synthesise the RG-AEM(Cl−)s from the thicker 50 μm ETFE films. The intermediate (pre-aminated) membrane that was used to form the RG-AEM E50-R shows a higher level of grafting in the centre; this was also seen with the thinner E-R RG-AEM. EDX and Raman line maps confirm this effect (Fig. S3†). The most homogeneous grafting was seen for the intermediate to E50-3, which was synthesised using propan-2-ol![[thin space (1/6-em)]](https://www.rsc.org/images/entities/char_2009.gif) :
:![[thin space (1/6-em)]](https://www.rsc.org/images/entities/char_2009.gif) H2O = 1
H2O = 1![[thin space (1/6-em)]](https://www.rsc.org/images/entities/char_2009.gif) :
:![[thin space (1/6-em)]](https://www.rsc.org/images/entities/char_2009.gif) 1. This led to the E50-3 RG-AEM(Cl−) having the highest conductivity (48 ± 2 mS cm−1 at 80 °C in water) for the thicker RG-AEM(Cl−)s synthesised using a 40 kGy electron-beam absorbed dose.
1. This led to the E50-3 RG-AEM(Cl−) having the highest conductivity (48 ± 2 mS cm−1 at 80 °C in water) for the thicker RG-AEM(Cl−)s synthesised using a 40 kGy electron-beam absorbed dose.
Recycling of water and solution
In order to assess the recyclability of the aqueous grafting mixture, it was used to graft two AEMs sequentially (E-6A then E-6A*) using the method used to synthesise E-6 (Table 4). The second AEM, produced using the recycled grafting mixture, exhibited a much lower DoG and IEC. However, in a separate experiment, after grafting a further AEM (E-6B) using the E-6 synthesis method, the residual grafting mixture was allowed to separate at 4 °C for 24 h to form distinct, clear aqueous and organic layers (see ESI Fig. S5†): the decanted aqueous layer was reconstituted by adding fresh VBC (5 vol%) and 1-octyl-2-pyrrolidinone (1 vol%). Use of this ‘recycled water’ reconstituted grafting mixture in a second graft reaction produced an AEM (E-6B*) whose measured properties were close to the original AEM produced using the fresh grafting mixture (E-6B). Gas chromatography mass spectrometry (GCMS) analysis of the aqueous layer prior to the second grafting showed the residual organic impurities to be predominantly vinyl benzyl alcohol (VBA) and 1-octyl-2-pyrrolidinone with only trace amounts of VBC (see ESI Fig. S6†). The presence of the impurity VBA did not appear to significantly affect the properties of the AEM synthesised using the “recycled”, reconstituted aqueous later (E-6Bvs.E-6B*) from the data collected in this initial study: however, a full study of the presence and effect of VBA impurities on the grafting reaction will now be conducted to specifically investigate this. The organic layer, which was dissolved in acetonitrile to perform GCMS, contained VBC, VBA and 1-octyl-2-pyrrolidinone (see ESI Fig. S6†).| RG-AEM(Cl − ) | E-6A | E6-A* | E-6B | E-6B* |
|---|---|---|---|---|
| DoG (%) | 69 | 57 | 76 | 79 |
| IEC/mmol g−1 | 1.99 ± 0.01 | 1.25 ± 0.02 | 2.05 ± 0.01 | 2.05 ± 0.07 |
| WU (%) | 54 ± 4 | 26 ± 4 | 60 ± 5 | 55 ± 7 |
| TPS (%) | 40 ± 2 | 12 ± 1 | 42 ± 2 | 48 ± 3 |
Since GCMS is unlikely to detect polymers, the residual organic layer (from the synthesis of E-6A, see ESI Fig. S5†) was also characterised using Raman spectroscopy (ESI Fig. S7†). To assist in the identification of the components in the organic residual layer, the Raman spectra of VBC, poly(VBC), and 1-octyl-2-pyrrolidone were also recorded. The Raman spectrum of the organic residual contained peaks that are related to VBC, with the additional presence of peaks related to smaller quantities of 1-octyl-2-pyrrolidone and possibly poly(vinylbenzyl chloride). An additional peak at 1032 cm−1 is the C–O stretch of –CH2OH,32 which indicates the presence of a quantity of vinylbenzyl alcohol (VBA): hence, the residual grafting mixture predominantly contains both VBC and VBA. The insufficient concentration of VBC and the impure nature of the residual grafting mixture are the reasons for the lower IEC of AEM synthesised from the complete residual mixture (E-6A*).
Conclusions
This study reports the synthesis of a poly(ethylene-co-tetrafluoroethylene) (ETFE)-based radiation-grafted anion-exchange membrane (RG-AEM). This new RG-AEM was synthesised using an organic-solvent-free method and with reduced amounts of both monomer (vinylbenzyl chloride, VBC) concentration and electron-beam radiation absorbed dose compared to a reference RG-AEM synthesised using the prior state-of-the-art protocol. The new RG-AEM (synthesised using 25 μm thick ETFE, 30 kGy dose and only 5 vol% VBC in water) exhibited superior ex situ properties such as ion-exchange capacity, grafting homogeneity, ionic conductivity, and mechanical strength compared with the previous reference RG-AEM (synthesised using 25 μm thick ETFE, 70 kGy dose and 20 vol% VBC in propan-2-ol). The new RG-AEM also outperformed the reference RG-AEM in a simple, beginning-of-life H2/O2 Anion-Exchange Membrane Fuel Cell (AEMFC) test at 60 °C. In addition, using potentially recyclable water as a diluent and using lower radiation doses moves the method closer to a commercially-relevant roll-to-roll process.In contrast, a mixed water and propan-2-ol diluent was required for optimum RG of VBC onto thicker 50 μm ETFE films: the use of only water as diluent led to lower levels of grafting. It should also be noted that the use of ETFE membranes from other suppliers may not have the same effect as different suppliers incorporate different additives and copolymer components: e.g. most commercial ETFE polymers contain between 0.1–10 mol% perfluoro(alkylvinyl ether) termonomer.30 However, to reduce the number of experimental variables, other ETFE grades from different suppliers were not studied: we have always used the Nowofol ETFE as, prior studies (in our laboratories) have shown that this type of ETFE undergoes excellent radiation-grafting.
Statement of author contribution
The paper is primarily the work of Lianqin Wang. Emanuele Magliocca conducted the optimisation of the surfactant concentration and grafting temperature. Emma Cunningham conducted the work on the optimisation of the grafting protocols for the thicker ETFE films. Julia Ponce-Gonzalez and Rachida Bance-Soualhi assisted with the membrane work and the optimised operation of the research instruments used in the study. Mohamed Nasef assisted with the interpretation of resulting data, especially regarding discussion on the emulsion polymerisation mechanism. Simon Poynton and Ricardo Escudero-Cid formulated and synthesised the powder ionomer, while William Mustain's efforts were instrumental in the development of the catalyst/ionomer-ink formulation and electrode-preparation protocols. John Varcoe, Robert Slade and Daniel Whelligan are the grant holders of the EPSRC projects that funded this work and assisted in all aspects of research direction and data analysis: John Varcoe was the principal investigator for the research and made a large contribution to the drafting of this paper.Acknowledgements and raw data access
The research was primarily supported by Engineering and Physical Sciences Research Council (EPSRC) grants EP/M014371/1, EP/M022749/1, EP/M005933/1, EP/I004882/1 and EP/H025340/1. Emma Cunningham thanks the Department of Chemistry, University of Surrey for providing funds for her undergraduate final year project (studying the optimal conditions for the radiation grafting of VBC onto 50 μm thick ETFE). Emanuele Magliocca and Ricardo Escudero-Cid thank the Erasmus scheme for funding their research visits to the University of Surrey. William Mustain's visit and research at the University of Surrey from April–August 2016 was funded by a US–UK Fulbright Commission Scholar Award. Prof. Nasef's visit and research at the University of Surrey in August 2016 was supported by the Royal Academy of Engineering under the Distinguished Visiting Fellowship scheme – Round 5. We also thank AGC Chemicals Europe for the supply of Fluon ETFE powder.All of the raw data in this open access (CC-BY) article is freely available (in compliance with EPSRC rules): the metadata and details on how to access this raw data can be found at DOI: 10.15126/surreydata.00811704.
References
- M. K. Debe, Nature, 2012, 486, 43–51 CrossRef CAS PubMed
.
- O. Groger, H. A. Gasteiger and J. P. Suchsland, J. Electrochem. Soc., 2015, 162, A2605–A2622 CrossRef
.
- S. Maurya, S. H. Shin, Y. Kim and S. H. Moon, RSC Adv., 2015, 5, 37206–37230 RSC
.
- S. D. Poynton and J. R. Varcoe, Solid State Ionics, 2015, 277, 38–43 CrossRef CAS
.
- 2015 annual progress report, https://www.hydrogen.energy.gov/annual_progress15.html.
- G. Wu, K. L. More, C. M. Johnston and P. Zelenay, Science, 2011, 332, 443–447 CrossRef CAS PubMed
.
- J. R. Varcoe, P. Atanassov, D. R. Dekel, A. M. Herring, M. A. Hickner, P. A. Kohl, A. R. Kucernak, W. E. Mustain, K. Nijmeijer, K. Scott, T. W. Xu and L. Zhuang, Energy Environ. Sci., 2014, 7, 3135–3191 CAS
.
- M. Mamlouk, X. Wang, K. Scott, J. A. Horsfall and C. Williams, Proc. Inst. Mech. Eng., Part A, 2011, 225, 152–160 CrossRef CAS
.
- C. W. B. Bezerra, L. Zhang, K. C. Lee, H. S. Liu, A. L. B. Marques, E. P. Marques, H. J. Wang and J. J. Zhang, Electrochim. Acta, 2008, 53, 4937–4951 CrossRef CAS
.
- J. R. Varcoe and R. C. T. Slade, Fuel Cells, 2005, 5, 187–200 CrossRef CAS
.
- M. M. Nasef, Chem. Rev., 2014, 114, 12278–12329 CrossRef CAS PubMed
.
- L. Gubler, Adv. Energy Mater., 2014, 4, 1300827 CrossRef
.
- O. I. Deavin, S. Murphy, A. L. Ong, S. D. Poynton, R. Zeng, H. Herman and J. R. Varcoe, Energy Environ. Sci., 2012, 5, 8584–8597 CAS
.
- J. A. Horsfall and K. V. Lovell, Eur. Polym. J., 2002, 38, 1671–1682 CrossRef CAS
.
- H. Ben youcef, S. A. Gursel, A. Buisson, L. Gubler, A. Wokaun and G. G. Scherer, Fuel Cells, 2010, 10, 401–410 CrossRef CAS
.
- R. C. T. Slade and J. R. Varcoe, Solid State Ionics, 2005, 176, 585–597 CrossRef CAS
.
- J. R. Varcoe, R. C. T. Slade, E. L. H. Yee, S. D. Poynton, D. J. Driscoll and D. C. Apperley, Chem. Mater., 2007, 19, 2686–2693 CrossRef CAS
.
- N. Walsby, M. Paronen, J. Juhanoja and F. Sundholm, J. Polym. Sci., Polym. Chem. Ed., 2000, 38, 1512–1519 CrossRef CAS
.
- A. Vahdat, H. Bahrami, N. Ansari and F. Ziaie, Radiat. Phys. Chem., 2007, 76, 787–793 CrossRef CAS
.
- R. Espiritu, M. Mamlouk and K. Scott, Int. J. Hydrogen Energy, 2016, 41, 1120–1133 CrossRef CAS
.
- L. Gubler, N. Prost, S. A. Gursel and G. G. Scherer, Solid State Ionics, 2005, 176, 2849–2860 CrossRef CAS
.
- G. Schmidt-Naake, M. Bohme and A. Cabrera, Chem. Eng. Technol., 2005, 28, 720–724 CrossRef CAS
.
- Y. Wada, M. Tamada, N. Seko and H. Mitomo, J. Appl. Polym. Sci., 2008, 107, 2289–2294 CrossRef CAS
.
- N. H. Mohamed, M. Tamada, Y. Ueki and N. Seko, Radiat. Phys. Chem., 2013, 82, 63–68 CrossRef CAS
.
- J. P. Kizewski, N. H. Mudri and J. R. Varcoe, Radiat. Phys. Chem., 2013, 89, 64–69 CrossRef CAS
.
- S. D. Poynton, R. C. T. Slade, T. J. Omasta, W. E. Mustain, R. Escudero-Cid, P. Ocon and J. R. Varcoe, J. Mater. Chem. A, 2014, 2, 5124–5130 CAS
.
- J. R. Varcoe, Phys. Chem. Chem. Phys., 2007, 9, 1479–1486 RSC
.
- G. Odian, A. Rossi, R. Klein and M. Sobel, J. Polym. Sci., 1961, 55, 663–673 CrossRef CAS
.
- T. Rager, Helv. Chim. Acta, 2003, 86, 1966–1981 CrossRef CAS
.
- J. S. Forsythe and D. J. T. Hill, Prog. Polym. Sci., 2000, 25, 101–136 CrossRef CAS
.
- T. Yamaki, K. Kobayashi, M. Asano, H. Kubota and M. Yoshida, Polymer, 2004, 45, 6569–6573 CrossRef CAS
.
-
P. J. Larkin, Infrared and Raman Spectroscopy: Principles and Spectral Interpretation, Elsevier, 2011 Search PubMed
.
- E. Pigorsch, Starch/Staerke, 2009, 61, 129–138 CrossRef CAS
.
- V. Sproll, T. J. Schmidt and L. Gubler, Polym. Int., 2016, 65, 174–180 CrossRef CAS
.
- N. Kinger, B. S. Ko, J. Y. Sohn, Y. C. Nho and J. Shin, J. Appl. Polym. Sci., 2012, 126, E349–E357 CrossRef CAS
.
- J. Ponce-González, D. K. Whelligan, L. Q. Wang, R. Bance-Soualhi, Y. Wang, Y. Peng, H. Peng, D. C. Apperley, H. N. Sarode, T. P. Pandey, A. G. Divekar, S. Seifert, A. M. Herring, L. Zhuang and J. R. Varcoe, Energy Environ. Sci., 2016, 9, 3724–3735 Search PubMed
.
- L. Zhu, T. J. Zimudzi, N. W. Li, J. Pan, B. C. Lin and M. A. Hickner, Polym. Chem., 2016, 7, 2589–2589 RSC
.
- L. Zhu, J. Pan, Y. Wang, J. J. Han, L. Zhuang and M. A. Hickner, Macromolecules, 2016, 49, 815–824 CrossRef CAS
.
- L. Zhu, J. Pan, C. M. Christensen, B. C. Lin and M. A. Hickner, Macromolecules, 2016, 49, 3300–3309 CrossRef CAS
.
- Y. Wang, G. W. Wang, G. W. Li, B. Huang, J. Pan, Q. Liu, J. J. Han, L. Xiao, J. T. Lu and L. Zhuang, Energy Environ. Sci., 2015, 8, 177–181 CAS
.
- Y. Zhao, H. M. Yu, D. L. Yang, J. Li, Z. G. Shao and B. L. Yi, J. Power Sources, 2013, 221, 247–251 CrossRef CAS
.
- M. Mamlouk, J. A. Horsfall, C. Williams and K. Scott, Int. J. Hydrogen Energy, 2012, 37, 11912–11920 CrossRef CAS
.
- L. Zeng and T. S. Zhao, Electrochem. Commun., 2013, 34, 278–281 CrossRef CAS
.
Footnotes |
| † Electronic supplementary information (ESI) available: Data on the optimisation of surfactant concentration and temperatures used in the grafting step; data supporting the grafting optimisation study that used thicker 50 μm ETFE; a full set of Raman spectra. See DOI: 10.1039/c6gc02526a |
| ‡ From the spectroscopic data in this study and prior studies, near complete amination is expected. |
| § This band is only present for the poly(3-VBC) graft segments and is not Raman active for the poly(4-VBC) containing graft segments. |
| This journal is © The Royal Society of Chemistry 2017 |

