Catalytic transfer hydrogenolysis of ionic liquid processed biorefinery lignin to phenolic compounds
Kwang Ho
Kim
ab,
Blake A.
Simmons
 ac and
Seema
Singh
*ab
aBiomass Pretreatment, Joint BioEnergy Institute, Emeryville, CA, USA. E-mail: seesing@sandia.gov; Tel: +1 925 294 4551
bBiomass Science and Conversion Technology Department, Sandia National Laboratories, Livermore, CA, USA
cBiological Systems and Engineering Division, Lawrence Berkeley National Laboratory, Berkeley, CA, USA
First published on 18th October 2016
Abstract
Lignocellulosic biomass has the potential to play a significant role in the global bioeconomy for the production of renewable fuels and chemicals. It has been estimated that there are roughly a billion tons of lignocellulose available annually in the United States alone. Valorization of residual lignin streams generated from lignocellulosic biorefineries is key for economic viability and sustainability. In this work, catalytic transfer hydrogenolysis using isopropyl alcohol (IPA) as a hydrogen-donor solvent was employed at 300 °C to valorize lignin-enriched residues obtained from an ionic liquid (IL) conversion process. This process results in high liquid yields (65.5 wt%) with a significant amount of monomers present (27 wt%) and low char formation. Compositional analysis of the process streams indicates that alkyl-substituted phenols are the main products. Lignin depolymerization was enhanced at longer reaction times and in the presence of Ru/C, producing more, low molecular weight products with a greater extent of alkylation on the aromatic rings. This work suggests that residual lignin fractions from IL-based lignocellulosic conversion technologies can be depolymerized to value-added products and low molecular weight platform chemicals for the renewable fuels and chemicals sector.
1. Introduction
Lignin is the second most abundant natural biopolymer in the biosphere, and it is currently produced in large quantities by the pulp and paper industry. It is expected that a large amount of lignin will be generated from the emerging cellulosic biorefineries, especially those that produce advanced biofuels that may not require extensive distillation. Based on a biorefinery that consumes 2000 tons of corn stover per day, 70![[thin space (1/6-em)]](https://www.rsc.org/images/entities/char_2009.gif) 000 tons of lignin will be generated at this single facility annually.1 Unlike cellulose, which is a linear polymer of glucose consisting of crystalline and amorphous structure,2 lignin is an amorphous and highly branched polymer of phenylpropane units with a complex variety of functional groups and chemical bonds. Lignin can account for up to 40% of the dry biomass weight, but is typically present in most lignocellulosic feedstocks at levels between 20–30%.3,4 Recent reports have emphasized that lignin valorization, especially for biorefinery lignin streams, to be essential not only for the economic viability but also for the sustainability of biorefineries.5–8
000 tons of lignin will be generated at this single facility annually.1 Unlike cellulose, which is a linear polymer of glucose consisting of crystalline and amorphous structure,2 lignin is an amorphous and highly branched polymer of phenylpropane units with a complex variety of functional groups and chemical bonds. Lignin can account for up to 40% of the dry biomass weight, but is typically present in most lignocellulosic feedstocks at levels between 20–30%.3,4 Recent reports have emphasized that lignin valorization, especially for biorefinery lignin streams, to be essential not only for the economic viability but also for the sustainability of biorefineries.5–8
Ionic liquid (IL) pretreatment of lignocellulose has gained considerable attention because of their promising characteristics. ILs can exhibit high thermal stability, negligible vapor pressure and have tunable physico-chemical properties (e.g., viscosity, meting point, polarity and hydrogen bond basicity), dependent on the selection of the anion and cation.9 Certain ILs have been shown to be very effective in solubilizing crystalline cellulose and improving subsequent saccharification by increasing substrate accessibility.10,11 It has been demonstrated that imidazolium-based ILs can effectively solubilize biomass and reject lignin from the recovered polysaccharides.12 More recently, the development of biocompatible and bio-derived ILs (e.g., choline-based ILs) has shown that they are effective for biomass pretreatment and enable consolidated “one-pot” biofuel production possible.13–15 This IL-based process can selectively utilize carbohydrates for biofuel production, leaving lignins relatively unaltered in the reactor in a form suitable for further processing into renewable fuels and chemicals.
One approach to convert the lignin-rich solid present after the IL conversion process is via thermochemical processing, including solvent liquefaction. There have been many studies on lignin liquefaction using acids,16,17 bases5,18,19 and supercritical alcohols.20–23 Recently, Katahira et al. investigated base-catalyzed depolymerization of representative biorefinery lignins,5 where they used sodium hydroxide to catalytically decompose lignin-rich residues at different temperatures (270–330 °C) and reported that the aqueous soluble fraction depends significantly on the method used to process lignocellulose. Roberts et al.18 also studied base-catalyzed lignin depolymerization of organosolv lignin and revealed the mechanisms of secondary reoligomerization that occur during the depolymerization reaction. It has been demonstrated that the addition of hydrogen gas or a hydrogen-donor agent can reduce repolymerization by stabilizing reactive phenols.24 From an industrial perspective, catalytic transfer hydrogenation is an attractive alternative for high-pressure catalytic hydrogenation with molecular hydrogen.25 Although molecular hydrogen is used in many industrial chemical processes, it poses a safety risk due to high diffusibility in current storage materials.26 During transfer hydrogenolysis of lignin, hydrogen-donating solvents readily generate or transfer hydrogen molecules in situ, which can subsequently promote hydrogenation reactions and decrease the safety risk associated with the process.26
There are relatively few studies focused on depolymerization of lignin residues generated by the IL conversion process.27 Toward the long-term goal of developing an effective process for lignin depolymerization and valorization in a biorefinery using ILs, it is important to study IL-processed residual lignin stream. In this work, we explore the potential of catalytic hydrogenolysis to convert residual lignin into low molecular weight valuable products. Switchgrass was pretreated with cholinium lysinate ([Ch][Lys]), followed by enzymatic saccharification. Switchgrass, a leading candidate for national energy crop production, was used because of its wide availability and economical feasibility with current biomass conversion technology.28 The lignin-enriched residue stream was recovered after saccharification and subjected to hydrogenolysis using IPA as a hydrogen-donor solvent. Despite the use of a variety of hydrogen-donating reagents, IPA remains the most popular because of its simplicity, cost, availability, and the ease of removal of both IPA and its dehydrogenation product, acetone, from reaction systems.29 The reaction products were recovered and their mass balance, composition and structure were investigated using NMR, GC-MS, GPC and FT-IR to gain detailed insights.
2. Experimental
2.1 Materials
Lignin-enriched residues were recovered after an IL pretreatment and saccharification process reported previously.15 In summary, pretreatment of switchgrass was conducted using a 50 mL pressure tube (Ace Glass Inc., Vineland, NJ). Approximately 2 g of switchgrass was loaded in 18 g of [Ch][Lys]/water solution (1![[thin space (1/6-em)]](https://www.rsc.org/images/entities/char_2009.gif) :
:![[thin space (1/6-em)]](https://www.rsc.org/images/entities/char_2009.gif) 8, g/g). After mixing of biomass, IL and water, the pressure tube was heated using an oil bath at 140 °C for 3 hours with stirring at 600 rpm. After pretreatment, the slurry was placed to room temperature to cool down and the pH was adjusted to 5 using a 2 M hydrochloric acid before saccharification. Enzymatic saccharification of pretreated biomass was conducted using commercially available enzymes, Cellic® CTec2 and HTec2 from Novozymes, at 50 °C, and a rotation speed of 150 rpm in a rotary incubator. Enzymes were added to the pressure tube with a total protein content of 20 mg protein per g biomass (before pretreatment). It is noted that IL was not separated throughout the process. After 72 hours, the solid was separated by centrifuge and washed with DI water. The enzymatic hydrolysis residues were finally freeze-dried for depolymerization reaction. The compositional analysis of lignin-enriched residue was performed according using a protocol from NREL30 and the results are presented in Table 1.
8, g/g). After mixing of biomass, IL and water, the pressure tube was heated using an oil bath at 140 °C for 3 hours with stirring at 600 rpm. After pretreatment, the slurry was placed to room temperature to cool down and the pH was adjusted to 5 using a 2 M hydrochloric acid before saccharification. Enzymatic saccharification of pretreated biomass was conducted using commercially available enzymes, Cellic® CTec2 and HTec2 from Novozymes, at 50 °C, and a rotation speed of 150 rpm in a rotary incubator. Enzymes were added to the pressure tube with a total protein content of 20 mg protein per g biomass (before pretreatment). It is noted that IL was not separated throughout the process. After 72 hours, the solid was separated by centrifuge and washed with DI water. The enzymatic hydrolysis residues were finally freeze-dried for depolymerization reaction. The compositional analysis of lignin-enriched residue was performed according using a protocol from NREL30 and the results are presented in Table 1.
| Components | wt% (dry basis) |
|---|---|
| Lignin | 57.8 |
| Carbohydrates | 20.7 |
| Glucan | 15.6 |
| Xylan | 4.6 |
| Arabinan | 0.5 |
| Ash | 9.2 |
| Others | 12.3 |
2.2 Depolymerization reactions
Lignin depolymerization was carried out in a 75 mL Parr reactor (Alloy C276). Approximately 150 mg of sample was added to the reactor and 20 mL of IPA was added. If needed, 15 mg of Ru/C (5 wt% on C) was added to the reactor. After purging the reactor with nitrogen, it was pressurized to 20 bar with nitrogen and heated to 300 °C. After reaction for the desired reaction time, the reactor was removed and quenched rapidly in an ice bath to prevent undesirable secondary reactions. Once it was cooled, the produced gases were collected using a sealed gas bag for gas analysis. The products, including liquids and solids residue were collected and filtered using acetone. The acetone and IPA were removed by rotary evaporator and weighed for calculating the liquid yield. The residual solids were completely dried under vacuum to determine yields.2.3 Analytical methods
Identification and quantification of depolymerized products of the recovered lignin was carried out using an Agilent 6890N gas chromatography (GC) equipped with Agilent 5973N mass spectroscopy (MS). The GC column used in this work was an Agilent DB-5MS (30 m × 0.25 mm × 0.25 μm). The injection temperature was 280 °C, and the split ratio used was 1![[thin space (1/6-em)]](https://www.rsc.org/images/entities/char_2009.gif) :
:![[thin space (1/6-em)]](https://www.rsc.org/images/entities/char_2009.gif) 20. The GC oven temperature was programmed to hold at 50 °C for 5 min, ramp up to 300 °C with 5 °C min−1, and then hold for an additional 5 min. In this work, 4 carbohydrates derivatives and 24 lignin derivatives were identified and quantified. For calibration, 2-furanmethanol (carbohydrates derivatives), phenol (lignin, C6), 4-methylphenol (lignin, C1C6), 4-ethylphenol (lignin, C2C6) and 4-propylphenol (lignin, C3C6) were chosen as representative compounds and each response factor was used according to the origin and/or the number of carbons in phenolic monomers identified. Gases were collected using a Multi-Layer Foil gas sampling bag (Sigma-aldrich, St Louis, MO) after the reactor was cooled down for analysis of gas composition. The non-condensable gases were analyzed using a Shimadzu GC-2014 equipped with flame ionization detector (FID) and thermal conductivity detector (TCD). The injection temperature was 25 °C, and the oven temperature was programmed to hold at 60 °C for 7 min, ramp up to 110 °C with 5 °C min−1, and then hold for an additional 8 min. Carbon monoxide, carbon dioxide, ethane and ethylene were analyzed by FID and hydrogen was analyzed by TCD after calibrating a standard gas mixture.
20. The GC oven temperature was programmed to hold at 50 °C for 5 min, ramp up to 300 °C with 5 °C min−1, and then hold for an additional 5 min. In this work, 4 carbohydrates derivatives and 24 lignin derivatives were identified and quantified. For calibration, 2-furanmethanol (carbohydrates derivatives), phenol (lignin, C6), 4-methylphenol (lignin, C1C6), 4-ethylphenol (lignin, C2C6) and 4-propylphenol (lignin, C3C6) were chosen as representative compounds and each response factor was used according to the origin and/or the number of carbons in phenolic monomers identified. Gases were collected using a Multi-Layer Foil gas sampling bag (Sigma-aldrich, St Louis, MO) after the reactor was cooled down for analysis of gas composition. The non-condensable gases were analyzed using a Shimadzu GC-2014 equipped with flame ionization detector (FID) and thermal conductivity detector (TCD). The injection temperature was 25 °C, and the oven temperature was programmed to hold at 60 °C for 7 min, ramp up to 110 °C with 5 °C min−1, and then hold for an additional 8 min. Carbon monoxide, carbon dioxide, ethane and ethylene were analyzed by FID and hydrogen was analyzed by TCD after calibrating a standard gas mixture.
The molecular weight (MW) distributions of the both liquid and solid were measured using a gel permeation chromatography (GPC). The liquid was dissolved in tetrahydrofuran (THF) with a concentration of 2 g L−1. GPC analysis was conducted using a Tosoh Ecosec HLC-8320GPC equipped with a Diode array detector. The column used was an Agilent PLgel 5 μm Mixed-D. The column flow rate was 1.0 mL min−1 at 35 °C. The GPC standards, which contained polystyrene ranging from 162 to 29![[thin space (1/6-em)]](https://www.rsc.org/images/entities/char_2009.gif) 150 g mol−1, were purchased from Agilent and used for calibration. For solids, they were derivatized using acetic acid and acetyl bromide (92
150 g mol−1, were purchased from Agilent and used for calibration. For solids, they were derivatized using acetic acid and acetyl bromide (92![[thin space (1/6-em)]](https://www.rsc.org/images/entities/char_2009.gif) :
:![[thin space (1/6-em)]](https://www.rsc.org/images/entities/char_2009.gif) 8, v/v) at 60 °C for 2 hours before analysis.
8, v/v) at 60 °C for 2 hours before analysis.
For NMR analysis of the liquid products, approximately 50 mg of liquid product dissolved in 0.6 mL of dimethylsulfoxide (DMSO)-d6. The homogeneous solutions were transferred to NMR tubes. 1H NMR and heteronuclear single-quantum coherence data (HSQC) were acquired using a Bruker Avance 600 MHz instrument equipped with a 5 mm inverse-gradient 1H/13C cryoprobe using a q_hsqcetgp pulse program with a 90° pulse, 0.11 s acquisition time, 2 s pulse delay, 48 scans, and acquisition of 1024 data points (for 1H) and 256 increments (for 13C). The solid residues obtained after depolymerization reaction were analyzed by FT-IR spectroscopy. FT-IR measurements were conducted using a Bruker VERTEX 70 FTIR. For each sample, 32 scans were accumulated between 4000 and 700 cm−1.
3. Results and discussion
Solid residues were recovered from IL conversion process of switchgrass and compositions were analyzed. As shown in Table 1, the lignin content was about 58 wt% and carbohydrates content was about 21 wt% in the recovered residual solid. Considering the amount of lignin in the feedstock used (26.7 wt%) and the recovery yield of residual solid (37.2%) after IL conversion process, approximately 80% of lignin was recovered. The lignin-enriched solid residue was depolymerized at 300 °C with IPA to produce low molecular weight products (Fig. 1).The mass yields of reaction products (liquid, solid and gas) from the depolymerization reaction are shown in Fig. 2. When the lignin was depolymerized for 1 h in the absence of catalyst, the average yield of liquid was 53.3 wt%. In the presence of Ru/C, however, the liquid yield increased to 58.6 wt%. The yield of products in the lignin fraction further increased to 65.5 wt% when the reaction time prolonged to 3 h. Interestingly, the yield of solid char, defined here as the insoluble fraction in IPA and acetone, was observed to be significantly reduced as reaction times increased. For example, the char yield was 39.0 wt% at 1 h reaction time, which decreased to 26.4 wt% when the reaction time increased to 3 h. It is believed that the conversion of lignin was enhanced by suppressing repolymerization at longer reaction times, and thus reducing char formation and increasing the yield of liquid and gaseous products.
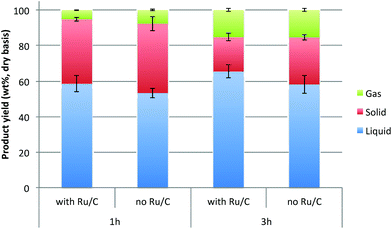 | ||
| Fig. 2 The distribution of reaction products after reaction of lignin-enriched IL pretreatment residue in IPA at 300 °C at different reaction conditions (gas yield was measured by difference). | ||
The reduction of solid char yield was more dramatic in the presence of catalyst. When depolymerized for 3 h, the char yield decreased to 19.2 wt%, which is ∼50% reduction as compared to the result from 1 h run without catalyst. When the reaction time was fixed, the liquid yield was higher and the char yield was lower in the presence of catalyst. This elucidates that the liquid-phase transfer hydrogenolysis reaction with IPA is facilitated in the presence of transition metal catalyst.29 Ru has been reported as the best metallic catalyst for catalytic transfer hydrogenolysis of biomass and its components.31–33 Although IPA itself is a hydrogen-donor agent, its hydrogen-donating capability is significantly enhanced with the assistance of catalyst considering the relatively small amount of catalyst used in this work (0.5 wt% based on initial material).
As shown in Fig. 3, in terms of the composition of gases collected after reaction the amount of hydrogen is higher when the catalyst is present. This indicates that Ru promoted hydrogen release from IPA, resulting in the higher reaction rate of hydrogenolysis of lignin. In addition to hydrogen, methane, carbon monoxide and carbon dioxide were the other gas products observed from the depolymerization reaction. These gases are hypothesized to be produced through cracking of lignin side chains or functional groups present such as methoxyl, carbonyl and carboxylic groups, although these gases could also arise from the cracking of functional groups present in the residual polysaccharides present.34
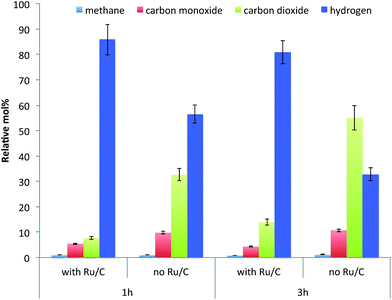 | ||
| Fig. 3 The composition of non-condensable gases after reaction of lignin-enriched IL pretreatment residue in IPA at 300 °C at different reaction conditions. | ||
GC/MS was used to identify and quantify the chemical composition of the liquid products (Fig. 4) after depolymerization, and the yields of the main compounds are listed in Table 2. As expected, phenolics are the primary compounds observed, with monomeric phenols making up more than 80% of the identified compounds. The yields of total monomeric phenolics increased as a function of reaction time, regardless of the presence of catalyst. Among the phenolic compounds, 4-ethylphenol, 4-ethyl-2-methoxyphenol, 2-methoxy-4-propylphenol and 2,6-dimethoxy-4-propylphenol are the main products, and their yields significantly increased as a function of reaction time and in the presence of Ru/C. These alkylphenols are the result of the hydrogenation or stabilization of the primary products.24 Alkylphenols can be used as building block chemicals in making phenol derivatives.35 The yield of lignin products increased to 22.4 wt% in the liquid phase when the reaction was carried out for 3 h in the presence of Ru/C, which is 37.3% higher than the yield from 1 h reaction without catalyst. Detailed analysis of the GC-MS spectra reveal that the presence of reactive functionalities, such as vinyl groups, significantly reduced with increasing reaction time due to hydrogenation. Vinyl phenols are the major and primary phenolic compounds present in the thermochemical depolymerization of lignin and are stabilized to alkyl-substituted phenols.24 In addition to the lignin derivatives, carbohydrate derivatives were also influenced by reaction time. With increased reaction time, the total yield of carbohydrate derivatives increased from 2.3 to 3.7 wt%, which is mainly attributed to the increase in tetrahydro-2-furanmethanol, resulting from the hydrogenation of 2-furanmethanol. This compound was produced more significantly in the presence of catalyst as shown in Table 2. Overall, the GC detectable monomers increased to 27 wt% with increasing reaction time over the range investigated, especially when reacted with Ru/C.
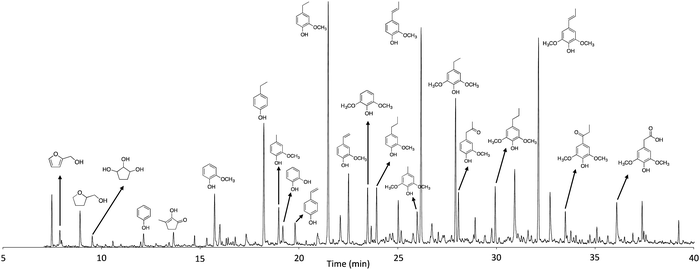 | ||
| Fig. 4 GC-MS spectrum of products in the liquid phase (sample obtained from the reaction at 300 °C for 3 h with Ru/C). | ||
| Compounds | 300 °C for 1 h | 300 °C for 3 h | |||
|---|---|---|---|---|---|
| Ru/C | — | Ru/C | — | ||
| C1 | 2-Furanmethanol | 0.66 ± 0.01 | 0.45 ± 0.06 | 0.82 ± 0.06 | 0.96 ± 0.12 |
| C2 | Tetrahydro-2-furanmethanol | 1.47 ± 0.05 | 0.78 ± 0.04 | 2.90 ± 0.60 | 1.84 ± 0.29 |
| C3 | 1,2,3-Cyclopentanetriol | 0.52 ± 0.01 | 0.24 ± 0.02 | 0.14 ± 0.07 | 0.00 ± 0.00 |
| C4 | 2-Hydroxy-3-methyl-2-cyclopenten-1-one | 0.58 ± 0.04 | 0.82 ± 0.08 | 0.69 ± 0.03 | 0.85 ± 0.11 |
| Carbohydrates derivatives total | 3.23 ± 0.03 | 2.30 ± 0.08 | 4.56 ± 0.69 | 3.65 ± 0.51 | |
| L1 | Phenol | 0.19 ± 0.01 | 0.20 ± 0.02 | 0.29 ± 0.04 | 0.38 ± 0.07 |
| L2 | 2-Methoxyphenol | 0.68 ± 0.08 | 0.82 ± 0.08 | 0.80 ± 0.07 | 1.21 ± 0.40 |
| L3 | 4-Ethylphenol | 1.18 ± 0.12 | 0.62 ± 0.04 | 1.72 ± 0.13 | 1.51 ± 0.14 |
| L4 | 2-Methoxy-4-methylphenol | 0.29 ± 0.03 | 0.27 ± 0.02 | 0.39 ± 0.02 | 0.35 ± 0.04 |
| L5 | Benzene-1,2-diol | 0.20 ± 0.04 | 0.07 ± 0.00 | 0.17 ± 0.01 | 0.16 ± 0.02 |
| L6 | 4-Vinylphenol | 0.26 ± 0.03 | 0.65 ± 0.02 | 0.00 ± 0.00 | 0.08 ± 0.00 |
| L7 | 3-Methoxybenzene-1,2-diol | 0.25 ± 0.01 | 0.29 ± 0.02 | 0.43 ± 0.02 | 0.49 ± 0.04 |
| L8 | 4-Ethyl-2-methoxyphenol | 2.17 ± 0.30 | 1.10 ± 0.08 | 2.98 ± 0.02 | 2.38 ± 0.23 |
| L9 | 2-Methoxy-4-vinylphenol | 0.69 ± 0.03 | 1.32 ± 0.06 | 0.10 ± 0.04 | 0.18 ± 0.01 |
| L10 | 2,6-Dimethoxyphenol | 0.70 ± 0.09 | 0.97 ± 0.05 | 0.89 ± 0.12 | 1.01 ± 0.06 |
| L11 | 4-Allyl-2-methoxyphenol | 0.23 ± 0.01 | 0.38 ± 0.02 | 0.20 ± 0.06 | 0.33 ± 0.03 |
| L12 | 2-Methoxy-4-propylphenol | 0.70 ± 0.16 | 0.15 ± 0.01 | 1.40 ± 0.07 | 0.63 ± 0.13 |
| L13 | 2-Methoxy-4-(1-prophenyl)phenol, cis | 0.56 ± 0.06 | 0.30 ± 0.01 | 0.48 ± 0.03 | 0.30 ± 0.03 |
| L14 | 2,6-Dimethoxy-4-methylphenol | 0.32 ± 0.04 | 0.31 ± 0.02 | 0.46 ± 0.05 | 0.45 ± 0.01 |
| L15 | 2-Methoxy-4-(1-prophenyl)phenol, trans | 3.08 ± 0.33 | 2.19 ± 0.11 | 2.52 ± 0.15 | 1.64 ± 0.14 |
| L16 | 4-Ethyl-2,6-dimethoxyphenol | 1.08 ± 0.19 | 0.53 ± 0.02 | 1.48 ± 0.07 | 0.87 ± 0.00 |
| L17 | 1-(4-Hydroxy-3-methoxyphenyl)propan-2-one | 0.67 ± 0.10 | 0.86 ± 0.04 | 0.65 ± 0.10 | 0.71 ± 0.04 |
| L18 | 2,6-Dimethoxy-4-vinylphenol | 0.23 ± 0.02 | 0.49 ± 0.00 | 0.00 ± 0.00 | 0.08 ± 0.02 |
| L19 | 4-Allyl-2,6-dimethoxyphenol | 0.28 ± 0.00 | 0.57 ± 0.03 | 0.25 ± 0.12 | 0.44 ± 0.07 |
| L20 | 2,6-Dimethoxy-4-propylphenol | 0.67 ± 0.15 | 0.25 ± 0.01 | 1.68 ± 0.02 | 0.93 ± 0.15 |
| L21 | 2,6-Dimethoxy-4-(1-propenyl)phenol, cis | 1.38 ± 0.13 | 0.77 ± 0.08 | 1.95 ± 0.18 | 1.13 ± 0.18 |
| L22 | 2,6-Dimethoxy-4-(1-propenyl)phenol, trans | 2.88 ± 0.31 | 2.41 ± 0.13 | 2.44 ± 0.22 | 1.59 ± 0.07 |
| L23 | 1-(4-Hydroxy-3,5-dimethoxyphenyl)propan-1-one | 0.45 ± 0.05 | 0.62 ± 0.01 | 0.43 ± 0.08 | 0.52 ± 0.04 |
| L24 | 1-(4-Hydroxy-3,5-dimethoxyphenyl) acetic acid | 0.49 ± 0.09 | 0.19 ± 0.01 | 0.72 ± 0.01 | 0.24 ± 0.02 |
| Lignin derivatives total | 19.61 ± 2.28 | 16.34 ± 0.85 | 22.43 ± 1.33 | 17.62 ± 1.44 | |
| Total | 22.84 ± 2.25 | 18.64 ± 0.93 | 26.99 ± 0.67 | 21.28 ± 1.94 | |
As GC-MS analysis of the liquid provides limited information on chemical composition due to the low volatility of large molecular weight phenolics, GPC was also used to investigate the molecular weight distribution of the products. Fig. 5 shows the GPC spectra of the raw material, liquid products and solid residue after reactions. As shown in Fig. 5(a), the liquid products have much lower molecular weight (MW) than the raw material. The average MW of the initial material was approximately 5700 Da. Interestingly, the molecular weight distribution curves of liquids products showed very similar peak shapes with distinct peaks observed at 190 and 400 Da, with an overall molecular weight distribution between 150 and 1500 Da. The average MW of the liquid was about 380 Da in all cases. Considering the molar mass of phenolic monomers is 100–200 Da, the liquids mainly consist of di-, tri-, and tetra-mers. The analysis of the products in the solid fraction revealed a significant decrease in molecular mass relative to the initial material, especially at longer reaction times and with Ru/C (Fig. 5(b)). This is mainly attributed to the continued hydrogenolysis reaction that cracks the lignin macromolecules to low MW products. Combining GPC spectra of both liquid and solid products, it was found that catalytic transfer hydrogenolysis of the lignin-enriched residue stream was effective at depolymerization to produce small MW products.
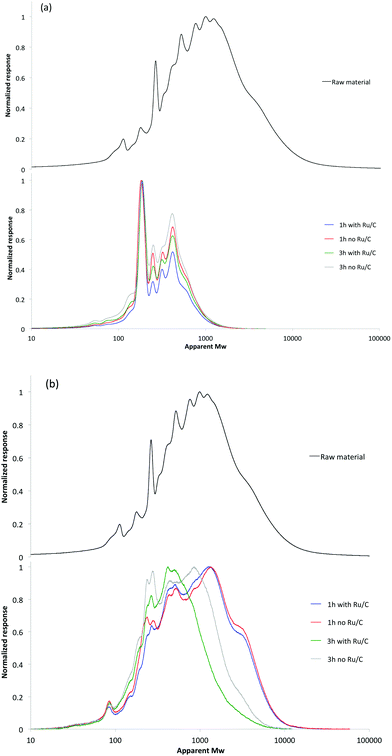 | ||
| Fig. 5 The molecular weight distribution of products present in the (a) liquid and (b) solid fractions after deploymerization with and without Ru/C. | ||
1H-NMR was used to gain insight into the differences in the molecular composition of the products in the liquid fraction (Table 3). The selected regions in 1H-NMR spectra are assigned to specific functional groups and the relative amount of these groups is measured based on peak integrations.36,37 Protons with chemical shifts from 8.0 to 6.8 ppm, a region that includes vinyl protons on Cβ and aromatic protons, were substantially reduced at longer reaction times. The decrease in this region was more significant in the presence of Ru/C. As expected, catalytic transfer hydrogenolysis effectively reduced lignin fragments and produced more aliphatics. The ratio of the aliphatics to aromatics present increased from 3.5 to 5.9 when the reaction time increased to 3 h in the presence of catalyst.
| Chemical shift region (ppm) | Type of protons | 300 °C for 1 h | 300 °C for 3 h | ||
|---|---|---|---|---|---|
| Ru/C | — | Ru/C | — | ||
| a Ratio of the area % at 2.2–0.02 ppm and 8.0–6.4 ppm. | |||||
| 10.00–8.00 | –CHO, –COOH, downfield ArH | 0.2 | 0.1 | 0.2 | 0.2 |
| 8.00–6.80 | ArH, HC![[double bond, length as m-dash]](https://www.rsc.org/images/entities/char_e001.gif) C (conjugated) C (conjugated) |
4.8 | 6.0 | 2.6 | 3.4 |
| 6.80–6.40 | HC![[double bond, length as m-dash]](https://www.rsc.org/images/entities/char_e001.gif) C (nonconjugated) C (nonconjugated) |
5.8 | 4.9 | 6.1 | 5.6 |
| 6.40–4.20 | –CHn–O–, ArOH, HC![[double bond, length as m-dash]](https://www.rsc.org/images/entities/char_e001.gif) C C |
5.5 | 10.5 | 4.7 | 6.0 |
| 4.20–3.00 | CH3O–, –CH2O–, –CHO– | 28.6 | 28.4 | 23.7 | 22.8 |
| 3.00–2.20 | CH3C(![[double bond, length as m-dash]](https://www.rsc.org/images/entities/char_e001.gif) O)–, CH3–Ar, –CH2Ar O)–, CH3–Ar, –CH2Ar |
10.3 | 11.6 | 11.5 | 14.6 |
| 2.20–1.60 | –CH2–, aliphatic OH | 9.1 | 10.4 | 10.8 | 12.3 |
| 1.60–0.02 | –CH3, –CH2– | 35.7 | 27.9 | 40.3 | 35.1 |
| Aliphatic/aromatica | 4.2 | 3.5 | 5.9 | 5.3 | |
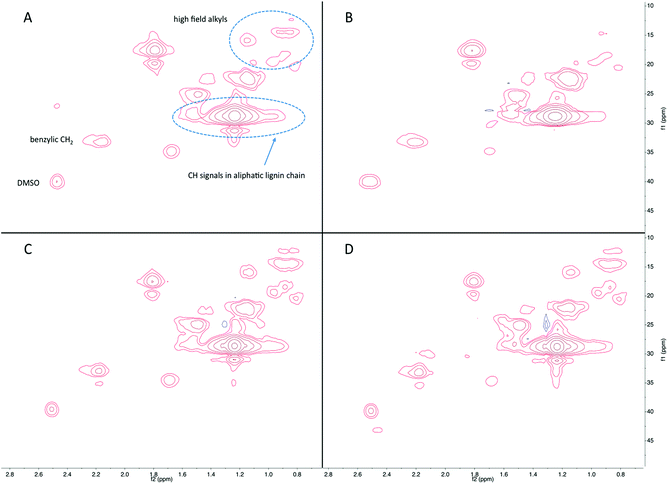
In addition to 1H NMR analysis, HSQC-NMR was used to fully characterize the functional groups in the liquid products. The spectra are divided into three regions: an aromatic region between 140–90/8.0–7.5 ppm, a side chain region between 110–50/5.5–2.5 ppm, and an alkyl region between 50–5/3.0–0.5 ppm. Fig. 6–8 show spectra for the alkyl, aromatic and side chain regions, respectively. As shown in Fig. 6(A), products in the liquid fraction produced from hydrogenolysis exhibit a significant number of peaks in the alkyl region. Peaks observed at 20–13/1.2–0.8 ppm are assigned to aliphatic methyl and methylene groups in the alkyls on the phenolic compounds, and several spectra reveal the presence of a series of well-resolved methyl groups at 21–11/0.9 ppm.38 Peaks observed at 33/2.2 ppm are likely benzylic CH2 groups. Alkyl peaks increased with increasing reaction time to 3 h and in the presence of catalyst (Fig. 6(C) and (D)). These results are in agreement with those obtained by GC-MS in terms of the levels of alkylphenols produced such as 4-ethylphenol, 4-ethyl-2-methoxyphenol, and 2-methoxy-4-propylphenol, increase as a function of reaction time by stabilization of the products when reacted with IPA.
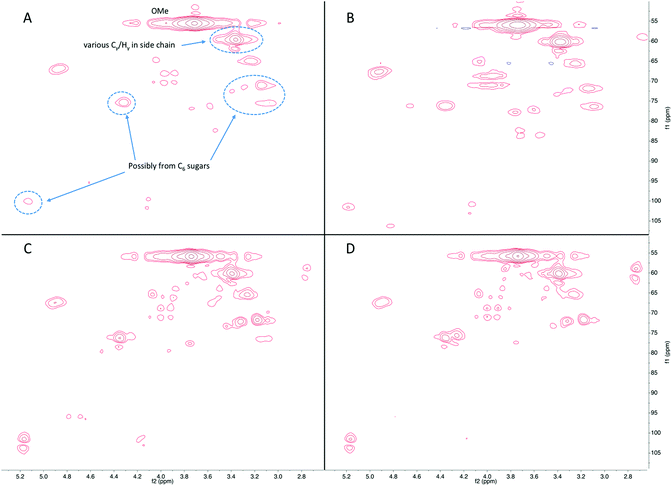
Fig. 7 shows the HSQC-NMR results from the side chain region of products in the liquid fraction. The peaks at 55/4.2–3.5 ppm are from the aromatic methoxyl groups. Peaks corresponding to the various Cγ/Hγ in the side chains were observed at 60/3.6–3.3 ppm. Interestingly, several peaks can be assigned to carbohydrates or carbohydrate derived products, such as those observed at 75–70/3.5–3.1, 75/4.4, and 103/5.2 ppm. The intensity of these signals increased as a function of reaction time, which implies that remaining carbohydrates are depolymerized to monomeric sugars or light oxygenates. Some light oxygenates, such as furans, are detectable by GC-MS whereas monomeric sugars are not detectable due to their non-volatility. The HSQC-NMR analysis elucidated the presence of sugars, which is likely to be sorbitol as it has been reported as a main product of hydrogenolysis of cellulose.39 As discussed above, hydrogenolysis continued at longer reaction time, thus resulting in higher amount of carbohydrate derivatives in addition to the phenolics and is consistent with the data obtained from GC-MS.
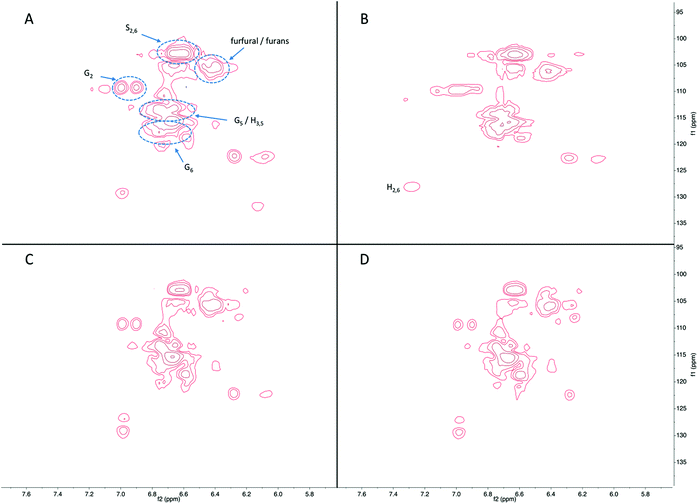
Fig. 8 shows the aromatic region in the HSQC-NMR spectra, with distinctive signals for C2,6 in syringyl unit (S-unit) at 103/6.7 ppm. Signals at 128/7.2 ppm are from C2,6 in p-hydroxycinammyl unit (H-unit), and those at 110/6.9, 115/6.7, and 118/6.7 ppm are consistent with the C2, C5, and C6 positions of guaiacyl unit (G-unit). The shape of the signals was very similar between the products in the liquid fraction for all reaction conditions studied, with minor changes in phenolic subunits. Specifically, some signals assigned to S-unit decreased and signals assigned to G-unit increased at longer reaction time, indicating demethoxylation occurred during continued hydrogenolysis reaction. Besides phenolics, the signals from furan compounds significantly increased as a function of reaction time, again in agreement with the GC-MS results.
Taken together, the in-depth analysis of the liquid products clearly indicates that lignin stream can be effectively depolymerized to low molecular weight compounds with high selectivity of stable monomeric phenols, which is described in Scheme 1. Transfer hydrogenolysis using IPA as hydrogen donor and supported Ru catalyst results in the selective depolymerization and conversion of lignin to alkylphenols.
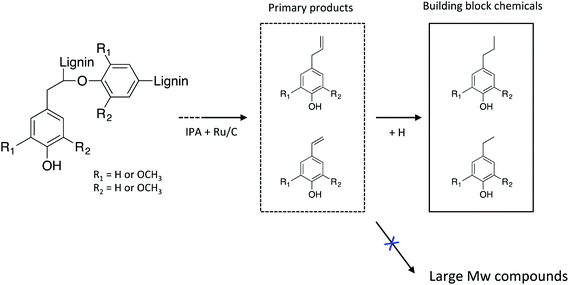 | ||
| Scheme 1 Catalytic transfer hydrogenolysis of lignin-rich residue obtained from an IL process to low molecular weight phenolic products. | ||
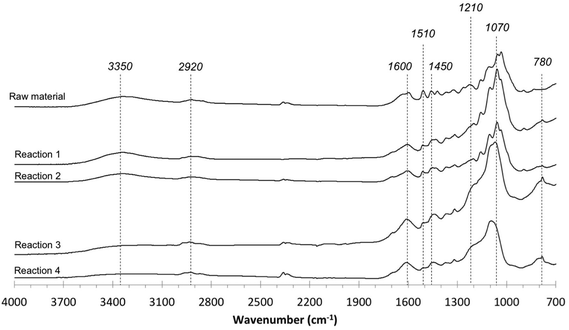
Lastly, the IR spectra of the initial lignin and the products obtained in the solid fraction after depolymerization are presented in Fig. 9. The IR spectrum of the initial material differs from that of solid residues. The appearance of peaks at 3500–3300 and 2920 cm−1 in spectra is due to the stretching of –OH, and –CHn bonds, respectively. The peaks at 1600, 1510 and 1450 cm−1 were assigned as the vibrations of the benzene structures in lignin. The decreased absorbances around 3400 cm−1 from the products in the solid fraction are attributed to reduced hydroxyl groups, and these decreases are observed to increase at longer reaction times. The increased absorbances at 2920, 1450 and 780 cm−1 are associated with C–H stretching vibrations of methyl and methylene, indicating the presence of alkane groups in the products in the solid fraction.40 The increases in absorbances at 1600 and 1510 cm−1 are attributed to aromatic nuclei and indicate that the aromatic rings present form highly organized aromatic residues. Additionally, the decreasing absorbance around 1070 cm−1 implies the breakage of ether bonds in the lignin-enriched residue.
4. Conclusions
Catalytic transfer hydrogenolysis of the lignin-rich residue obtained from an IL process was performed to track the production of low molecular weight phenolic products on the liquid and solid fractions. The yield of low molecular weight products in the liquid fraction was 65.5 wt% with IPA as the hydrogen-donor agent in the presence of Ru/C. The hydrogenolysis reaction was significantly promoted in the presence of Ru/C and the products in the liquid fraction increased by 12%. Compositional analysis of the products in the liquid fraction indicates that yields of monomeric phenols and carbohydrate-derived furans significantly increased to 27 wt% at longer reaction times. Catalytic transfer hydrogenolysis was found to effectively depolymerize lignin-rich residue, producing alkyl-substituted phenolic compounds that are a more stable form of phenols. NMR analysis of the liquid fraction also confirmed the substantial amount of alkylated products. The molecular weight distributions of products in the liquid fraction indicate that significant depolymerization of lignin-rich material to low molecular weight products occurs. Hydrogenolysis of biorefinery lignin presents a promising and needed approach for atom-economical conversion of lignocellulose into valuable products that can be used directly as finished products or as platform chemicals for further upgrading.Acknowledgements
This work was conducted by the DOE Joint BioEnergy Institute (http://www.jbei.org) and supported by the U.S. Department of Energy, Office of Science, Office of Biological and Environmental Research, through contract DE-AC02-05CH11231 between Lawrence Berkeley National Laboratory and the U.S. Department of Energy. The United States Government retains and the publisher, by accepting the article for publication, acknowledges that the United States Government retains a non-exclusive, paid-up, irrevocable, world-wide license to publish or reproduce the published form of this manuscript, or allow others to do so, for United States Government purposes.References
- G. T. Beckham, C. W. Johnson, E. M. Karp, D. Salvachúa and D. R. Vardon, Curr. Opin. Biotechnol., 2016, 42, 40–53 CrossRef CAS PubMed.
- A. T. W. M. Hendriks and G. Zeeman, Bioresour. Technol., 2009, 100, 10–18 CrossRef CAS PubMed.
- A. Effendi, H. Gerhauser and A. V. Bridgwater, Renewable Sustainable Energy Rev., 2008, 12, 2092–2116 CrossRef CAS.
- M. P. Pandey and C. S. Kim, Chem. Eng. Technol., 2011, 34, 29–41 CrossRef CAS.
- R. Katahira, A. Mittal, K. McKinney, X. W. Chen, M. P. Tucker, D. K. Johnson and G. T. Beckham, ACS Sustainable Chem. Eng., 2016, 4, 1474–1486 CrossRef CAS.
- C. P. Xu, R. A. D. Arancon, J. Labidi and R. Luque, Chem. Soc. Rev., 2014, 43, 7485–7500 RSC.
- A. J. Ragauskas, G. T. Beckham, M. J. Biddy, R. Chandra, F. Chen, M. F. Davis, B. H. Davison, R. A. Dixon, P. Gilna, M. Keller, P. Langan, A. K. Naskar, J. N. Saddler, T. J. Tschaplinski, G. A. Tuskan and C. E. Wyman, Science, 2014, 344, 1246843 CrossRef PubMed.
- G. Chatel and R. D. Rogers, ACS Sustainable Chem. Eng., 2014, 2, 322–339 CrossRef CAS.
- T. Dutta, J. Shi, J. Sun, X. Zhang, G. Cheng, B. Simmons and S. Singh, in Ionic Liquids in the Biorefinery Concept: Challenges and Perspectives, RSC, 2015, p. 65 Search PubMed.
- H. Zhao, C. L. Jones, G. A. Baker, S. Xia, O. Olubajo and V. N. Person, J. Biotechnol., 2009, 139, 47–54 CrossRef CAS PubMed.
- A. P. Dadi, S. Varanasi and C. A. Schall, Biotechnol. Bioeng., 2006, 95, 904–910 CrossRef CAS PubMed.
- S. Singh, B. A. Simmons and K. P. Vogel, Biotechnol. Bioeng., 2009, 104, 68–75 CrossRef CAS PubMed.
- N. Sun, R. Parthasarathi, A. M. Socha, J. Shi, S. Zhang, V. Stavila, K. L. Sale, B. A. Simmons and S. Singh, Green Chem., 2014, 16, 2546–2557 RSC.
- X. D. Hou, N. Li and M. H. Zong, Bioresour. Technol., 2013, 136, 469–474 CrossRef CAS PubMed.
- F. Xu, J. Sun, N. V. S. N. M. Konda, J. Shi, T. Dutta, C. D. Scown, B. A. Simmons and S. Singh, Energy Environ. Sci., 2016, 9, 1042–1049 CAS.
- C. J. Dong, C. G. Feng, Q. Liu, D. K. Shen and R. Xiao, Bioresour. Technol., 2014, 162, 136–141 CrossRef CAS PubMed.
- A. Kloekhorst, Y. Shen, Y. Yie, M. Fang and H. J. Heeres, Biomass Bioenergy, 2015, 80, 147–161 CrossRef CAS.
- V. M. Roberts, V. Stein, T. Reiner, A. Lemonidou, X. B. Li and J. A. Lercher, Chem. – Eur. J., 2011, 17, 5939–5948 CrossRef CAS PubMed.
- A. Toledano, L. Serrano and J. Labidi, Fuel, 2014, 116, 617–624 CrossRef CAS.
- S. K. Singh, K. Nandeshwar and J. D. Ekhe, New J. Chem., 2016, 40, 3677–3685 RSC.
- J. Y. Kim, S. Oh, H. Hwang, T. S. Cho, I. G. Choi and J. W. Choi, Chemosphere, 2013, 93, 1755–1764 CrossRef CAS PubMed.
- J. Hu, D. K. Shen, S. L. Wu, H. Y. Zhang and R. Xiao, Energy Fuels, 2014, 28, 4260–4266 CrossRef CAS.
- J. Y. Kim, J. Park, U. J. Kim and J. W. Choi, Energy Fuels, 2015, 29, 5154–5163 CrossRef CAS.
- K. H. Kim, R. C. Brown, M. Kieffer and X. L. Bai, Energy Fuels, 2014, 28, 6429–6437 CrossRef CAS.
- G. Zassinovich, G. Mestroni and S. Gladiali, Chem. Rev., 1992, 92, 1051–1069 CrossRef CAS.
- A. Toledano, L. Serrano, J. Labidi, A. Pineda, A. M. Balu and R. Luque, ChemCatChem, 2013, 5, 977–985 CrossRef CAS.
- P. Varanasi, P. Singh, M. Auer, P. D. Adams, B. A. Simmons and S. Singh, Biotechnol. Biofuels, 2013, 6, 14 CrossRef CAS PubMed.
- G. Sarath, R. B. Mitchell, S. E. Sattler, D. Funnell, J. F. Pedersen, R. A. Graybosch and K. P. Vogel, J. Ind. Microbiol. Biotechnol., 2008, 35, 343–354 CrossRef CAS PubMed.
- R. A. W. Johnstone, A. H. Wilby and I. D. Entwistle, Chem. Rev., 1985, 85, 129–170 CrossRef CAS.
- A. Sluiter, B. Hames, R. Ruiz, C. Scarlata, J. Sluiter, D. Templeton and D. Crocker, Determination of structural carbohydrates and lignin in biomass - Laboratory Analytical Procedure (LAP), National Renewable Energy Laboratory, 2008 Search PubMed.
- M. Kim, J.-M. Ha, K.-Y. Lee and J. Jae, Catal. Commun., 2016, 86, 113–118 CrossRef CAS.
- J. Jae, W. Q. Zheng, A. M. Karim, W. Guo, R. F. Lobo and D. G. Vlachos, ChemCatChem, 2014, 6, 848–856 CrossRef CAS.
- P. Panagiotopoulou and D. G. Vlachos, Appl. Catal., A, 2014, 480, 17–24 CrossRef CAS.
- H. Yang, R. Yan, H. Chen, D. H. Lee and C. Zheng, Fuel, 2007, 86, 1781–1788 CrossRef CAS.
- J. E. Holladay, J. F. White, J. J. Bozell and D. Johnson, Top Value-Added Chemicals from Biomass-Volume II—Results of Screening for Potential Candidates from Biorefinery Lignin, Pacific Northwest National Laboratory (PNNL), Richland, WA (US), 2007 Search PubMed.
- L. Ingram, D. Mohan, M. Bricka, P. Steele, D. Strobel, D. Crocker, B. Mitchell, J. Mohammad, K. Cantrell and C. U. Pittman, Energy Fuels, 2008, 22, 614–625 CrossRef CAS.
- J. Wildschut, M. Iqbal, F. H. Mahfud, I. Melian-Cabrera, R. H. Venderbosch and H. J. Heeres, Energy Environ. Sci., 2010, 3, 962–970 CAS.
- J. J. Bozell, C. J. O'Lenick and S. Warwick, J. Agric. Food Chem., 2011, 59, 9232–9242 CrossRef CAS PubMed.
- R. Palkovits, K. Tajvidi, J. Procelewska, R. Rinaldi and A. Ruppert, Green Chem., 2010, 12, 972–978 RSC.
- Y. Y. Ye, Y. Zhang, J. Fan and J. Chang, Ind. Eng. Chem. Res., 2012, 51, 103–110 CrossRef CAS.
| This journal is © The Royal Society of Chemistry 2017 |


