 Open Access Article
Creative Commons Attribution 3.0 Unported Licence
The effects of contact time and coking on the catalytic fast pyrolysis of cellulose†
Haiping
Yang
ab,
Robert
Coolman
b,
Pranav
Karanjkar
b,
Haoyi
Wang
b,
Paul
Dornath
c,
Hanping
Chen
a,
Wei
Fan
c,
William Curtis
Conner
c,
T. J.
Mountziaris
c and
George
Huber
*b
aState Key Laboratory of Coal Combustion, Huazhong University of Science and Technology, Wuhan, 430074, China
bDept. of Chemical and Biological Engineering, University of Wisconsin-Madison, Madison, WI 53706, USA. E-mail: gwhuber@wisc.edu
cDept. of Chemical and Biological Engineering, University of Massachusetts-Amherst, Amherst, MA 01003, USA
First published on 21st November 2016
Abstract
The effects of catalyst contact time (WHSV−1) and coking on catalytic fast pyrolysis of cellulose with ZSM-5 were studied in a bubbling fluidized bed reactor. Because coke interferes with catalyst activity, the effect of catalyst contact time was studied at coke loadings known not to deactivate the catalyst. CO and CH4 are favored at low catalyst contact times (<1000 s), oxygenated and unidentified species at medium catalyst contact times (1000 s–10![[thin space (1/6-em)]](https://www.rsc.org/images/entities/char_2009.gif) 000 s), and aromatics and CO2 at high catalyst contact times (>10
000 s), and aromatics and CO2 at high catalyst contact times (>10![[thin space (1/6-em)]](https://www.rsc.org/images/entities/char_2009.gif) 000 s). At increased time on stream, the catalyst lost activity due to coking. The majority aromatic-producing activity was lost after site turnovers of 95 (cellulose monomers to Brønsted sites) corresponding to a weight turnover of 2.0 (feed weight to catalyst weight). Accumulated coke deactivates the catalyst by both filling the micropores and blocking the acid sites.
000 s). At increased time on stream, the catalyst lost activity due to coking. The majority aromatic-producing activity was lost after site turnovers of 95 (cellulose monomers to Brønsted sites) corresponding to a weight turnover of 2.0 (feed weight to catalyst weight). Accumulated coke deactivates the catalyst by both filling the micropores and blocking the acid sites.
1. Introduction
Due to the low cost and abundance of lignocellulosic biomass,1 its use as a feedstock is critical for transforming atmospheric carbon back into fuels and chemicals. Catalytic fast pyrolysis (CFP) is one method of converting available lignocellulosic biomass into mono-cyclic aromatics – such as benzene, toluene, and xylene (BTX) – in a single thermocatalytic step.2–7 CFP is performed by feeding lignocellulosic biomass into a fluidized bed of spray-dried zeolite catalyst at medium high temperature. The biomass turns into pyrolysis vapors which, in the presence of the zeolite, reacts to form aromatics and olefins along with CO, CO2, H2O, and carbonaceous deposits consisting of char and coke. Several researchers have reported aromatic yields for CFP over ZSM-5 for various configurations and scales of fluidized beds.8–14 A table of reactor sizes, configurations, and aromatic yields is included in the ESI as Table A.1.†A number researchers have proposed that the first step in CFP is pyrolysis of biomass into oxygenates which can then diffuse into zeolite pores to form hydrocarbons.2,15–17 Cheng et al. used furan as a model compound to show that at medium high temperatures (>400 °C), furan underwent series of reactions to produce aromatics and olefins. At room temperature furan formed furan oligomers inside the ZSM5. These oligomers then decomposed into aromatics, CO, CO2, olefins and coke upon subsequent heating.18
While previous work has examined the effects of catalyst contact time (as the inverse of WHSV) on product yield, these comparisons were performed at constant time-on-stream and across the same mass of catalyst bed.2,5,13,18 Unfortunately this data is of limited value because the catalyst accumulates coke and char during the reaction and thereby decreases in activity. The main objective of this work is to compare product yields across multiple orders of magnitude of catalyst contact time whilst maintaining constant catalyst activity by controlling for loadings of char and/or coke. This data will provide insights into the mechanism of CFP, similar to how scans of catalyst contact time (LHSV−1) for Mobil's Methanol-to-Gasoline (MTG) revealed that methanol is first converted into dimethyl ether which then is converted into olefins and aromatics (Fig. 1).19
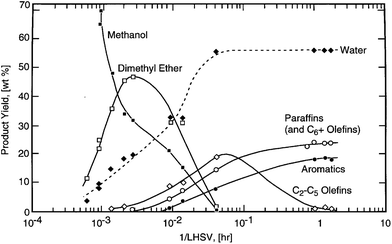 | ||
| Fig. 1 Scan of contact time for Mobil's Methanol-to-Gasoline (MTG) process spanning four orders-of-magnitude. (Reproduced from Stöcker19 by permission of Elsevier Science B.V., Amsterdam.) | ||
It has been reported that lignin primarily forms coke under CFP conditions.20 In contrast to previous studies by our group which used pinewood sawdust2,13 as a feed for CFP, in this study we use pure cellulose as the feedstock to isolate and study the production of aromatics and olefins.
We also investigated the effects that coking has on catalyst activity. With the aim of determining what loadings of char/coke render the catalyst inactive, we examined the effects of coke/char on product yield, acidity, and micro-/meso-porosity. These quantifications additionally provide insight into how much char/coke needs to combusted off the catalyst in order to regenerate it.
2. Experimental
2.1. Materials
Industrial grade cellulose with an average particle size of 200 μm (Lattice® NT Microcrystalline Cellulose, FMC biopolymer, 99%) was used as the feedstock for this study. In all our calculations, the empirical formula C6H10O5 was used for cellulose.The catalyst used in these experiments was a commercial spray-dried 40% ZSM-5 catalyst (Intercat Inc.) with a particle-size average of 99 μm and standard deviation of 23 μm. For each experiment 30–240 grams of fresh catalyst was loaded into the reactor, corresponding to roughly 5–40% of the total reactor volume. Prior to reaction, the catalyst was calcined in situ at 600 °C in air flowing at 600 sccm.
2.2. Definitions
In CFP, carbonaceous deposits form as either free bed particles or as a coating on the surface of catalyst particles. We draw a distinction between “char” which is produced from homogeneous slow pyrolysis and/or homogeneous deposition of pyrolysis vapors and “coke” which is produced from heterogeneous catalysis.13,21Weight hourly space velocity (WHSV), yield, and aromatic selectivity are defined in eqn (1)–(3):
 | (1) |
 | (2) |
 | (3) |
Weight turnover is defined as the ratio of the mass of cellulose fed to the catalyst bed divided by the catalyst mass in that bed (eqn (4)). Similarly, the site turnover is defined as the ratio of cellulose monomers fed to the catalyst bed divided by the initial number of Brønsted sites present in that bed (eqn (5)). Weight turnovers may be converted to site turnovers by multiplying by an experimentally-determined factor of 47.5.
 | (4) |
 | (5) |
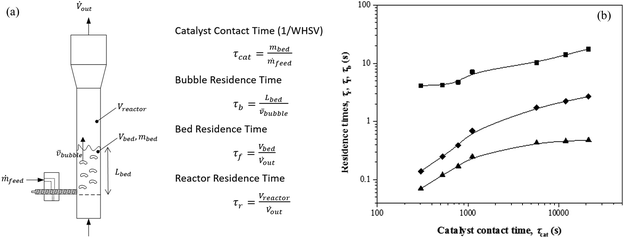
A variety of heterogeneous and homogeneous reactions simultaneously take place in the reactor and therefore it is necessary to account for the different residence times that occur in the reactor. The catalyst contact time (τcat) is defined as the weight of the catalyst bed divided by the feed rate of cellulose (eqn (6)). The catalyst contact time is also equal to the inverse of the space velocity (by weight). The duration of τcat is also the time it takes for the weight turnover to reach a value of 1 (or increase by 1). Bubble residence time (τb) is defined as the height of the fluidized bed divided by the average rate at which the bubbles ascend through the fluidized bed (bubble-rise velocity) (eqn (7)). The fluidized bed residence time (τf) is defined as the volume of the fluidized bed divided by the output volumetric flowrate (eqn (8)). Both of τb and τf are estimated by the Assemblage Model described by Karanjkar et al.12 Because the bed does not occupy the total volume of the reactor, it is also important to consider reactor residence time (τr), which is defined as the volume of the reactor (which includes both the fluidized bed and the headspace above it) divided by the output volumetric flow rate (eqn (9)). Output volumetric flow rate was determined using a bubble flow meter.
 | (6) |
 | (7) |
 | (8) |
 | (9) |
Table 1 and Fig. 2 show how changes in catalyst contact time (τcat) affect the other three residence times (τb, τf, τ). All four quantities increase together; albeit to different degrees depending on the value of τcat.
| Catalyst contact time (s) | 303 | 523 | 780 | 1116 | 5702 |
11![[thin space (1/6-em)]](https://www.rsc.org/images/entities/b_char_2009.gif) 952 952
|
21![[thin space (1/6-em)]](https://www.rsc.org/images/entities/b_char_2009.gif) 312 312
|
| WHSV (h −1 ) | 12.67 | 6.88 | 4.62 | 3.23 | 0.63 | 0.3 | 0.17 |
| Catalyst mass (g) | 32 | 60 | 90 | 120 | 240 | 240 | 240 |
| Time-on-stream (min) | 6.5 | 10 | 15 | 20 | 31 | 31 | 30 |
| Weight turnover | 1.29 | 1.15 | 1.15 | 1.08 | 0.33 | 0.16 | 0.08 |
| Outlet molar flow (sccm) | 7792 | 7594 | 6818 | 4511 | 3125 | 2294 | 1829 |
| Temperature (°C) | 512 ± 30 | 529 ± 19 | 520 ± 11 | 519 ± 7 | 526 ± 1.5 | 527 ± 2.6 | 529 ± 0.6 |
| Bubble res. time τb (s) | 0.07 | 0.12 | 0.17 | 0.25 | 0.43 | 0.46 | 0.48 |
| Bed res. time τf (s) | 0.14 | 0.25 | 0.39 | 0.69 | 1.72 | 2.22 | 2.69 |
| Reactor res. time τr (s) | 4.13 | 4.24 | 4.72 | 7.13 | 10.29 | 14.02 | 17.59 |
| CO | 40.5% | 34.7% | 31.2% | 29.6% | 24.3% | 23.5% | 21.5% |
| CO 2 | 2.2% | 2.2% | 2.6% | 2.7% | 3.4% | 4.3% | 4.9% |
| Char + coke | 15.5% | 8.1% | 5.7% | 5.7% | 5.2% | 12.7% | 13.2% |
| Methane | 8.2% | 5.6% | 3.8% | 3.5% | 3.1% | 3.0% | 3.4% |
| Aromatics | 10.8% | 12.8% | 16.2% | 18.7% | 23.3% | 25.8% | 26.6% |
| Benzene | 4.6% | 4.9% | 5.7% | 6.3% | 8.1% | 9.6% | 10.9% |
| Toluene | 2.3% | 3.8% | 5.6% | 6.8% | 8.1% | 8.6% | 8.2% |
| Xylenes | 0.5% | 0.4% | 1.5% | 1.8% | 2.1% | 2.1% | 1.9% |
| Naphthalenes | 1.9% | 1.6% | 1.7% | 2.0% | 3.4% | 3.8% | 3.8% |
| Ethyl benzene | 0.2% | 0.7% | 0.4% | 0.3% | 0.2% | 0.3% | 0.3% |
| Styrene | 0.6% | 0.6% | 0.6% | 0.6% | 0.6% | 0.5% | 0.5% |
| Indene | 0.8% | 0.8% | 0.8% | 0.9% | 1.0% | 1.0% | 0.9% |
| Olefins + aliphatics | 9.1% | 8.6% | 7.8% | 7.1% | 8.2% | 7.7% | 8.9% |
| C2 | 8.8% | 7.9% | 6.8% | 4.7% | 6.7% | 7.0% | 7.4% |
| C3 | 0.3% | 0.3% | 0.8% | 1.8% | 1.2% | 0.6% | 1.0% |
| C4 | 0.0% | 0.2% | 0.0% | 0.2% | 0.1% | 0.1% | 0.1% |
| C5 | 0.0% | 0.3% | 0.2% | 0.3% | 0.1% | 0.1% | 0.4% |
| Identified oxygenates | 2.1% | 3.7% | 6.6% | 6.6% | 1.7% | 1.0% | 1.2% |
| Benzofuran | 0.2% | 0.2% | 0.2% | 0.2% | 0.1% | 0.1% | 0.1% |
| Phenol | 0.5% | 0.7% | 0.8% | 0.8% | 0.4% | 0.3% | 0.2% |
| Hydroxyacetone | 0.0% | 0.0% | 0.0% | 0.0% | 0.0% | 0.0% | 0.0% |
| HMF | 0.3% | 0.2% | 0.2% | 0.1% | 0.2% | 0.4% | 0.5% |
| Acetaldehyde | 0.5% | 1.3% | 2.4% | 2.4% | 0.4% | 0.2% | 0.2% |
| Furan | 0.5% | 1.1% | 2.3% | 2.3% | 0.3% | 0.1% | 0.1% |
| 2-Methylfuran | 0.0% | 0.3% | 0.7% | 0.6% | 0.0% | 0.0% | 0.0% |
| Acetic acid | 0.0% | 0.0% | 0.1% | 0.2% | 0.2% | 0.0% | 0.0% |
| Unidentified carbon | 11.6% | 24.4% | 26.1% | 26.2% | 30.8% | 21.9% | 20.3% |
2.3. Reactor setup
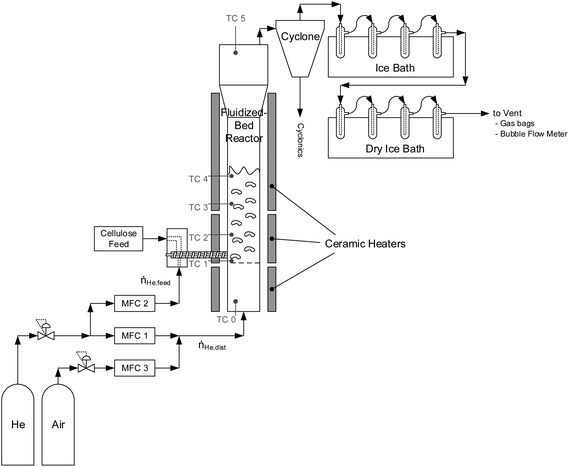
CFP of cellulose was performed in a fluidized-bed reactor system, as shown in Fig. 3. The fluidized bed reactor is a 316L stainless-steel 4.92 cm ID pipe with a freeboard height of 37 cm. Above the freeboard is a disengaging zone which expands to a 7.79 cm ID pipe. The catalyst bed is supported by a distributor plate made from two layers of 304 stainless-steel cloth (200 mesh) glued to a stainless-steel screen for support. The main reactor body and space beneath the distributor plate (henceforth referred to as the plenum) were sealed together using bolted flanges with a graphite gasket. The interior of the reactor and the plenum were spray-coated with a protective layer of abrasion-resistant ceramic to protect the reactor from corrosion. The reactor and plenum were resistively heated to a target temperature of 500 °C using semi-circular ceramic heaters (WATLOW). The flanges joining the main reactor body and plenum were heated using a band heater. Heating-zone temperatures were controlled by thermocouples located between the reactor body and heaters.A typical reaction was carried out over a duration of 1 to 30 min time-on-stream. The catalyst was fluidized using helium at a rate of 600 sccm (henceforth referred to as the fluidizer gas). Heating of the plenum allowed for pre-heating of the fluidizer gas to the reaction temperature before reaching the catalyst.
A stainless-steel auger equipped with a variable speed motor and rotary fitting fed cellulose into the reactor from the side. Cellulose was supplied to this auger via a sealed feed hopper (calibrated prior via balance and stopwatch). Cellulose is not stable at 500 °C, so in all cases, the conversion of cellulose into product compounds (both desired and undesired) was complete. To maintain an inert environment and encourage the rapid delivery of biomass to the reactor, the hopper and augur were swept with helium at a rate of 400 sccm (henceforth referred to as the feeding gas). Gas flows were selected to operate the reactor in the bubbling fluidized-bed regime. During the reaction, product gases exited the top of the reactor and were passed through a cyclone where entrained solids were removed as cyclonics (<1 g per reaction). The solid-free vapors were then bubbled through four condensers each containing ∼20 mL isopropanol maintained at 0 °C using an ice bath. Here, most organic species were captured through dissolution in isopropanol. The stream was then passed through four condensers maintained at −78 °C using a dry-ice/acetone bath to condense residual organics. The non-condensable gases were then either vented, plumbed through a bubble flow meter, or sampled in Tedlar gas bags (Restek) for GC analysis. At the conclusion of cellulose feeding, the reactor was purged with 1000 sccm of helium for another 30 min to ensure a complete purge of all volatile organic products. The condensers were then removed and rinsed with isopropanol to collect all liquid products. The volume of isopropanol/product solution was recorded and analyzed via GC to quantify products.
After feeding and purge, the reactor was cooled down, a small amount of catalyst was taken out of reactor for characterization, the reactor temperature was increased to 600 °C, and the carrier gas was switched to air to combust char and coke on the catalyst. The catalyst was typically exposed to air for approximately two hours to ensure combustion of all organic species remaining in the reactor.
2.4. Product analysis
During catalyst combustion, the combustion effluent containing CO, CO2, and water was passed through a copper catalyst (13 wt% CuO on alumina, Sigma Aldrich) held at 250 °C to convert CO to CO2. This stream was then passed through a Dryrite trap to remove water followed by a pre-weighed Ascarite trap to capture CO2 by absorption. Weights of the Ascarite trap before and after catalyst combustion were used to determine the quantity of char and coke generated from the reaction. Because this analysis does not distinguish between char and coke, yields calculated using this method are indicated under the name “char + coke”.The liquid product dissolved in isopropanol was analyzed for aromatics using a Shimadzu GC2010 gas chromatograph with an Agilent HP INNOWax column (60 m, 0.32 mm, 0.5 μm) and a flame ionization detector (FID). Column max temperature: 260 °C. Carrier gas: He. Injection mode: split ratio of 10. Temperature program: initial temperature 70 °C, hold time 10 min, then heat up to 95 °C at 2 °C min−1, then heat up to 240 °C at 15 °C and hold for 10 min.
The liquid products were also analyzed using a high-performance liquid chromatograph (HPLC; Shimadzu, LC-20AT) equipped with an RI (RID-10A) detector. Separation was achieved using a Biorad Aminex HPX-87H column at 303 K with 5 mM H2SO4 as the mobile phase flowing at a rate of 0.6 mL min−1. For each analysis, the injection volume was 1 μL.
Non-condensable gases collected in gas bags at various times during the reaction were analyzed using a refinery gas analyzer Shimadzu GC2014 system with (1) Restek Rtx (RTX) – Alumina column and a flame-ionization (FID) detector to analyze methane and C2–C5 olefins and (2) RTX-MS-5A column and RTX-Q-plot column with a thermal conductivity detector (TCD) to analyze CO and CO2, respectively.
2.5. Catalyst characterization
The reactor configuration did now allow for on-stream catalyst sampling; the catalyst bed was sampled only after on-stream feeding had concluded by removing the feed auger before the reactor was set to combustion mode.Textual characterization was performed using Ar adsorption/desorption isotherms obtained at −196 °C using Quantachrome Autosorb iQ Automated Gas Sorption system. The RLRS-BET surface areas were calculated from the P/P0 from 0.003 to 0.5. The total volume was calculated at P/P0 = 0.95. The pore-size distribution was calculated using the NLDFT (non-local density functional theory) adsorption kernel in AsiQwin v3.01 (Quantachrome) for Ar adsorbed in cylindrical pores of silica at 87 K.
TPO of the spent catalysts was performed with a TA instrument Q500 system. For these experiments, approximately 20 mg of sample was loaded onto a Pt pan. The samples were first heated to 120 °C with 10 °C min−1 for 10 min and further heated to 700 °C with 10 °C min−1 ramp rate in 50 mL min−1 O2 flow. The weight loss because of char + coke was then obtained by taking into consideration the peaks in the range of 325–700 °C.
The acidity of the catalyst samples was measured using TPD of isopropylamine (IPA-TPD) and ammonia (NH3-TPD) using a Micromeritics® Autochem II 2920 Chemisorption Analyzer with an inline TCD. Before testing, the catalyst was heated up to 600 °C for 2 h in helium to remove adsorbed water or organic species. For IPA-TPD, once the 100 mg sample was saturated with IPA at 50 °C for 20 min, helium was flushed at 50 sccm for 2 h to remove any physisorbed isopropylamine. TCD measurements were then taken while heating the sample from 50 °C to 700 °C at a heating rate of 10 °C min−1. For NH3-TPD, the 100 mg sample was saturated with NH3 at 100 °C for 30 min, helium was flushed at 50 sccm for 2 h to remove any physisorbed ammonia. TCD measurements were then taken while heating the sample from 150 °C to 700 °C at a heating rate of 5 °C min−1. The number of Brønsted acid sites was calculated based on the TCD signal for NH3 and propylene from IPA-TPD; the products of isopropylamine decomposition. Total acid sites were calculated based on the TCD signal for ammonia from NH3-TPD. The number of Lewis acid sites was taken as the difference between total acid sites and Brønsted acid sites.
3. Results and discussion
3.1. Effect of catalyst contact time (WHSV−1) on product yield, selectivity, and catalyst
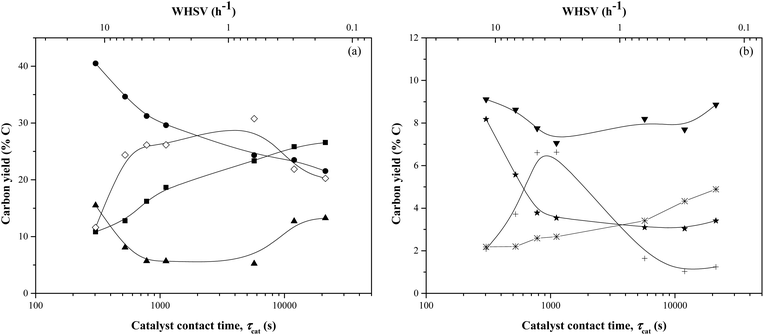
Fig. 4 and Table 1 report the carbon yields of products as a function of catalyst contact time (τcat) at a constant weight turnover (≤1). The weight turnover was approximately 1 for catalysts contact times less than ∼2000 s. At catalyst contact times greater than ∼2000 s, the time-on-stream would have been prohibitively long to reach a turnover of ∼1, so these reactions were terminated after ∼30 min. Prior data reporting reproducibility (in the form of error bars) and mass balances (accomplished using Karl-Fisher analysis to determine the weight yield of water) can be found in Karanjkar et al.12The target temperature of every reaction was 500 °C, though in practice bed temperatures fell within a range of 500 ± 40 °C. Temperatures listed in this study are the average temperature of catalyst bed over the duration of the reaction with a plus-or-minus range encompassing 95% of the temperatures logged at an interval of 0.5 sec. The reasons for difficulty in maintaining constant bed temperature were that cellulose was fed at room temperature and the decomposition of cellulose is endothermic,22 hence bed temperature reduced quickly especially for low contact times. Increases in bed temperature at higher contact times may be attributed to the exothermic conversion of cellulose into coke.
The main products observed were aromatics, olefins, methane, CO, CO2, char + coke, and light oxygenates. The aromatics consisted of benzene, toluene, ethylbenzene, xylenes, styrene, indene, and naphthalene. The identified oxygenates were benzofuran, phenol, acetaldehyde, acetic acid, hydroxyacetone, and 5-hydroxymethylfurfural (HMF). The HPLC analysis of the product showed no anhydrosugars in the liquid product.
Three different ranges of catalyst contact times were observed. At catalyst contact times <1000 s, the aromatics and both unidentified and identified oxygenates showed a dramatic increase in the yield. The aromatics yield increased from 11% at catalyst contact time of 303 s to 19% at a contact time of 1116 s whereas the yield of unidentified oxygenates increased from 12% to 26%. In contrast, the CO yield decreased from 40% to 30% as the catalyst contact time increased from 303 s to 1116 s. Olefins and methane showed a similar trend as CO with their yields decreasing from 9% and 8% to 7% and 3% respectively. At intermediate catalyst contact times (1000–10![[thin space (1/6-em)]](https://www.rsc.org/images/entities/char_2009.gif) 000 s), the aromatics yield increased at a relatively lower rate. The yield of identified oxygenates decreased from 7% to 2% during this range of contact times and the yield of methane and olefins didn't change. At higher catalyst contact times (10
000 s), the aromatics yield increased at a relatively lower rate. The yield of identified oxygenates decreased from 7% to 2% during this range of contact times and the yield of methane and olefins didn't change. At higher catalyst contact times (10![[thin space (1/6-em)]](https://www.rsc.org/images/entities/char_2009.gif) 000 s–22
000 s–22![[thin space (1/6-em)]](https://www.rsc.org/images/entities/char_2009.gif) 000 s), the aromatics yield increased slowly to a maximum of 27%. The CO yield also decreased slowly reaching 22% carbon yield. The yield of unidentified oxygenates decreased from 31% to 20% as the catalyst contact time increased to 21
000 s), the aromatics yield increased slowly to a maximum of 27%. The CO yield also decreased slowly reaching 22% carbon yield. The yield of unidentified oxygenates decreased from 31% to 20% as the catalyst contact time increased to 21![[thin space (1/6-em)]](https://www.rsc.org/images/entities/char_2009.gif) 312 s. The coke yield increased from 5% to 13%.
312 s. The coke yield increased from 5% to 13%.
The high yields of CO at short catalyst contact times suggest that at these conditions the biomass undergoes reactions similar to gasification. The unidentified balance carbon goes through a maximum at intermediate catalyst contact times, suggesting that some unidentified intermediate, perhaps a furanic oligomer, forms at intermediate contact time and then converts into aromatics if it has adequate contact with the catalyst. This interpretation is consistent with our previous work on CFP of furan over a fixed bed of ZSM-5, wherein furan adsorbs in the form of oligomers which in turn form CO, olefins, and aromatics.18
To rule out the candidacy of compounds previously suspected to be intermediates (such as anhydrosugars, furanic compounds, and other oxygenated species),23 we replicated the conditions of CFP at a catalyst contact time (τcat) of 780 s (a condition demonstrated to produce a high amount of unidentified balance carbon) but replaced the catalyst bed with inactive quartz beads. The results of these experiments are compared in Table 2. The unidentified balance carbon for un-catalyzed fast pyrolysis (14.91%) was lower than that of the CFP (26.16%). Anhydrosugars were detected in the un-catalyzed products at a yield of 6.07% compared to the catalyzed reaction which saw no evidence of anhydrosugars. Lastly, the yield of identified oxygenates of the un-catalyzed reaction (9.01%) was higher than that for the catalyzed reaction (6.61%). This analysis rules out anhydrosugars, furanic compounds, and other identified oxygenated species as candidates for the undetectable intermediates species which are precursors to both CO (at low τcat) and aromatics (at high τcat). Detecting and identifying these intermediates is a topic for future study and will require the use of advanced analytical approaches that allow the identification of more functionalities and molecular weights as these intermediates cannot be analyzed with conventional analytical techniques like GC or HPLC.
| Bed type | Quartz | ZSM-5 |
|---|---|---|
| Reaction conditions: cellulose feed; temperature: ∼500 °C; bed mass: 90 g. | ||
| WHSV (h−1) | NA | 4.62 |
| Feed rate (g min−1) | 6.37 | 6.92 |
| Time-on-stream (min) | 18 | 15 |
| Temperature (°C) | 465 ± 20.8 | 520 ± 11 |
| CO | 41.1% | 31.2% |
| CO 2 | 2.0% | 2.6% |
| Char + coke | 4.7% | 5.7% |
| Methane | 8.7% | 3.8% |
| Aromatics | 0.6% | 16.2% |
| Benzene | 0.1% | 5.7% |
| Toluene | 0.1% | 5.6% |
| Xylenes | 0.1% | 1.5% |
| Napthalenes | 0.1% | 1.7% |
| Ethyl-benzene | 0.0% | 0.4% |
| Styrene | 0.1% | 0.6% |
| Indene | 0.1% | 0.8% |
| Olefins/aliphatics | 13.0% | 7.8% |
| Ethane | 2.4% | 1.0% |
| Ethylene | 7.3% | 5.2% |
| C3 | 2.4% | 0.8% |
| C4 | 0.2% | 0.0% |
| C5 | 0.7% | 0.2% |
| Identified oxygenates | 9.0% | 6.6% |
| Benzofuran | 0.0% | 0.2% |
| Phenol | 0.2% | 0.8% |
| Hydroxyacetone | 1.0% | 0.0% |
| HMF | 0.1% | 0.2% |
| Formic acid | 0.1% | 0.0% |
| Furfural | 0.2% | 0.0% |
| Acetylaldehyde | 3.8% | 2.4% |
| Furan | 1.0% | 2.3% |
| 2-MF | 1.8% | 0.7% |
| Acetic acid | 0.8% | 0.1% |
| Anhydrosugars | 6.1% | 0.0% |
| Levoglucosan | 1.2% | 0.0% |
| Others | 4.9% | 0.0% |
| Unidentified carbon | 14.9% | 26.1% |
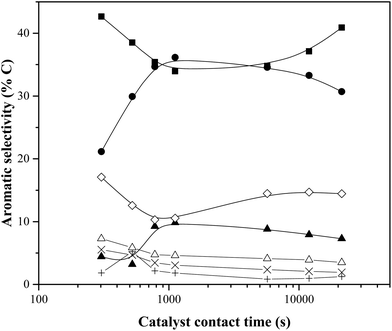
Fig. 5 shows aromatic selectivity as a function of the catalyst contact time (calculated from the data in Table 1). Most striking is the interplay between benzene and toluene selectivity. While the yields of both aromatic compounds were found to increase with catalyst contact time, an increase in toluene selectivity is always accompanied by a benzene decrease, and vice versa. The napthalenes follow a similar trend as the benzene. Similar behavior has been observed previously by our group.24
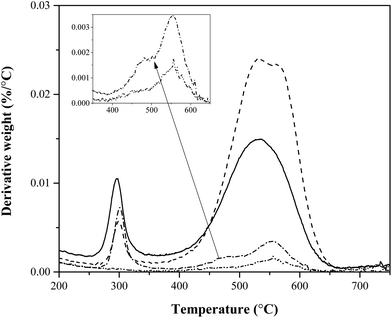
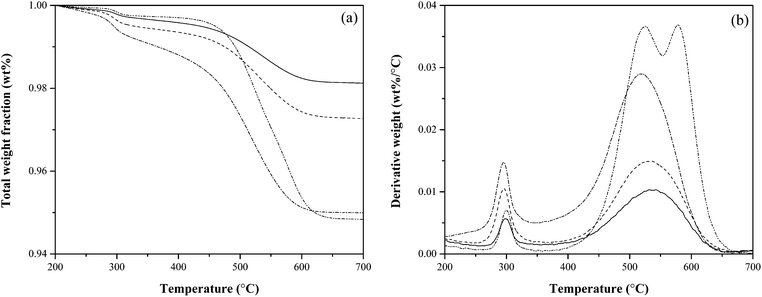
Fig. 6 shows the DTG (derivative weight change) of end-of-reaction catalyst TPO for selected reactions shown in in Table 1. At 300 °C the first peak indicates combustion of un-pyrolized cellulose (verified through the TPO of raw cellulose with fresh ZSM-5, shown in Fig. A.1 found in ESI†). Between temperatures of 450 °C and 600 °C, we see the combustion of char + coke. For reactions with a catalyst contact time higher than 2000 s, the runs were terminated before reaching a weight turnover of ∼1, resulting in lower amounts of char + coke on a catalyst-mass basis. At both low and high catalyst contact times there is evidence of two morphologies of char + coke, though this data offers little suggestion as to which peaks are char and which are coke.
3.2. Effect of weight turnover on product yield, selectivity, and catalyst
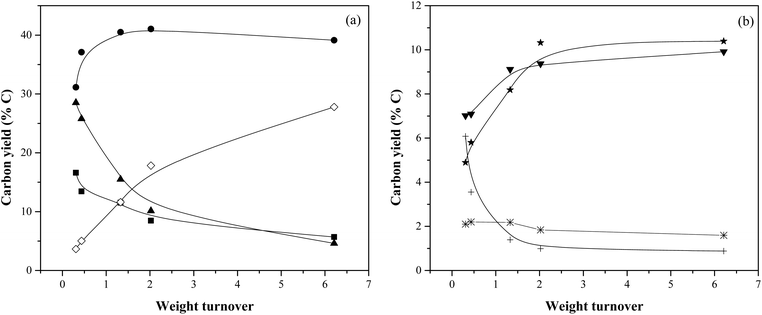
Table 3 and Fig. 7 show product yields as a function of mass turnover while WHSV was held constant at 12.27 h−1. The reaction time for these experiments varied between 1.5 min and 31 min to allow for quantification of aromatics and char + coke. It should be noted that about the catalyst bed temperature is variant within the bounds of 500 °C ± 40 °C, the reasons for which are listed in the previous section.| Reaction conditions: cellulose feed, WHSV: 12.27 h−1, temperature: 500 °C, catalyst mass: 30 g. | |||||
|---|---|---|---|---|---|
| Weight turnover | 0.31 | 0.43 | 1.33 | 2.02 | 6.21 |
| Temperature (°C) | 481 ± 16 | 501 ± 21 | 512 ± 30 | 533 ± 39 | 531 ± 29 |
| Time on stream (min) | 1.5 | 2.2 | 6.5 | 10 | 31 |
| Feed rate (g min−1) | 6.15 | 6.12 | 6.34 | 6.07 | 6.01 |
| CO | 31.1% | 37.1% | 40.5% | 41.0% | 39.1% |
| CO 2 | 2.1% | 2.2% | 2.2% | 1.8% | 1.6% |
| Char + coke | 28.5% | 25.8% | 15.5% | 10.1% | 4.6% |
| Methane | 4.9% | 5.8% | 8.2% | 10.3% | 10.4% |
| Aromatics | 15.4% | 12.5% | 10.8% | 8.2% | 5.5% |
| Benzene | 4.9% | 4.1% | 4.6% | 4.4% | 3.1% |
| Toluene | 4.3% | 3.5% | 2.3% | 1.0% | 0.7% |
| Xylenes | 1.5% | 1.1% | 0.5% | 0.2% | 0.1% |
| Naphthalenes | 2.3% | 2.1% | 1.9% | 1.6% | 0.8% |
| Ethyl benzene | 0.7% | 0.5% | 0.2% | 0.1% | 0.0% |
| Styrene | 0.6% | 0.6% | 0.6% | 0.5% | 0.3% |
| Indene | 1.1% | 0.7% | 0.8% | 0.6% | 0.4% |
| Olefins + aliphatics | 7.0% | 7.1% | 9.1% | 9.4% | 9.9% |
| C2 | 6.5% | 7.0% | 8.8% | 8.8% | 9.0% |
| C3 | 0.1% | 0.1% | 0.3% | 0.5% | 0.9% |
| C4 | 0.2% | 0.0% | 0.0% | 0.0% | 0.0% |
| C5 | 0.3% | 0.0% | 0.0% | 0.1% | 0.0% |
| Identified oxygenates | 7.3% | 4.5% | 2.1% | 1.3% | 1.1% |
| Benzofuran | 0.4% | 0.4% | 0.2% | 0.1% | 0.1% |
| Phenol | 0.8% | 0.6% | 0.5% | 0.2% | 0.2% |
| Hydroxyacetone | 0.2% | 0.1% | 0.0% | 0.0% | 0.0% |
| HMF | 1.1% | 0.9% | 0.3% | 0.2% | 0.0% |
| Acetaldehyde | 2.5% | 1.1% | 0.5% | 0.4% | 0.3% |
| Furan | 1.8% | 1.4% | 0.5% | 0.4% | 0.5% |
| 2-Methylfuran | 0.5% | 0.2% | 0.0% | 0.0% | 0.1% |
| Acetic acid | 0.0% | 0.0% | 0.0% | 0.0% | 0.0% |
| Unidentified carbon | 3.6% | 5.0% | 11.6% | 17.8% | 27.8% |
When the weight turnover increased from 0.31 to 6.21, aromatics yield decreased gradually from 15% to 6%, char + coke yield decreased from 29% to 5%. The yield of identified oxygenates also decreased from 7% to 1%. The CO yield increased initially from 31% to ∼40% and then remained essentially the same at weight turnovers >1. Olefins and methane yield followed similar trend, with their yields increasing with weight turnover from 7% to 10% and from 5% to 10% respectively. With increasing weight turnover, the yield of unidentified carbon steadily increased from 4% to 28%.
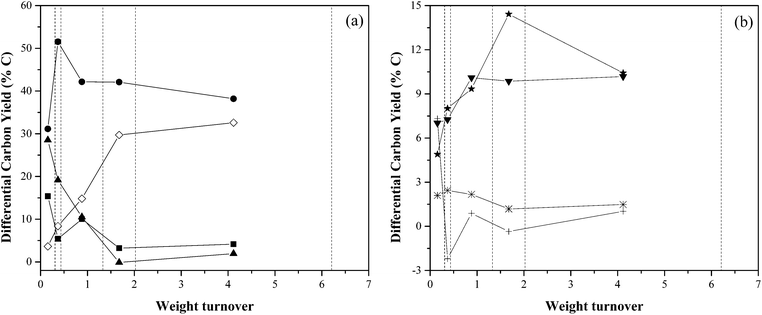
The yields reported Table 3 and Fig. 7 are averaged over the entire duration of the reaction, and are thus not representative of the amounts of products species produced at any given turnover. To measure how different degrees of coking affect the output product distribution at any point during a reaction, it is necessary to calculate a “differential yield”. Our choice of differential yield was evaluated using eqn (10), which follows the progress of product yields in real time. The results are shown in Table 4 and Fig. 8.
 | (10) |
| Weight turnover interval | 0.00–0.31 | 0.31–0.43 | 0.43–1.33 | 1.33–2.02 | 2.02–6.21 |
| CO | 31.1% | 51.5% | 42.2% | 42.1% | 38.2% |
| CO2 | 2.1% | 2.4% | 2.2% | 1.2% | 1.5% |
| Char + coke | 28.5% | 19.2% | 10.5% | −0.1% | 1.9% |
| Methane | 4.9% | 8.0% | 9.3% | 14.4% | 10.4% |
| Aromatics | 15.4% | 5.4% | 10.0% | 3.2% | 4.2% |
| Olefins + aliphatics | 7.0% | 7.3% | 10.1% | 9.9% | 10.2% |
| Identified oxygenates | 7.3% | −2.2% | 0.9% | −0.4% | 1.0% |
| Unidentified carbon | 3.6% | 8.4% | 14.8% | 29.7% | 32.6% |
A small number of differential yields were calculated to be less than zero, though their low magnitudes are consistent with differential yields close to zero with error bars of ±2%. As the catalyst accumulates char + coke, the production of char + coke decreases, starting at yields close to 30% with fresh catalyst, but decreases to close to 0% once the catalyst reaches a weight turnover in the range of 1.33–2.02, and remains close to zero thereafter. Similarly, the aromatic yield decreases from 15% to 3–4% above weight turnovers of 1.33. Over the course of catalyst coking, the amount of unidentified balance carbon increased roughly in the same amount as the char + coke yield decreased. It is not known whether these undetectable compounds are the same intermediate compounds suggested by our catalyst-contact-time data; only that these compounds are not detectable with our current methods. Carbon monoxide was produced in significantly lower amounts (30%) at weight turnovers below 0.31, but reached a maximum of 50% between the turnovers of 0.31 and 0.43. Above turnovers of 0.43, the CO yield held constant around 40%. The identified oxygenates were produced at a yield of 7.32% until a turnover of 0.31 where the oxygenate yield dropped and remained at 0% (±2%). Olefin production increased from 7% to 10% over the course of the coking. Since olefins are known to be consumed in the presence of ZSM-5,19 this suggests that fewer of them are consumed as the catalyst deactivates. Methane production also increased from 5% to 10%, though this is likely due to more homogeneous chemistry occurring in the absence of active catalyst. Carbon dioxide production remained constant in the range of 1–2%.
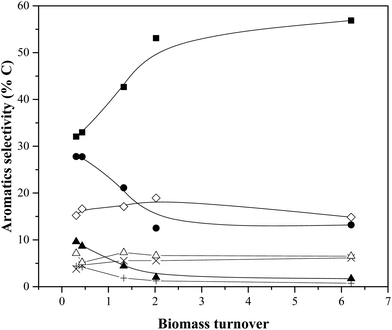
Fig. 9 shows aromatic selectivity as a function of weight turnover (calculated from the data in Table 2). As was the case in the previous section, an increase in benzene (and napthalenes) selectivity is always accompanied by a decrease toluene selectivity.
Fig. 10 reports the TPO of used catalysts. The first peak of the derivative of weight change indicates combustion of un-reacted cellulose (verified through the TPO of raw cellulose with fresh ZSM-5, shown in Fig. A.1 found in ESI†). As before, there is evidence of two char + coke morphologies; the second of which only forms at high turnover. This finding is consistent with the literature, in particular Gamliel et al.25 who reported the formation of a second char + coke morphology at high enough biomass-to-catalyst ratios (analogous to weight turnover), though their second morphology combusts at a lower temperature than their first.
Table 5 reports the RLRS–BET surface area and pore volumes of fresh and used catalyst at different weight turnovers as described in section 4 of Hammond and Conner.26 Micropore volumes were selected to give a CBET values of just over 40. The calculations for this analysis may be found in the ESI.† Over the course of increasing weight turnover, the micropore volume decreased from around 30 cm3 g−1 to around 20 cm3 g−1. This is likely due to the blocking of micropores by the coke formed during the reaction. Up to a weight turnover of 2.02, the RLRS-BET surface area also decreased from about 30 m2 g−1 to about 15 m2 g−1, corresponding to a decrease in mesoporosity. The subsequent increase in RLRS-BET surface are may be due to deposited char + coke possessing some degree of mesoporosity.
| Reaction conditions: cellulose feed, WHSV: 12.27 h−1, temperature: 500 °C, catalyst mass: 30 g. | |||||
|---|---|---|---|---|---|
| Weight turnover | 0.00 | 0.31 | 1.31 | 2.02 | 6.21 |
| Micropore volume (cm3 g−1) | 35.5 | 34.0 | 32.5 | 17.5 | 18.4 |
| C BET (dimensionless) | 40.2 | 40.2 | 40.2 | 40.2 | 46.4 |
| Monolayer volume (cm3 g−1) | 7.5 | 5.2 | 5.1 | 3.6 | 4.9 |
| RLRS-BET surface area (m2 g−1) | 32.5 | 22.8 | 22.4 | 15.6 | 21.5 |
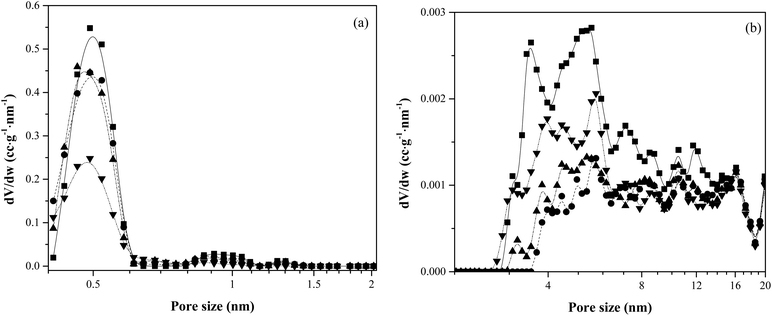
Fig. 11 shows the pore-size distribution of the fresh and used catalysts. It is clear that as the weight turnover increased from 0 to 6.21, there was a decrease in the number of micropores (pore size <0.6 nm). This decrease in micropores likely has a role in decreasing the aromatics yield at higher turnovers since this porosity is needed for the formation of aromatics. Interestingly, the mesoporosity of the samples increased after a turnover of 0.31, suggesting again that the deposited char + coke may possess some degree of mesoporosity.
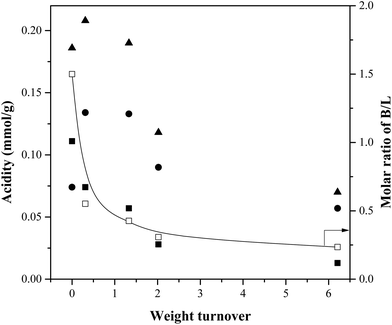
Fig. 12 reports the Brønsted and Lewis acid-site concentrations in catalysts at different weight turnovers. Most importantly, the concentration of Brønsted acid sites decrease with increases in turnover. Since the total acidity remains roughly constant until a weight turnover of 1.33, this suggests that below this limit, increases in weight turnover convert Brønsted sites into Lewis sites. Above this turnover, the total acidity decreases suggesting that the accumulated char + coke blocks the acid sites from further interacting with any species present in the reactor. Previous work has been demonstrated the role of acidity in the production of aromatics through varying the Si/Al ratio of ZSM-5.27,28 The interpretation that both microporosity and acidity are necessary for the production of aromatics is consistent with the review by Rezaei et al.29
4. Conclusions
Catalytic fast pyrolysis (CFP) of cellulose over ZSM-5 was studied in a bubbling fluidized bed reactor to understand the effects of catalyst contact time (WHSV−1) and coking.Because accumulated coke deactivates the catalyst, the effect of catalyst contact time was studied at coke loadings for which the catalyst was still known to be active. CO and CH4 are favored at low catalyst contact times (<1000 s), oxygenated and unidentified species at medium catalyst contact times (1000 s–10![[thin space (1/6-em)]](https://www.rsc.org/images/entities/char_2009.gif) 000 s), and aromatics and CO2 at high catalyst contact times (>10
000 s), and aromatics and CO2 at high catalyst contact times (>10![[thin space (1/6-em)]](https://www.rsc.org/images/entities/char_2009.gif) 000 s). These findings suggest that some un-detectable intermediate (indirectly observed as missing balance carbon) is converted into CO at low contact times (<1000 s), and converted into aromatics at high contact times (>10
000 s). These findings suggest that some un-detectable intermediate (indirectly observed as missing balance carbon) is converted into CO at low contact times (<1000 s), and converted into aromatics at high contact times (>10![[thin space (1/6-em)]](https://www.rsc.org/images/entities/char_2009.gif) 000 s).
000 s).
Coking causes a loss of catalyst activity. The majority aromatic-producing activity was lost after site turnovers of 95 (cellulose monomers to Brønsted sites) corresponding to a weight turnover of 2.0 (feed weight to catalyst weight). At this turnover, the aromatics yield (averaged over the length of the time on stream) is halved from 15%C to 8%C. At this point, the catalyst has also lost more than half of its Brønsted acidity and a little more than half of its microporosity.
Acknowledgements
This work was primarily funded by the National Science Foundation Office of Emerging Frontiers in Research and Innovation (EFRI) grant number 0937895. The first author also received support from National Natural Science Foundation of China (No. 51622604 and 51376076) and Key Projects of National Fundamental Research Planning (National 973 project: No. 2013CB228102). Professor G. W. Huber has an ownership interest in Anellotech, which has licensed the technology reported in this publication.References
- M. H. Langholtz, B. J. Stokes and L. M. Eaton, Billion-Ton Report: Advancing Domestic Resources for a Thriving Bioeconomy, Volume 1: Economic Availability of Feedstocks, Oak Ridge National Laboratory, 2016, http://energy.gov/ sites/prod/files/2016/07/f33/2016_billion_ton_report_0.pdf Search PubMed.
- T. R. Carlson, Y.-T. Cheng, J. Jae and G. W. Huber, Energy Environ. Sci., 2011, 4, 145–161 CAS.
- T. R. Carlson, G. A. Tompsett, W. C. Conner and G. W. Huber, Top. Catal., 2009, 52, 241–252 CrossRef CAS.
- T. R. Carlson, T. P. Vispute and G. W. Huber, ChemSusChem, 2008, 1, 397–400 CrossRef CAS PubMed.
- H. Zhang, T. R. Carlson, R. Xiao and G. W. Huber, Green Chem., 2012, 14, 98–110 RSC.
- R. French and S. Czernik, Fuel Process. Technol., 2010, 91, 25–32 CrossRef CAS.
- C. A. Mullen, A. A. Boateng, D. J. Mihalcik and N. M. Goldberg, Energy Fuels, 2011, 25, 5444–5451 CrossRef CAS.
- A. A. Lappas, M. C. Samolada, D. K. Iatridis, S. S. Voutetakis and I. A. Vasalos, Fuel, 2002, 81, 2087–2095 CrossRef CAS.
- V. Paasikallio, F. Agblevor, A. Oasmaa, J. Lehto and J. Lehtonen, Energy Fuels, 2013, 27, 7587–7601 CrossRef CAS.
- V. Paasikallio, C. Lindfors, E. Kuoppala, Y. Solantausta, A. Oasmaa, J. Lehto and J. Lehtonen, Green Chem., 2014, 16, 3549–3559 RSC.
- D. C. Dayton, J. R. Carpenter, A. Kataria, J. E. Peters, D. Barbee, O. D. Mante and R. Gupta, Green Chem., 2015, 17, 4680–4689 RSC.
- P. U. Karanjkar, R. J. Coolman, G. W. Huber, M. T. Blatnik, S. Almalkie, S. M. de Bruyn Kops, T. J. Mountziaris and W. C. Conner, AlChE J., 2014, 60, 1320–1335 CrossRef CAS.
- J. Jae, R. Coolman, T. J. Mountziaris and G. W. Huber, Chem. Eng. Sci., 2014, 108, 33–46 CrossRef CAS.
- C. A. Mullen and A. A. Boateng, Ind. Eng. Chem. Res., 2013, 52, 17156–17161 CrossRef CAS.
- C. A. Mullen and A. A. Boateng, Fuel Process. Technol., 2010, 91, 1446–1458 CrossRef CAS.
- Y.-T. Cheng, J. Jae, J. Shi, W. Fan and G. W. Huber, Angew. Chem., Int. Ed., 2012, 124, 1416–1419 CrossRef.
- H. Zhang, R. Xiao, B. Jin, G. Xiao and R. Chen, Bioresour. Technol., 2013, 140, 256–262 CrossRef CAS PubMed.
- Y.-T. Cheng and G. W. Huber, ACS Catal., 2011, 1, 611–628 CrossRef CAS.
- M. Stöcker, Microporous Mesoporous Mater., 1999, 29, 3–48 CrossRef.
- J. H. Jae, G. A. Tompsett, Y. C. Lin, T. R. Carlson, J. C. Shen, T. Y. Zhang, B. Yang, C. E. Wyman, W. C. Conner and G. W. Huber, Energy Environ. Sci., 2010, 3, 358–365 CAS.
- S. Du, J. A. Valla and G. M. Bollas, Green Chem., 2013, 15, 3214–3229 RSC.
- H. P. Yang, R. Yan, H. P. Chen, D. H. Lee and C. G. Zheng, Fuel, 2007, 86, 1781–1788 CrossRef CAS.
- Y.-C. Lin, J. Cho, G. A. Tompsett, P. R. Westmoreland and G. W. Huber, J. Phys. Chem. C, 2009, 113, 20097–20107 CAS.
- H. Yang, R. J. Coolman, P. Karanjkar, H. Wang, Z. Xu, H. Chen, T. J. Mountziaris and G. W. Huber, Green Chem., 2015, 17, 2912–2923 RSC.
- D. P. Gamliel, S. Du, G. M. Bollas and J. A. Valla, Bioresour. Technol., 2015, 191, 187–196 CrossRef CAS PubMed.
- K. D. Hammond and W. C. Conner, in Advances in Catalysis, ed. B. C. Gates and F. C. Jentoft, 2013, vol. 56, pp. 1–101 Search PubMed.
- A. J. Foster, J. Jae, Y. T. Cheng, G. W. Huber and R. F. Lobo, Appl. Catal., A, 2012, 423, 154–161 CrossRef.
- J. Jae, G. A. Tompsett, A. J. Foster, K. D. Hammond, S. M. Auerbach, R. F. Lobo and G. W. Huber, J. Catal., 2011, 279, 257–268 CrossRef CAS.
- P. S. Rezaei, H. Shafaghat and W. M. A. W. Daud, Appl. Catal., A, 2014, 469, 490–511 CrossRef CAS.
Footnote |
| † Electronic supplementary information (ESI) available. See DOI: 10.1039/c6gc02239a |
| This journal is © The Royal Society of Chemistry 2017 |

