Protective mechanisms of purified polyphenols from pinecones of Pinus koraiensis on spleen tissues in tumor-bearing S180 mice in vivo†
Juanjuan
Yi
a,
Cuilin
Cheng
a,
Xiaoyu
Li
b,
Haitian
Zhao
a,
Hang
Qu
a,
Zhenyu
Wang
*a and
Lu
Wang
*a
aSchool of Chemical Engineering, Harbin Institute of Technology, 73 Huanghe Road, Nangang District, Harbin 150090, P. R. China. E-mail: wangzhenyu13001@163.com; hitwanglu@hit.edu.cn; Fax: +0451-86282909; Tel: +0451-86282909
bSchool of Environmental and Chemical Engineering, Yanshan University, Qinhuangdao 066004, P. R. China
First published on 15th November 2016
Abstract
The previous study evaluated the antitumor activity and the underlying mechanism of the purified polyphenols from pinecones of Pinus koraiensis (PPP-40) using a tumor-bearing S180 mice model. This study was designed to evaluate the protective effects of PPP-40 on spleen tissues of S180 mice in vivo. Pretreatment with PPP-40 (150 mg per kg BW per D) could significantly inhibit tumor growth, enhance spleen index and prevent the decline of haematological parameters of S180 mice induced by the tumor microenvironment. Moreover, the treatment with PPP-40 was shown to significantly inhibit splenocyte apoptosis by TUNEL staining and flow cytometry, characterized by the inhibition of splenocyte cycle (G0/G1) arrest, increase in the percentages of splenic T lymphocytes (CD3+ T cells) and T cell subsets (CD3+CD4+ and CD3+CD8+ T cells), as well as the production of T cell-related cytokines (IL-2, IL-12, and TNF-α) in splenocytes exposed to the tumor microenvironment. These effects were associated with a decrease in oxidative stress, as evidenced by the changes in the SOD, GSH-Px, GSH and MDA levels of liver and spleen tissues of S180 mice. Furthermore, the protective effect of PPP-40 on spleen tissues was deeply analyzed by detecting apoptosis-related proteins using immunohistochemistry staining. The results indicated that the protective multi-mechanisms of action also were associated with the inhibition of apoptosis through down-regulation protein expressions of Bax, caspase-9, caspase-8 caspase-3, Fas and up-regulation of the expressions of Bcl-2. These results suggested that PPP-40 is a natural antitumor agent and possesses strong immunomodulatory activities by protecting the spleen tissues of tumor-bearing S180 mice.
1. Introduction
The immune system plays an important role in the occurrence and development of cancer.1 Tumor cells may escape from host immune system scrutiny and suppress the activation of immune responses.2 Accumulating evidence also indicates that many tumors not only decrease the reactivity of circulating immune cells including T cells and B cells, but also induce immune cell apoptosis as a mechanism of inhibiting antitumor activity.3,4 This down-regulation of cell-mediated immune functions occurring at the late stages of the disease may be causally related to the disruption of normal tissue architectures and immune organ involution including the spleen and thymus.5,6 To overcome this situation, immunotherapy has been attempted in various animal models and human cancer patients.In recent years, new therapeutic targets for the immune checkpoint pathways also have been found to make immunotherapy a reality in the treatment of cancer.7–9 In addition, although treatment methods like surgery, irradiation, and chemotherapy have improved, the serious side effects of these methods that they can damage normal cells and tissues around tumors limit their applications.10,11 Therefore, searching for antitumor drugs with higher bioactivities and lower toxicity from nature has been an extremely active domain.
Various kinds of polyphenols from plants were reported to exhibit diverse biological activities including antitumor, immunomodulatory and antioxidant activities and to display low toxicity compared with chemical drugs.12–14 For example, Krifa et al. reported that an aqueous extract of Limoniastrum guyonianum gall mainly containing flavonoids, polyphenols, and tannins, exhibited a significant immunoregulatory effect by inducing splenocyte proliferation.15 The main active ingredients of pine polyphenols also are catechin-based flavonoids and phenolic acids.16,17 Moreover, the purified polyphenols from Pinus koraiensis pinecones have been reported to act as antitumor and antioxidant agents.18,19 Previous studies also showed that plant polyphenols can effectively attenuate the immune deficiency caused by the onslaught of tumor or conventional cancer therapies (irradiation, and chemotherapy) and augment the body's natural defense systems by enhancing immunomodulatory and antioxidant activities.20,21
In our previous study, it was found that the purified polyphenols from pinecones of Pinus koraiensis (PPP) could inhibit the growth of colon cancer cells.18 Moreover, it has also been demonstrated that the 40% ethanol eluent fraction of PPP (PPP-40) from the pinecones of Pinus koraiensis can improve its anti-proliferation activity against human LOVO colon cancer cells in vitro and induce cell apoptosis by activating caspases.22 Recently, we also investigated the antitumor and antioxidant activities of PPP-40 in tumor-bearing S180 mice models in vivo. However, there is no report on whether the antitumor activity of PPP-40 in tumor-bearing S180 mice in vivo is correlated with its immune regulatory activity and protective effects on the immune organ. Therefore, this study was designed to evaluate the protective effects of PPP-40 on spleen tissue in tumor-bearing S180 mice in vivo.
2. Materials and methods
2.1 Materials and reagents
The dried pinecones of P. koraiensis were provided by the Forestry Bureau (Yichun, China). The superoxide dismutase (SOD), glutathione peroxidase (GSH-PX), reduced glutathione (GSH), malondialdehyde (MDA) and protein quantization measurement kits were purchased form Nanjing Jiancheng Bioengineering Institute (Nanjing, China). TUNEL commercial kits were purchased from Boster Bio-Engineering Limited Company (Wuhan, China). All other chemicals were of analytical grade and were purchased from local suppliers. PPP-40 was prepared according to our previous method and enriched with the chromatographic column of D101 macroporous resins.22 As identified by HPLC, its main ingredients were catechin and taxifolin (Fig. 1S†).222.2 Animals and cells
Male KM mice of the SPF-level (6–8 weeks old, 22–25 g each) were housed in a mouse room at temperature (22 ± 2 °C), light (12 h light/dark cycles) and humidity (50 ± 10%) and were provided with rodent laboratory chow pellets and tap water for a week to adapt to the environment of the mouse room. The experimental protocol was approved by the Institutional Animal Ethical committee.Mouse sarcoma S180 cell lines were purchased from the Chinese Academy of Sciences (Shanghai, China) and preserved in the College of Food Science and Engineering of Harbin Institute of Technology (Harbin, China).
2.3 Experimental design and oral administration
The antitumor activity of PPP-40 was further detected in a tumor-bearing S180 mice model.23 Briefly, the mice were injected subcutaneously in the left axilla with S180 cells (1.0 × 10⁶ cells per mouse) except for the normal control group. 24 h later, the mice except for the normal control group were randomly divided into five groups of 12 mice in each group. The animals in the normal and model groups serving as the normal control (non-tumor-inoculated) and the model control (tumor-inoculated) orally received an equal volume of normal saline every day. The cyclophosphamide (CTX, 20 mg per kg BW per D) positive control group and PPP-40 (50, 150 and 300 mg per kg BW per D) treated groups were treated by oral administration for 10 days, respectively. And all the animals were weighed each day during the treatment period. At 24 h after the last administration, the mice were sacrificed by decapitation, then the spleens and the tumor blocks of mice were taken for the calculations of the spleen index and the inhibitory rate, respectively. Spleen index was calculated according to the following equation: spleen index = spleen weight/body weight × 100. The tumor inhibition rate was expressed according to the following equation: (the mean tumor weight of the control group − the mean tumor weight of the treated group)/the mean tumor weight of the control group × 100.2.4 Hematological parameters
After the mice were sacrificed, fresh blood was collected immediately for the number of blood cells analysis. The red blood cell (RBC), white blood cell (WBC), and platelet (PLT) counts and haemoglobin (HGB) levels were assessed by using an automatic counter system.2.5 Morphological determination
After the mice were sacrificed, the spleens were fixed intact in 4% paraformaldehyde for 24 h. Then the fixed spleen was cut into five segments, embedded vertically into paraffin and sectioned to provide the transverse sections of the spleen. Two-micrometer sections were taken and placed on the slides. The sample was stained by the method of H&E and observed under a light microscope (SDS-1B, Photoelectric Instrument Co. Ltd, Chongqing, China).252.6 Apoptosis detection of splenocytes
2.7 Flow cytometric analysis of the cell cycle
The collected splenocytes from the S180 mice under aseptic conditions were fixed with cold 70% ethanol and stored at 4 °C for at least 24 h, and subsequently subjected to PI labeling (PI/RNase Staining Buffer), and the cells were analyzed by flow cytometry.242.8 Determination of CD4+ and CD8+ T cells by flow cytometry
The collected splenocytes from the S180 mice were washed twice, then re-suspended in PBS (1 × 10⁶ cells per mL) and assessed for the percentages of CD3+, CD3+CD4+ and CD3+CD8+ T cells by fluorescence activated cell sorting (FACS). Splenocytes were stained with antibodies for surface markers, including anti-mouse-CD3-PerCP/Cy5.5, anti-mouse-CD4-FITC and anti-mouse-CD8-PE antibodies (all from BioLegend, Shanghai, China). The stained cells were analyzed using flow cytometer analysis.2.9 Determination of cytokine levels by ELISA
For assessment of the interleukin-2 (IL-2), interleukin-12 (IL-12) and tumor necrosis factor (TNF-α) levels, the collected splenocytes from the S180 mice were cultured in RPMI-1640 medium for 48 h at a density of 1 × 10⁶ cells per mL in 6-well plates. The culture supernatant was collected and quantified by commercial ELISA kits according to the manufacturer's instructions.2.10 Determination of the SOD, GSH-Px, GSH and MDA
The activities of SOD, GSP-Px and the contents of GSH and MDA in 10% liver and spleen homogenates were determined according to the experimental procedure provided by the manufacturers (Nanjing Jiancheng Bioengineering Institute, Nanjing, China). Tissue protein was estimated according to the kit (BCA method) using BSA as a standard. The SOD and GSH-Px activities were expressed in U mg−1 protein, the contents of GSH was expressed in μmol mg−1, and the content of MDA was expressed in nmol mg−1.2.11 Immunohistochemistry
Representative paraffin blocks were serially cut into two-micrometer thick sections, deparaffinized in xylene, rehydrated in graded ethanol and washed with phosphate-buffered saline three times. The sections were boiled in 10 mM citrate buffer (pH 6.0) for antigen retrieval. Endogenous peroxidase was blocked through incubation with 3% hydrogen peroxide in methanol for 30 min, and incubated with primary rabbit monoclonal antibodies overnight at 4 °C. After several rinses in phosphate-buffered saline, the sections were incubated in the biotinylated secondary antibodies.27 The bound antibodies were detected by the streptavidin–biotin method according to the instructions of Bax, Bcl-2 and caspase-3 (Boster Bio-Engineering Limited Company, China), caspase-9, Fas (Santa Cruz Biotechnology, Inc., USA) and caspase-8 (Affinity Biosciences, USA) commercial kits. The slides were rinsed in PBS, exposed to diaminobenzidine, and then counterstained with Mayer's hematoxylin. The negative control was made without addition of the primary antibody during the staining process. The positive cells were counted under a light microscope and photographed (magnification × 400).2.12 Statistical analysis
All statistical analyses employed SPSS for Windows, Version 18.0. Data were expressed as means ± standard deviation (SD) of three independent measurements. Statistical analyses were performed by one-way ANOVA. Differences at p < 0.05 and p < 0.01 were considered statistically significant using Duncan's new multiple-range test.3. Results
3.1 Effect of PPP-40 on tumor growth and spleen index in S180 tumor-bearing mice
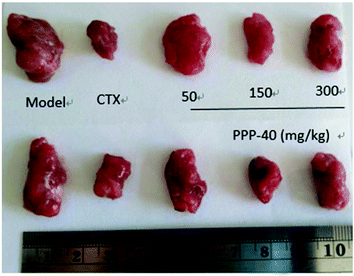
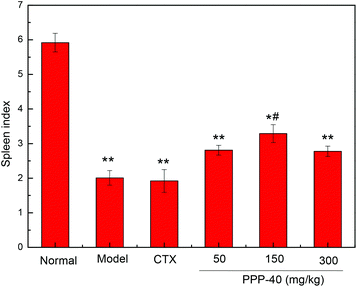
The potent in vivo antitumor activity of PPP-40 was further validated in S180-bearing mice. Fig. 1 and Table 1 clearly show a significant increase in the inhibition rate of tumor in the S180 mice treated with PPP-40, but did not significantly affect the body weight (Fig. 2S†) when compared to the normal control (p < 0.01), indicating the safety of PPP-40 within the trial dose range (50, 150 and 300 mg per kg BW per D). As shown in Fig. 2 the spleen index in the model control group markedly decreased compared with the normal control group, from 5.92 ± 0.27 to 2.01 ± 0.19 (p < 0.01). However, the treatment with PPPP-40 (150 mg per kg BW per D) could markedly increase spleen indexes (3.29 ± 0.26) compared with the model control group (p < 0.05), which indicated that 150 mg per kg BW per D PPP-40 showed the best protective effect against the onslaught of tumor.| Groups | Dose mg kg−1 | Tumor weight g | Inhibition rate % |
|---|---|---|---|
| *p < 0.05 compared with the model group; **p < 0.01 compared with the model group; #p < 0.05 compared with the control group; ##p < 0.01 compared with the control group. | |||
| Model | — | 2.05 ± 0.23 | — |
| CTX | 20 | 0.84 ± 0.08** | 59.02** |
| PPP-40 | 50 | 1.79 ± 0.19*## | 12.68**## |
| PPP-40 | 150 | 1.06 ± 0.12**# | 48.29**# |
| PPP-40 | 300 | 1.39 ± 0.11**## | 32.20**## |
3.2 Effect of PPP-40 pretreatment on haematological parameters
Tumors can cause medulla hemotopoietic function suppression and the number of WBCs decrease in blood. As shown in Table 2, the haematologic parameters (WBC, RBC, PLT and HGB) of the model control group decreased significantly compared with the normal control group, from 13.74 ± 1.33 × 10⁹ L−1, 9.27 ± 0.78 × 10¹² L−1, 18.64 ± 1.34 × 10¹¹ L−1 and 177.46 ± 9.16 G L−1 to 5.70 ± 0.11 × 10⁹ L−1, 6.86 ± 0.62 × 10¹² L−1, 10.35 ± 0.71 × 10¹¹ L−1 and 101.00 ± 10.13 G L−1 (p < 0.05) respectively. PPP-40 (150 mg per kg BW per D) possessed the most significant inhibition effect (p < 0.05) against the loss of the counts of WBC, RBC, PLT and the concentration of HGB compared to the model control group.| Group | WBC (109 L−1) | RBC (1012 L−1) | PLT (1011 L−1) | HGB (G L−1) |
|---|---|---|---|---|
| *p < 0.05 compared with the normal group; **p < 0.01 compared with the normal group; #p < 0.05 compared with the model group; ##p < 0.01 compared with the model group. | ||||
| Normal | 13.74 ± 1.33 | 9.27 ± 0.78 | 18.64 ± 1.34 | 177.46 ± 9.16 |
| Model | 5.70 ± 0.11** | 6.86 ± 0.62* | 10.35 ± 0.71** | 101.00 ± 10.13** |
| CTX | 7.21 ± 0.75*# | 8.73 ± 1.05# | 16.55 ± 1.71*# | 154.01 ± 12.22*## |
| PPP-40-L | 6.82 ± 0.72*# | 7.59 ± 0.83* | 10.68 ± 0.81** | 124.67 ± 10.47**# |
| PPP-40-M | 9.72 ± 0.61*# | 8.97 ± 1.32# | 15.78 ± 2.31*# | 141.61 ± 12.41*# |
| PPP-40-H | 7.64 ± 0.35*# | 8.28 ± 2.42*# | 14.59 ± 0.79**# | 135.54 ± 20.32**# |
3.3 PPP-40 protects spleens in morphology
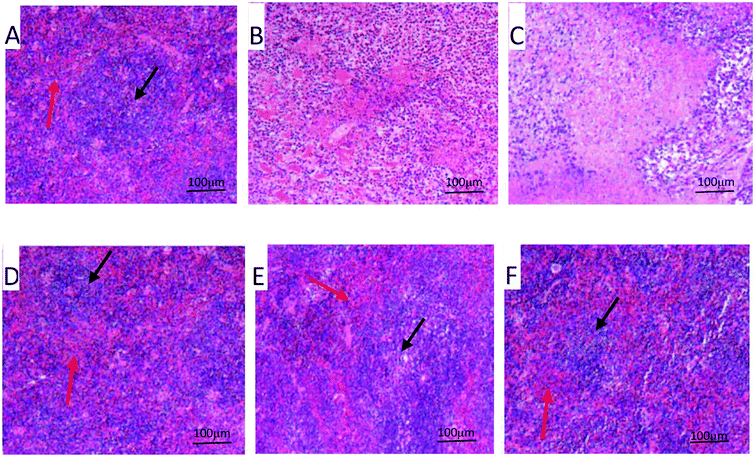
The splenic morphology was characterized by H&E staining. The normal spleen is made of the intact red pulp and white pulp (Fig. 3A). However, in the model control group, the spleen architecture of the model control was destroyed. The tumor microenvironment significantly reduced the cellularity of white and red pulps and decreased the density of the layer of lymphocytes (Fig. 3B). Compared with the model control group, the architecture of spleen tissue was damaged more seriously by the treatment of CTX (Fig. 3C). However, the damage of spleen was meliorated considerably by the treatment of PPP-40 to allow a more stable environment for the splenocyte proliferation (Fig. 3D–F).3.4 PPP-40 restrains splenocyte apoptosis of S180 mice
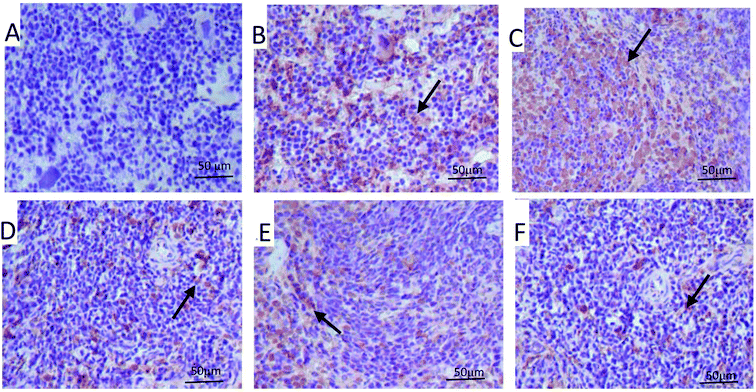
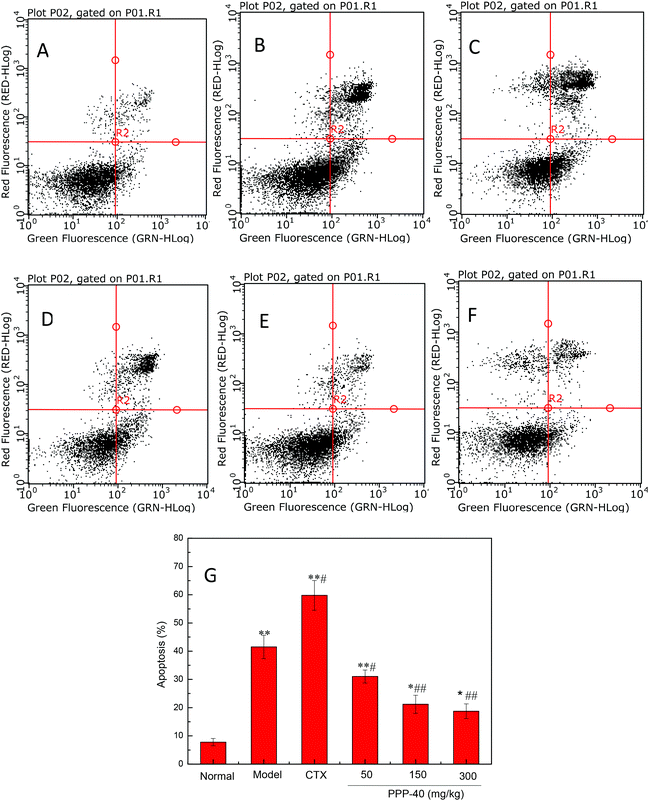
It has been shown that tumor-induced spleen involution and disruption was due to increased apoptosis of splenocytes.28 Therefore, we examined the apoptosis level in the spleen tissues of different groups by TUNEL staining and flow cytometry. As shown in Fig. 4, the TUNEL staining showed that PPP-40 protect the spleen tissues against the onslaught of tumor by inhibiting splenocyte apoptosis (Fig. 4D–F) compared with the model control group, while CTX treatment showed the opposite (Fig. 4C). Based on the results above, we further quantified the apoptosis rates of splenocytes by FACS analysis. As shown in Fig. 5, the model control group (41.51 ± 2.14%, p < 0.01) (Fig. 5B) showed a high apoptosis rate of splenocytes compared with the normal control group (7.78 ± 1.25%, Fig. 5A); PPP-40 pretreatment significantly inhibited splenocyte apoptosis compared with the model control group (p < 0.01) (Fig. 5D–F). The apoptosis rates of splenocytes are shown in Fig. 5G.3.5 Effect of PPP-40 on splenocyte-cycle arrest in S80 mice
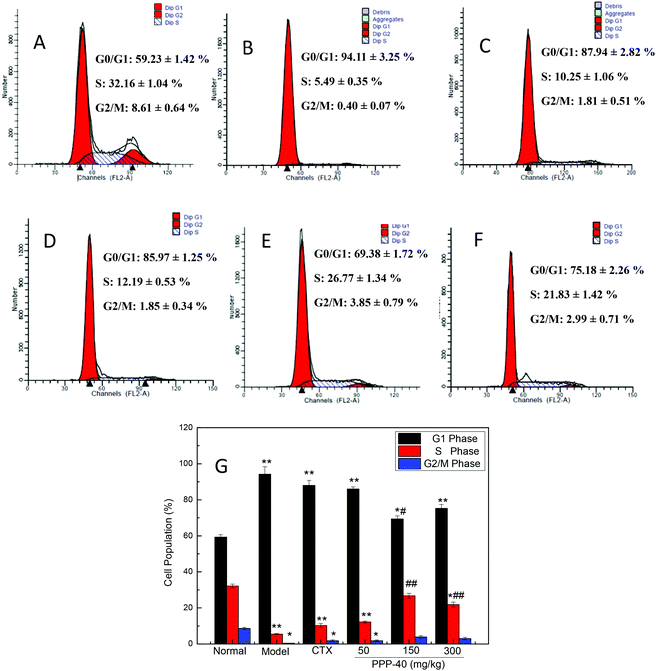
Fig. 6 shows the effect of PPP-40 on the splenocyte cycle phase distribution of the S180 mice. In comparison with the normal control group (59.23 ± 1.42%), more splenocytes of the model control group were arrested in the G0/G1 phase (94.11 ± 3.25%). After treatment with different concentrations of PPP-40, the cells in the G0/G1 phase were significantly decreased and caused an accumulation of splenocyte population in the S-phase. However, the positive control CTX (20 mg per kg BW per D), with a high tumor inhibitory rate (Table 1), did not induce a significant change in the G0/G1 phase distribution of splenocytes compared to the model control group. The results indicated that CTX might show an immunosuppressive effect on splenocyte proliferation.3.6 Effect of PPP-40 on CD3+CD4+ and CD3+CD8+ T cells
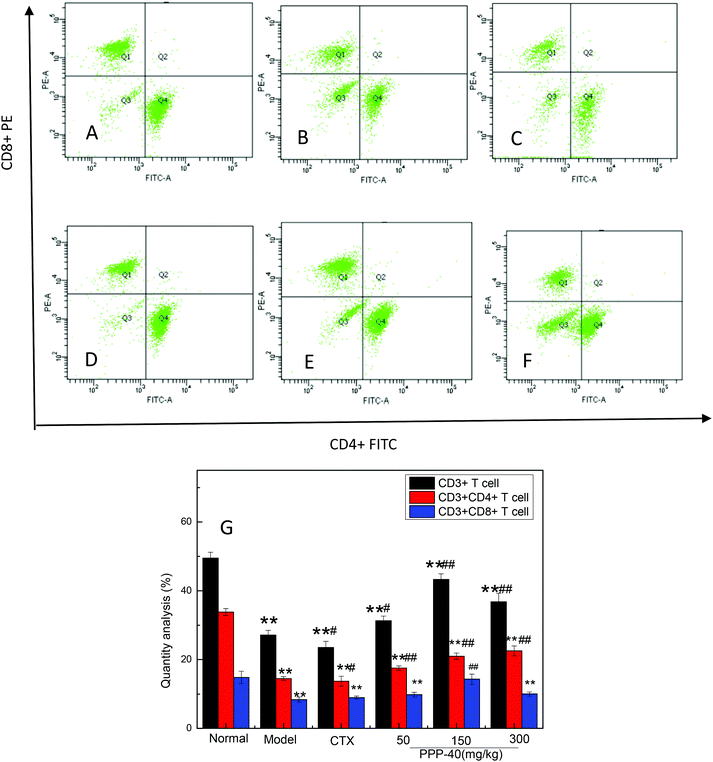
To evaluate the ability of PPP-40 to induce cellular immune responses, the percentages of CD3+ T lymphocytes and T cell subsets (CD3+CD4+ and CD3+CD8+ T cells) in the spleens of the S180 mice were quantified by flow cytometry. Fig. 7 shows that the percentages of total CD3+ T cells and CD3+CD4+ T cells in the PPP-40-treated groups were significantly increased compared with the model group, of which the dose of the 150 mg kg−1 PPP-40 significantly increased the percentages of CD3+CD8+ T cells.3.7 Effect of PPP-40 on cytokine levels secreted by splenocytes
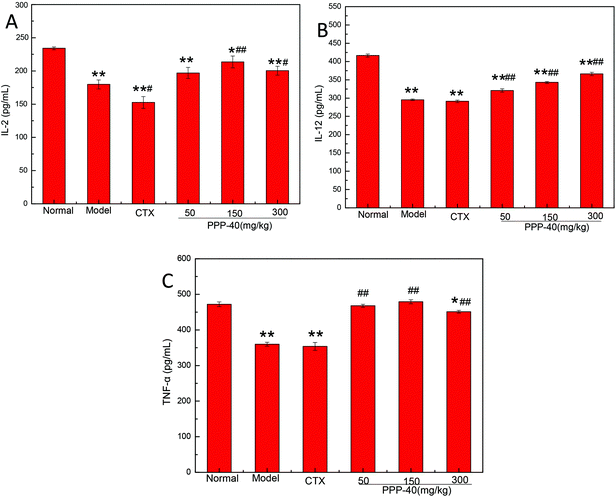
To investigate the effects of PPP-40 on the production of related cytokines, in the present study we analyzed the production of IL-2, IL-12 and TNF-α on PPP-40-treated splenocytes in the tumor-bearing S180 mice using ELISA. As shown in Fig. 8, PPP-40 administration (150 mg per kg BW per D) significantly increased IL-2, IL-12 and TNF-α production compared with the model and CTX control groups.3.8 Effect of PPP-40 on SOD, GSH-Px activities, GSH and MDA levels in S180 tumor-bearing mice
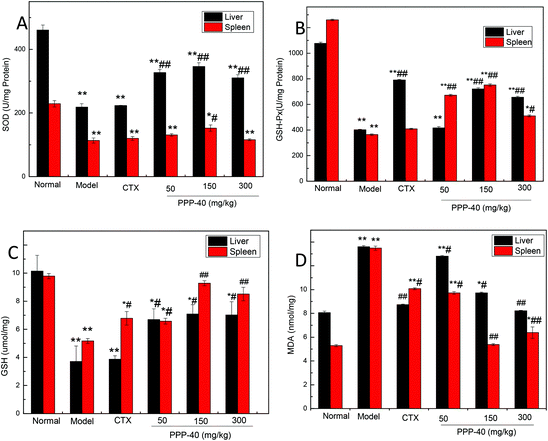
Polyphenols have been intensively investigated for their antioxidant properties.29–30 As shown in Fig. 9, after the administration of PPP-40, the MDA contents were significantly reduced, and the levels of SOD, GSH-Px and GSH were all increased in comparison with the model control groups in the livers and spleens (p < 0.05 or p < 0.01). Among three PPP-40 doses, 150 mg per kg BW per D PPP-40 possessed the most significant positive effects for SOD, GSH-Px and GSH. A positive correlation between the levels of the intracellular antioxidant enzymes of PPP-40 detected in the livers and spleens of the S180-bearing mice and the immune regulatory capacity in vivo also could be observed.3.9 Effect of PPP-40 on expression of apoptosis proteins of spleen tissue in tumor-bearing S180 mice
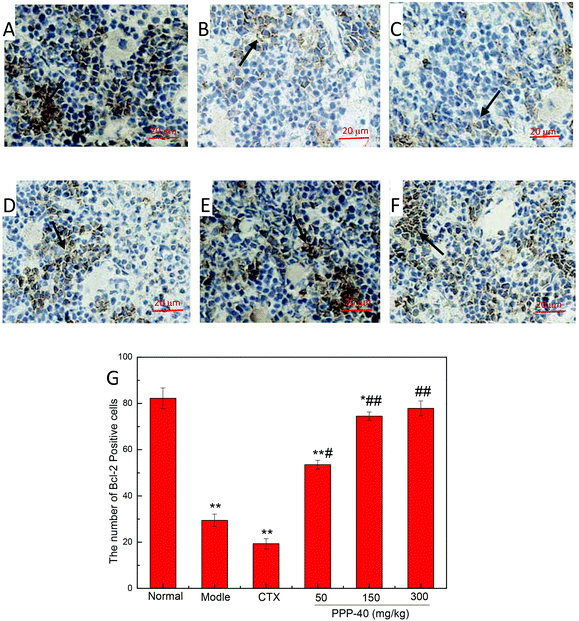
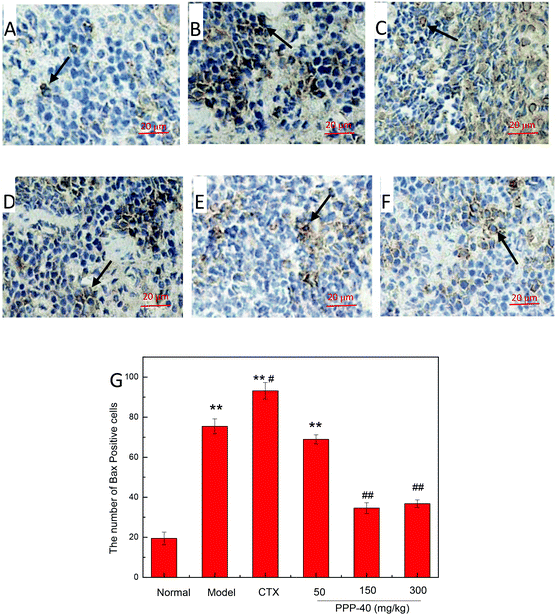
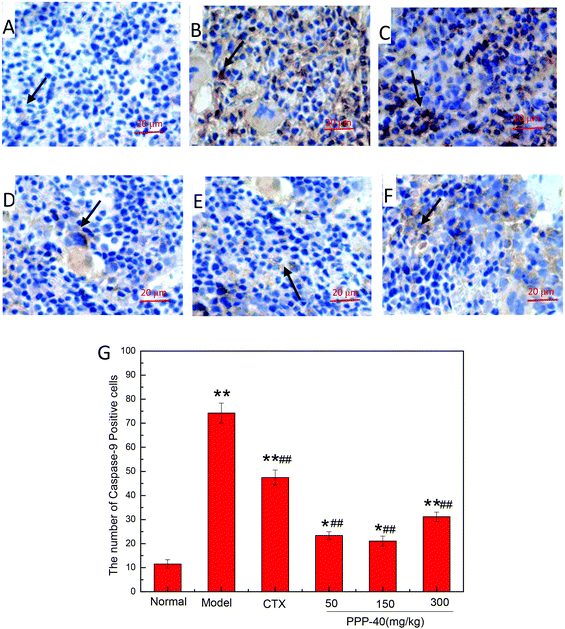
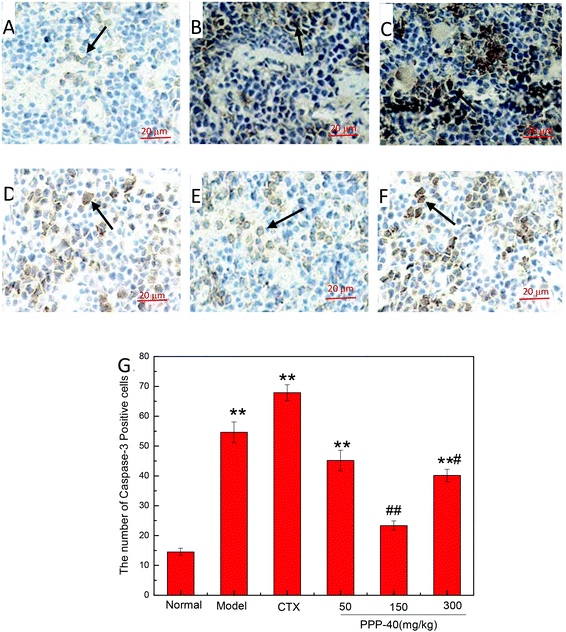
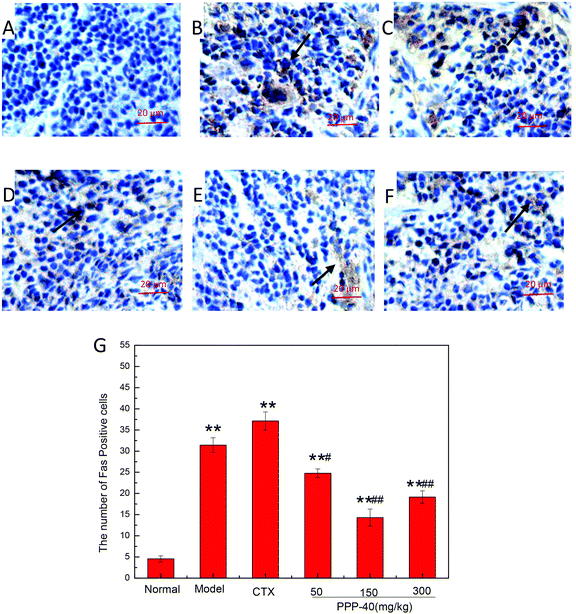
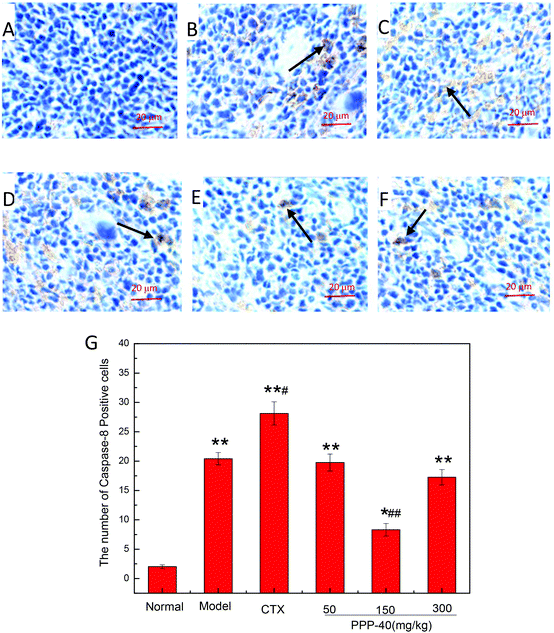
As shown in Fig. 10B, in the model control group, the expression of the Bcl-2 protein was significantly decreased, while the expressions of Bax (Fig. 11B), activated caspase-9 (Fig. 12B) and caspase-3 (Fig. 13B) proteins were significantly increased compared with the normal control group (p < 0.01). PPP-40 groups (50, 150 and 300 mg per kg BW per D) showed increased expression of Bcl-2 (P < 0.01) (Fig. 10D–F), decreased expression of Bax (Fig. 11D–F), activated caspase-9 (Fig. 12D–F) and caspase-3 (Fig. 13D–F) proteins (P < 0.01) and therefore blocked the intrinsic apoptotic pathway of splenocytes of the S180 mice. In addition, the counts of Fas (Fig. 14B) and caspase-8 (Fig. 15B) positive cells in the model group also were far higher than the normal control group (p < 0.01). However, 150 mg per kg BW per D of PPP-40 could most effectively inhibit Fas (Fig. 14E) and caspase-8 (Fig. 15E) protein expression (p < 0.01). The above results showed that PPP-40 could not only restrain the intrinsic apoptosis of splenocytes by declining the expressions of Bax, caspase-9 and caspase-3, but also inhibit extrinsic apoptosis by declining the expressions of Fas and caspase-8.4. Discussion
A number of conventional chemotherapies induce significant toxicity particularly in normal tissues.31 Natural products have been shown to be excellent and reliable sources for the development of new drugs that show little toxicity towards host.12–14 Accumulating evidence has increasingly shown that plant polyphenols have potent immunotherapeutic properties with respect to the prevention and treatment of cancer.32–33 Our previous study also proved that the purified polyphenols from P. koraiensis pinecones (PPP-40) showed antitumor activity in vitro and could induce apoptosis in LOVO cells through the caspase activation pathway.22 Recently, we investigated for the first time the antitumor activities of PPP-40 in S180 mice. In the present study, PPP-40 was further investigated for its immune regulating activity in S180 mice.Spleen is an important immune organ, the spleen index can directly reflect the level of immune functions of the body, and the effects of drugs on the spleen index can be used as the preliminary indicator for the study on immune pharmacological mechanisms in animals.34 Interestingly, the most effective antitumor dose of PPP-40 (150 mg per kg BW per D, tumor inhibition rate 48.29%, Fig. 1 and Table 1) also showed a better protective effect on the spleen tissues of S180-bearing mice with the increasing spleen index (Fig. 2) and prevented the decline of haematological parameters (Table 2) compared with the model control group. It was also found that the damaged spleen structures by tumor microenvironment were improved by various degrees (Fig. 3) and the apoptosis rates of splenocytes decreased significantly by the treatment of PPP-40 (Fig. 4 and 5) compared with the model control group. Treatment with PPPP-40 was shown to significantly protect spleen tissues against the onslaught of tumor, characterized by inhibition of splenocyte cycle (G0/G1) arrest (Fig. 6), and increases the percentages of CD3+, CD3+CD4+ and CD3+CD8+ T cells (Fig. 7), as well as the production of T cell-related cytokines (IL-2, IL-12 and TNF-α) in splenocytes (Fig. 8). Meanwhile, the result of CTX treatment was the opposite, the spleen structure was further damaged with the higher apoptosis rates of splenocytes compared with the model because the conventional chemotherapy reagent (CTX) was an immunosuppressant; PPP-40 and CTX might have different mechanisms in antitumor activities. These results also further suggest that the antitumor effect of PPP-40 may be related to its enhanced effect on the immunity, whereas its side effects should be lower than those induced by CTX.
The disorder of free radical metabolism is closely related to the occurrence and development of tumors.38 Normally, there is a complete set of antioxidant defense systems in the body.39 Under the normal physiological conditions, free radicals produced during metabolism may be scavenged by the antioxidant systems such as SOD and GSH-Px, but when the antioxidant systems are damaged, lipid peroxides like MDA will be produced excessively, leading to the damage of normal cells and tumorigenesis.40 In the present study, the tumor microenvironment damaged the enzymatic antioxidant defense system in the model control group. However, the different doses of PPP-40 could significantly improve the levels of SOD, GSH-Px and GSH, and reduce the content of MDA in the liver and spleen tissues of the S180 mice (Fig. 9), indicating that PPP-40 can exert its antitumor effects and improve its immunoregulatory activity by improving the activity of antioxidant enzymes and reducing the content of MDA in the S180 mice.
It is well recognized that the fate of any cell also depends, at least partly, upon the balance between the pro- and anti-apoptotic proteins of the Bcl-2 family, e.g. Bcl-2 and Bax.35 Bcl-2 deficient mice have been found to undergo severe lymphoid apoptosis in thymus and spleen.36 On the other hand, the increase of Bax expression also has been reported to promote apoptosis in thymus and spleen.37 In the present study, PPP-40, at its antitumor doses (50, 150 and 300 mg per kg BW per D), could restore the expression of Bcl-2 (Fig. 10), decrease the expression of Bax (Fig. 11) and inhibit the expressions of activated caspase-9 (Fig. 12) and caspase-3 (Fig. 13) proteins in the splenocytes of the S180 mice thereby inhibiting splenocyte apoptosis. Meanwhile, it also was found that PPP-40 could inhibit splenocyte apoptosis by regulating the extrinsic apoptotic pathways (Fig. 14 and 15) and ultimately change the balance between the pro- and anti-apoptotic proteins of immune cells.
5. Conclusions
Based on our study, we proposed a model (Fig. 16) for exploring the protective mechanisms of the purified polyphenols from P. koraiensis pinecones (PPP-40) against the damage of spleen tissues induced by the tumor microenvironment in S180 mice in vivo. The model revealed that PPP-40 could significantly ameliorate tumor-induced immunosuppression by activating of CD3+, CD3+CD4+ and CD3+CD8+ T cells, enhancing the cytokine secretion of splenocytes and strengthening the function of the antioxidant system of spleen tissues, therefore inhibiting splenocyte apoptosis of the tumor-bearing S180 mice by blocking the intrinsic and extrinsic apoptotic pathways. The efficacy of PPP-40 provided evidence that this functional plant extract could be developed as a potential antitumor and immunoregulatory agent.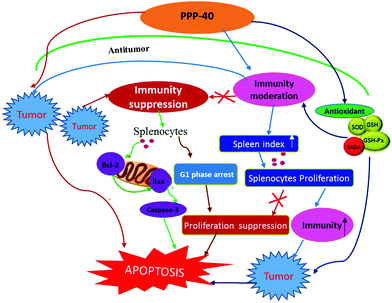 | ||
| Fig. 16 Proposed model for the protective mechanism of PPP-40 against tumor-induced splenocyte apoptosis in S180 mice in vivo. | ||
Nonstandard abbreviations
| P. koraiensis | Pinus koraiensis |
| PPP | Polyphenols of P. koraiensis pinecones |
| TUNEL | TdT-mediated-dUTP nick end labeling |
| SOD | Superoxide dismutase |
| GSH-Px | Glutathione peroxidase |
| GSH | Glutathione |
| MDA | Malondialdehyde |
| RBC | Red blood cell |
| WBC | White blood cell |
| BW per D | Body weight per day |
| PBS | Phosphate-buffered saline |
| CD3+ T cells | Cluster of differentiation 3+ (T lymphocytes) |
| CD4+ and CD8+ T cells | Cluster of differentiation 4+/8+ (T cell subsets) |
| IL-2, -12 | Interleukin-2, -12 |
| TNF-α | Tumor necrosis factor-α |
Conflict of interest
The authors have declared no conflict of interest.Funding
We gratefully acknowledge the financial support from the Chinese National High Technology Research and Development Program (Grant No. 31170510); the Scientific Research Innovation Fund of Harbin Institute of Technology (HIT.NSRIF.2017023).Animal ethics
The animal experiment has been supplied relating to ethical approvals (i.e., approving body and any reference numbers): the experimental protocols were approved by the Heilongjiang University of Chinese Medicine (SCXK Hei 2008004). All efforts were made to minimize animal suffering.Acknowledgements
The authors thank Professor Lu Wei-Hong and Professor Ma Ying from the Chemical Engineering, Harbin Institute of Technology, for their helpful suggestions and assistance.References
- L. Feng, Y. Chen, L. Yuan, X. Liu, J. F. Gu, M. H. Zhang and Y. Wang, Molecules, 2013, 18, 13920–13939 CrossRef CAS PubMed.
- T. L. Whiteside, Oncogene, 2008, 27, 5904–5912 CrossRef CAS PubMed.
- A. Poggi and M. R. Zocchi, Arch. Immunol. Ther. Exp., 2006, 54, 323–333 CrossRef CAS PubMed.
- T. L. Whiteside, Cancer Res. Treat., 2006, 130, 103–124 CAS.
- L. Wang, Z. K. Nie, Q. Zhou, J. L. Zhang, J. J. Yin, W. Xu, Y. Qiu, Y. L. Ming and S. Liang, Food Funct., 2014, 5, 2183–2193 CAS.
- G. Yu, G. Chen, B. Huang, W. Shao and G. Zhang, Chin. J. Cancer, 2013, 25, 299–305 Search PubMed.
- M. S. Baliga, Chin. J. Integr. Med., 2012, 1–14 Search PubMed.
- J. R. Brahmer, J. Clin. Oncol., 2013, 31, 1021–1028 CrossRef CAS PubMed.
- G. C. Jagetia and M. S. Baliga, Phytother. Res., 2006, 20, 103–109 CrossRef PubMed.
- S. Zhang, S. Nie, D. Huang, J. Q. Huang, Y. L. Feng and M. Y. Xie, Food Chem. Toxicol., 2014, 68, 239–246 CrossRef CAS PubMed.
- Z. Dewan, Int. Rev. Immunol., 2008, 27(3), 93–110 CrossRef PubMed.
- X. H. Kou, L. H. Han, X. Y. Li, Z. H. Xue and F. J. Zhou, Front. Chem. Sci. Eng., 2016, 10, 108–119 CrossRef CAS.
- D. Vergara, P. Simeone, S. Bettini, A. Tinelli, L. Valli, C. Storelli, S. Leo, A. Santino and M. Maffia, Food Funct., 2014, 5, 1261–1269 CAS.
- G. Santilli, I. Piotrowska, S. Cantilena, O. Chayka, M. D’ Alicarnasso, D. A. Morgenstern, N. Himoudi, K. Pearson, J. Anderson, A. J. Thrasher and A. Sala, Clin. Cancer Res., 2013, 19, 1116–1125 CrossRef CAS PubMed.
- M. Krifa, I. Bouhlel, L. Ghedira-Chekir and K. Ghedira, J. Ethnopharmacol., 2013b, 146, 243–249 Search PubMed.
- M. Jerez, J. Sineiro and M. J. Nuñez, Eur. Food Res. Technol., 2009, 229, 651–659 CrossRef CAS.
- C. Z. Shen, H. Y. Jun, S. H. Choi, Y. M. Kim and E. J. Jung, Bull. Korean Chem. Soc., 2010, 31, 3567–3572 CrossRef CAS.
- J. J. Yi, Z. Y. Wang, H. N. Bai, X. J. Yu, J. Jing and L. L. Zuo, Molecules, 2015, 20, 10450–10467 CrossRef CAS PubMed.
- H. Li and Z. Y. Wang, RSC Adv., 2015, 5, 30711–30718 RSC.
- L. B. Yang, S. H. Ma, Y. Han, Y. H. Wang, Y. Guo, Q. Weng and M. Y. Xu, Nutrients, 2016, 8, 287–303 CrossRef PubMed.
- S. Reagan-Shaw, H. Mukhtar and N. Ahmad, Photochem. Photobiol., 2008, 84, 415–421 CrossRef CAS PubMed.
- J. J. Yi, Z. Y. Wang, H. N. Bai, L. Li, H. T. Zhao, C. L. Cheng, H. Zhang and J. T. Li, RSC Adv., 2016, 6, 5278–5287 RSC.
- J. F. Cao, H. Dong, J. B. Lu, L. Zhu, P. Y. Zhang, N. Zhou and K. S. Chen, Bioorg. Med. Chem. Lett., 2016, 26, 2098–2104 CrossRef CAS PubMed.
- Z. Quan, X. C. Huo, F. D. Sun and R. Q. Dong, Mol. Med. Rep., 2015, 377, 9764 Search PubMed.
- M. Ahn, C. Moon, W. Yang, E. J. Ko, J. W. Hyun, H. G. Joo, Y. Jee, N. H. Lee, J. W. Park, R. K. KO, G. O. Kim and T. Shin, Food Chem. Toxicol., 2011, 49, 864–870 CrossRef CAS PubMed.
- T. Lu, C. Zhang, M. Chai and Y. An, Biomed. Pharmacother., 2016, 80, 343–351 CrossRef CAS PubMed.
- L. Liu, L. Hou, S. Gu, X. Zou, D. Meng, M. Luo, X. Zhang, S. Huang and X. Zhao, Oncol. Rep., 2015, 33, 297–303 CAS.
- B. Dong, G. Dai, X. U. Lei, Y. Zhang, L. F. Ling, L. L. Sun and J. Lv, Mol. Med. Rep., 2014, 10, 2827–2834 CAS.
- M. M. Selani, A. Bianchini, W. S. Ratnayake, R. A. Flores, A. P. Massarioli, S. M. Alencar and S. G. C. Brazaca, Plant Foods Hum. Nutr., 2016, 77, 137–144 CrossRef PubMed.
- A. Septembre-Malaterre, G. Stanislas, E. Douraguia, E. Douraguia and G. Marie-Paule, Food Chem., 2016, 212, 225–233 CrossRef CAS PubMed.
- K. Sugiyama, H. Ueda and Y. Ichio, Biol. Pharm. Bull., 1995, 18, 544–548 CAS.
- X. H. Kou, L. H. Han, X. Y. Li, Z. H. Xue and F. J. Zhou, Front. Chem. Sci. Eng., 2016, 10, 108–119 CrossRef CAS.
- Z. Ren, C. H. He, Y. H. Fan, L. W. Guo, H. M. Si, Y. W. Wang, Z. Y. Shi and H. B. Zhang, J. Ethnopharmacol., 2014, 155, 769–775 CrossRef PubMed.
- B. Chen, L. Liu, H. Xu, Y. Yang, L. Zhang and F. Zhang, Exp. Ther. Med., 2015, 9, 1063–1067 CAS.
- Y. F. Wu, F. A. Beland, S. Chen, L. Fang, G. Lei and J. L. Fang, Biochem. Pharmacol., 2015, 95, 324–336 CrossRef CAS PubMed.
- S. J. Korsmeyer, X. M. Yin, Z. N. Oltvai, D. J. Veis-Novack and G. P. Linette, Biochim. Biophys. Acta, Mol. Basis Dis., 1995, 1271, 63–66 CrossRef.
- T. Naka, T. Matsumoto, M. Narazaki, M. Fujimoto, Y. Morita, Y. Ohsawa, H. Saito, T. Nagasawa, Y. Uchiyama and T. Kishimoto, Proc. Natl. Acad. Sci. U. S. A., 1998, 95, 15577–15582 CrossRef CAS.
- A. B. Haugrud, Y. Zhuang, J. D. Coppock and W. K. Miskimins, Breast Cancer Res. Treat., 2014, 147, 539–550 CrossRef CAS PubMed.
- L. Wang, X. Y. Li and Z. Y. Wang, Food Funct., 2016, 7, 975–981 CAS.
- F. Hajiaghaalipour, M. S. Kanthimathi, J. Sanusi and J. Rajarajeswaran, Food Chem., 2015, 169, 401–410 CrossRef CAS PubMed.
Footnote |
| † Electronic supplementary information (ESI) available. See DOI: 10.1039/c6fo01235c |
| This journal is © The Royal Society of Chemistry 2017 |

