 Open Access Article
 This Open Access Article is licensed under a
 Creative Commons Attribution 3.0 Unported Licence
In situ TEM observation of the Boudouard reaction: multi-layered graphene formation from CO on cobalt nanoparticles at atmospheric pressure
G. Marien
Bremmer
a,
Eirini
Zacharaki
b,
Anja O.
Sjåstad
b,
Violeta
Navarro
c,
Joost W. M.
Frenken
d and
Patricia J.
Kooyman
*e
aHuygens-Kamerlingh Onnes Laboratory, Leiden University, Niels Bohrweg 2, Leiden, 2333 CA, The Netherlands
bCentre for Materials Science and Nanotechnology, Department of Chemistry, University of Oslo, PO Box 1033, N-0315 Oslo, Norway
cTNO, Stieltjesweg 1, Delft, 2628 CK, The Netherlands
dAdvanced Research Center for Nanolithography, Science Park 110, Amsterdam, 1098 XG, The Netherlands
eDepartment of Chemical Engineering, University of Cape Town, Private Bag X3, Rondebosch, 7701 Cape Town, South Africa. E-mail: patricia.kooyman@uct.ac.za
First published on 6th October 2016
Abstract
Using a MEMS nanoreactor in combination with a specially designed in situ Transmission Electron Microscope (TEM) holder and gas supply system, we imaged the formation of multiple layers of graphene encapsulating a cobalt nanoparticle, at 1 bar CO![[thin space (1/6-em)]](https://www.rsc.org/images/entities/char_2009.gif) :N2 (1:1) and 500 °C. The cobalt nanoparticle was imaged live in a TEM during the Boudouard reaction. The in situ/operando TEM studies give insight into the behaviour of the catalyst at the nanometer-scale, under industrially relevant conditions. When switching from Fischer–Tropsch syngas conditions (CO:H2:N2 1:2:3 at 1 bar) to CO-rich conditions (CO:N2 1:1 at 1 bar), we observed the formation of multi-layered graphene on Co nanoparticles at 500 °C. Due to the high temperature, the surface of the Co nanoparticles facilitated the Boudouard reaction, causing CO dissociation and the formation of layers of graphene. After the formation of the first patches of graphene at the surface of the nanoparticle, more and more layers grew over the course of about 40 minutes. In its final state, around 10 layers of carbon capped the nanoparticle. During this process, the carbon shell caused mechanical stress in the nanoparticle, inducing permanent deformation.
:N2 (1:1) and 500 °C. The cobalt nanoparticle was imaged live in a TEM during the Boudouard reaction. The in situ/operando TEM studies give insight into the behaviour of the catalyst at the nanometer-scale, under industrially relevant conditions. When switching from Fischer–Tropsch syngas conditions (CO:H2:N2 1:2:3 at 1 bar) to CO-rich conditions (CO:N2 1:1 at 1 bar), we observed the formation of multi-layered graphene on Co nanoparticles at 500 °C. Due to the high temperature, the surface of the Co nanoparticles facilitated the Boudouard reaction, causing CO dissociation and the formation of layers of graphene. After the formation of the first patches of graphene at the surface of the nanoparticle, more and more layers grew over the course of about 40 minutes. In its final state, around 10 layers of carbon capped the nanoparticle. During this process, the carbon shell caused mechanical stress in the nanoparticle, inducing permanent deformation.
1. Introduction
Novel techniques and equipment to allow in situ and operando research on catalytic samples are currently under development. Using these tools, it is possible to investigate a catalyst under industrially relevant working conditions: high temperatures and high gas pressures. The so-called temperature and pressure gaps between traditional catalysis research and the industrial applications are thereby bridged, improving the relevance of the results obtained via in situ research.Current demand for clean, renewable fuels has instigated interest in the well-known catalytic Fischer–Tropsch (FT) reaction, which produces hydrocarbons from synthesis gas (syngas, CO and H2).1 One of the catalysts frequently used for this reaction is cobalt, often in the form of supported nanoparticles.2 Both in academia as well as industry, efforts are being undertaken to investigate this catalytic system, in order to understand the fundamental processes involved and eventually improve the performance of the catalyst.
Several research groups have used in situ techniques to explore the FT syngas reaction on cobalt, e.g. scanning tunnelling microscopy (STM),3–5 X-ray diffraction (XRD),6 and X-ray absorption spectroscopy (XAS),7,8 yielding meaningful insight into the working state of the catalyst surface under industrially relevant conditions. However, the use of in situ transmission electron microscopy (TEM) has not yet been reported. As has been shown for other catalytic systems, such as CO oxidation on platinum nanoparticles,9in situ TEM experiments can reveal valuable information of the behaviour of the catalyst nanoparticles at the atomic scale.
To investigate the behaviour of FT catalysts at elevated pressures and temperatures in a TEM, we used a combination of a MEMS nanoreactor loaded with Co nanoparticles, inserted in a specially designed in situ TEM sample holder. The sample holder allowed us to heat the sample (up to 660 °C) while using a gas supply system to flow a mixture of reactant gases over the sample at ambient pressure. A residual gas analyser (RGA) monitored the product gas stream leaving the outlet of the nanoreactor.
2. Experimental
2.1 Cobalt nanoparticles
ε-Cobalt nanoparticles (NPs) were synthesized under inert conditions via hot injection methodology using standard procedures.10 Oleic acid (OA, C18H34O2, ≥99%, 0.07 g) in 1,2-dichlorobenzene (DCB, C6H4Cl2, 99%, anhydrous, 15 mL) was heated to 170 °C under stirring, and 0.52 g of dicobalt octacarbonyl (Co2(CO)8, ≥90% Co) dissolved in 3 mL of DCB was rapidly injected. The black colloidal suspension, formed upon injection, was aged at 170 °C for 30 min before quenching with 10 mL of DCB. The NPs were flocculated with excess 2-propanol (C3H8O, 99.5%, anhydrous) and isolated by centrifugation. After discarding the supernatant, the NP precipitate was purified by three repetitive cycles of washing in 2-propanol and subsequent centrifugation. The ε-Co NPs dispersed in hexane (C6H14, 95%, anhydrous) were stored in a closed container in a glovebox to prevent oxidation. All reagents were supplied by Aldrich, and used without further purification.For reference TEM imaging, a few drops of nanoparticle suspension were placed on a 400 mesh copper TEM grid coated with lacey carbon film, covered with a continuous, ultrathin (<3 nm) carbon film (Ted Pella Inc.). The solvent was left to evaporate inside the glovebox, by heating the TEM grid on a hotplate overnight at 100 °C.
2.2 Nanoreactors
In situ TEM experiments were conducted using the latest version of nanoreactors (Else Kooi Laboratory).11 These micro-electromechanical (MEMS) devices are fully integrated on a single silicon die.12 The nanoreactors, shown in Fig. 1, consist of a 4.5 μm deep, etched channel with an in- and outlet allowing sample loading and gas flow feeding. For heating, a platinum wire is integrated in the top part of the gas channel. This wire allows simultaneous heating and temperature readout via a calibrated resistance measurement. The construction of the channel is such that it is possible to go up to 14 bar and 660 °C. A set of 41 electron-transparent windows, consisting of 15 nm-thin amorphous SiN films, is embedded in the centre of the channel. The thin and chemically inert amorphous silicon nitride film also covers all internal surfaces of the nanoreactor channel. The channel is supported by pillars, to increase stiffness and reduce bulging effects when filled with gas. After the preparation of the channel, the holes used for deposition and etching are plugged to ensure a fully leak tight device.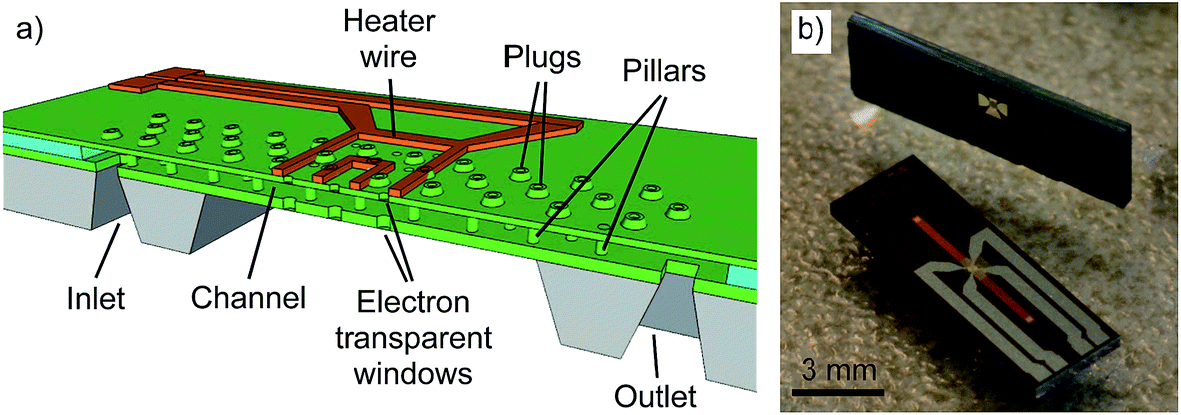 | ||
| Fig. 1 (a) Schematic cross-section drawing of the nanoreactor channel, showing all relevant components. For clarity, this sketch is not drawn to scale.10 (b) Photograph of two identical nanoreactors: the top one, viewed sideways, shows the bottom side with the channel inlet and outlet, and the bottom one, placed flat, shows the top side with the gas channel and heater wire. | ||
Cobalt nanoparticles were loaded into the nanoreactor by drop-casting the suspension containing the sample on the inlet.13 Capillary forces drew the liquid through the channel, depositing nanoparticles on all surfaces, including the electron-transparent windows. The loading was done in a glovebox, under Ar atmosphere. Subsequently, the loaded nanoreactors were stored in an airtight vessel, which was taken out of the glovebox. The vessel was gently heated to ∼80 °C on a hotplate for two days, while a turbomolecular pump was connected to pump down the vessel in order to evaporate the solvent.
2.3 In situ TEM holder
The custom built, dedicated in situ TEM holder used for the experiments contains a pair of capillaries for gas feed and exhaust. The nanoreactors were placed and pressed on top of two Viton O-rings to ensure a leak-tight connection between the nanoreactor gas-channel and the capillaries. For controlling and reading out the temperature of the nanoreactor, four pins (two for control, two for read-out) were placed in contact with the platinum heating wire. Custom-built software digitally controlled and monitored the temperature of the sample.142.4 Gas supply system & residual gas analysis
Reactant gases were supplied by a computer controlled gas flow system (Leiden Probe Microscopy BV).15 A schematic overview of the system is shown in Fig. 2.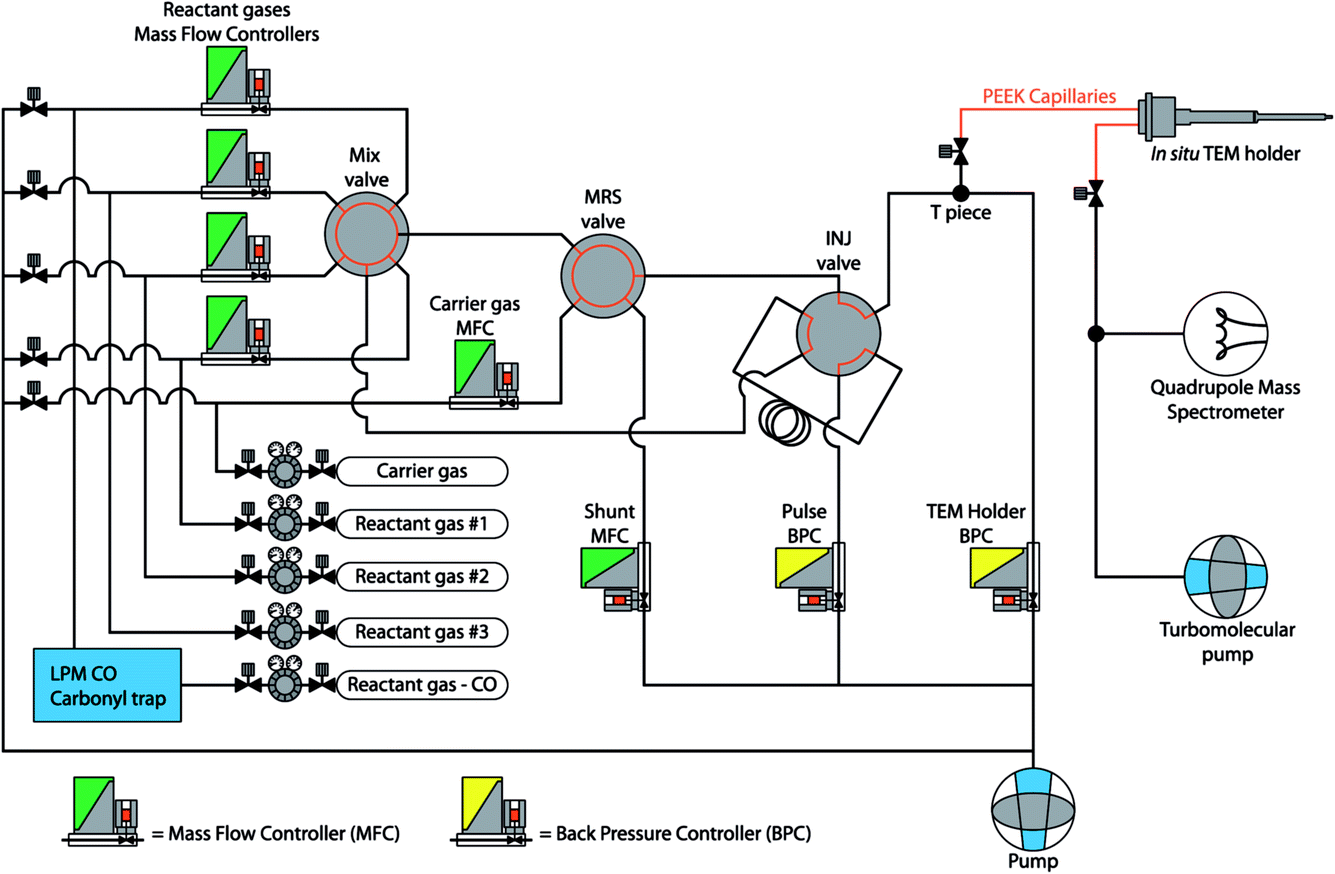 | ||
| Fig. 2 Schematic overview of the gas supply system, showing the computer operated Mass Flow Controllers (MFCs), Back Pressure Controllers (BPCs), and rotating mixing valves. | ||
Reactant gases (Praxair, purity: O2 – 6.0; H2 – 6.0; CO – 4.7) were introduced into the system via standard pressure reducing valves. The flow of each gas was controlled by Mass Flow Controllers (MFCs, Bronkhorst) and the desired mixture was obtained via a rotating mixing valve. Carrier gas (Linde Gas, N2 purity: 6.0) was added to the gas mixture to create a typical total flow of ∼5 mLn min−1. The pressure in the main gas line was regulated by a Back Pressure Controller (BPC, Bronkhorst) ‘TEM holder’, and the exhaust of the system was pumped by a diaphragm pump. To direct a portion of the gas mixture to the in situ holder, a T-piece was placed before the BPC, connected to the inlet of the holder. The capillaries directly connected to the in situ TEM holder were made of PEEK (poly ether ether ketone, a non-conducting material) to ensure electrical insulation of the holder when inserted into the TEM CompuStage. Vibration isolation was implemented by clamping the PEEK capillaries in-between two heavy metal slabs, reducing the mechanical noise introduced by the pumps running continuously. The exhaust capillary of the in situ TEM holder was directly connected to a turbomolecular pump. This setup established a pressure difference between the inlet and the exhaust of the holder, resulting in gas flow through the narrow nanoreactor channel. The pressure inside the nanoreactor channel was defined as half of the pressure that was established by the ‘TEM holder BPC’ at the T-piece of the inlet side of the holder, due to the symmetry of the holder and the nanoreactor. For residual gas analysis, a quadrupole mass spectrometer (QMS, Pfeiffer Vacuum QMA-200) was connected to the exhaust line. Before entering the gas system, CO gas was led through a ‘carbonyl trap’ consisting of a copper tube heated to 325 °C and filled with copper-shot. This was done to decompose and remove any metal carbonyls from the gas, as nickel tetracarbonyl (Ni(CO)4) and iron pentacarbonyl (Fe(CO)5) can be formed in the gas when CO is stored in or passed through steel containers at high pressure (e.g. during the production of the gas).16–18 Using Spacetime software19 the data profiles from the gas supply system, QMS and nanoreactor temperature were synchronised and analysed.
2.5 Transmission electron microscopy
The TEM used for the in situ experiments was a Cs-corrected FEI Titan3 80-300 operated at 300 kV. Images were captured using a Digital Electronic camera (DE-12) with 6.0 μm pixel size and 4096 × 3072 pixels. To minimize beam effects on the sample, the electron intensity was kept below 500 electrons per Å2 per s during the in situ experiments. An exposure time of 1 s was used for image acquisition.Reference images of the cobalt nanoparticles under vacuum were acquired on an FEI monochromated Tecnai F20ST/STEM electron microscope, equipped with a Gatan Ultrascan CCD camera (4k × 4k). This TEM was operated at 200 keV.
Resulting images were analysed using Digital Micrograph 3 and Fiji software.
3. Results and discussion
3.1 Nanoparticle preparation
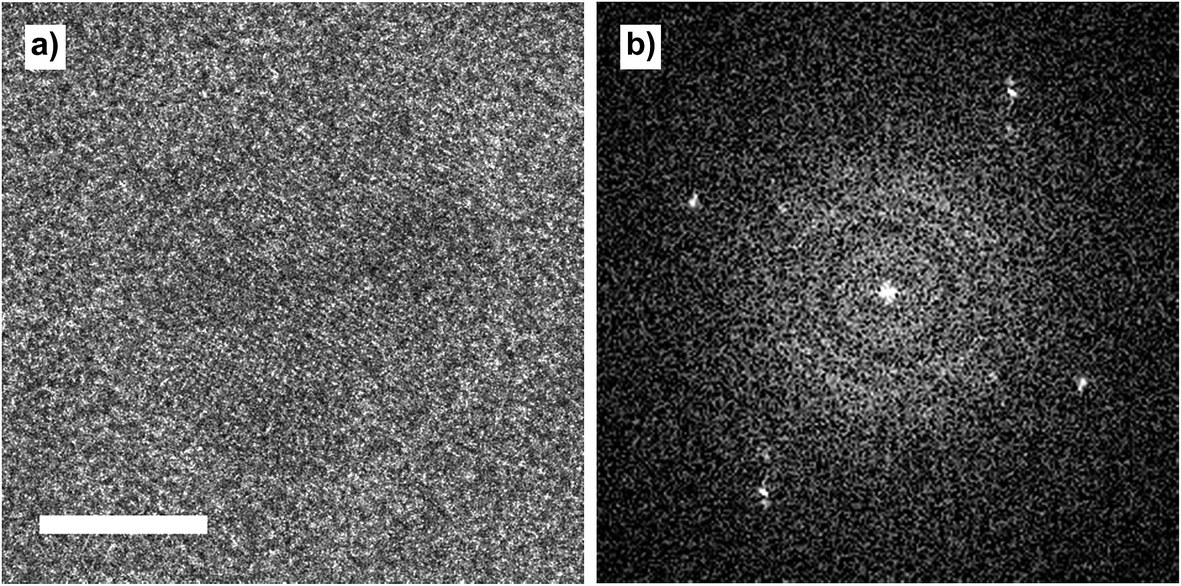
Cobalt nanoparticles were initially imaged on a carbon grid to obtain reference data. Fig. 3 shows a representative micrograph of a free-standing nanoparticle on carbon film. The lattice fringes with a d-spacing of 2.01 Å Fig. 3a, correspond to the (221) lattice plane of ε-Co (space group P4132).20 The FFT shows the two bright spots corresponding to the (221) lattice planes.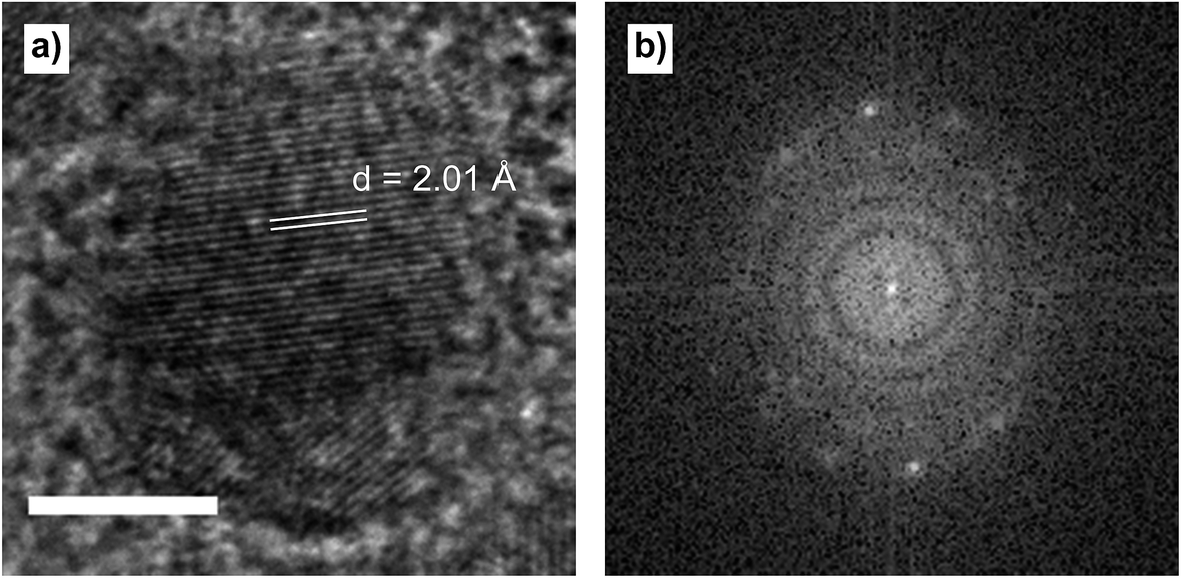 | ||
| Fig. 3 (a) ε-Co nanoparticle on carbon film, showing the lattice fringes corresponding to the (221) lattice plane. (b) FFT of the image. Scale bar is 5 nm. | ||
For the in situ experiments, a nanoreactor was loaded with a suspension containing cobalt nanoparticles. Prior to the Boudouard reaction, the sample was exposed to various conditions in order to conduct different experiments. The gas feed profile, QMS analyser data and temperature course of the whole experiment are shown in Fig. 4.
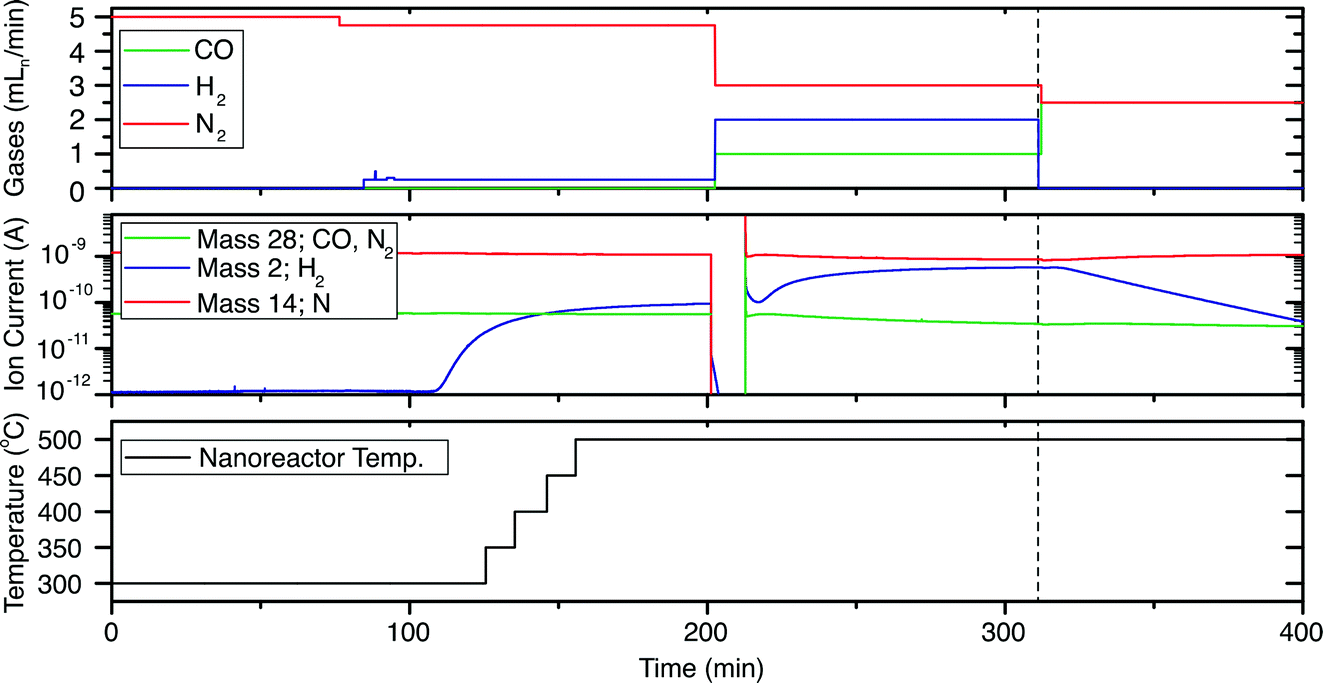 | ||
| Fig. 4 Gas feed profile (top), QMS analyser data (middle), and nanoreactor temperature course (bottom) during the experiment. t = 0 is indicated by the vertical dashed line. | ||
Initially, residual organic oleic acid (OA) molecules were removed in situ by heating the cobalt nanoparticles under a flow of N2, at 1 bar and 300 °C, for 90 minutes. A micrograph of a nanoparticle on the amorphous SiN window of the nanoreactor, obtained after the heating procedure, is shown in Fig. 5.
 | ||
| Fig. 5 (a) Cobalt nanoparticle inside the nanoreactor, at 1 bar N2 and 300 °C. Scale bar is 5 nm. (b) FFT of the image. | ||
To reduce any oxides that might have formed (although we did not observe any oxide in the TEM images), and to further reduce the amount of OA, the nanoreactor was then flushed with 5% H2 in N2. While flushing, the temperature was increased from 300 °C to 500 °C in 30 minutes, using increments of 50 °C, and was kept at 500 °C for the rest of the experiment. During this treatment, the nanoparticles appeared to stay in the metallic state, meaning that no oxides or carbon had formed, however we cannot exclude residues of OA remaining on the nanoparticle surface. The ε-Co phase transforms irreversibly during annealing in a non-oxidative environment to hexagonal close packing (hcp) at ∼300 °C, and cubic close packing (ccp) at ∼500 °C.21
After this reduction step, the metallic nanoparticles were exposed to Fischer–Tropsch syngas conditions. First, the valve to the TEM holder was closed and a mixture of CO:H2:N2 (1:2:3) at 1 bar was prepared in the lines of the gas system. The closing of the valve is visible in Fig. 4b by the sudden dip in the QMS signal, at 200 min. When the reactant mixture was ready, the TEM holder valve was opened again and the gas flow entered the nanoreactor. These conditions were maintained for 100 minutes.
Finally, the feed of H2 was removed and the gas feed mixture was adjusted to CO:N2 (1:1) at 1 bar, while the sample temperature was kept at 500 °C. For clarity and ease of further discussion, the moment of closing the H2 feed is defined as t = 0, as shown by the vertical dashed line in Fig. 4. The residual H2 keeps flowing through the nanoreactor, until after six minutes the H2 signal in the QMS chamber starts to decrease (Fig. 4b).
3.2 Carbon deposition
Four minutes after closing the H2 flow, the first deposition of carbon appeared at the surface of the nanoparticle, as shown in Fig. 6. On the surface of the clean nanoparticle imaged at t = 4:02 minutes (Fig. 6a), the first carbon patch appeared at the top left of the nanoparticle at t = 4:10 (Fig. 6b, indicated by the white arrow). Then, three seconds later at t = 4:13, a second patch of carbon appeared on the surface at the top right of the nanoparticle (Fig. 6c, indicated by the white arrow). The carbon patches continued to grow laterally, and at t = 4:47 the patches joined each other and formed a continuous layer, showing a light grey fringe on top of the nanoparticle (Fig. 6d). After the first layer was formed, a second layer started to form, again at the top right (Fig. 6e). The layer continued to grow and a full second carbon layer was visible at t = 20:48 (Fig. 6f). At t = 24:03 a total of seven layers of carbon had formed on top of the particle (Fig. 6g). The layers continued to grow laterally, thereby capping the nanoparticle, as were visible at 28:53 (Fig. 6h). During the next 10 minutes, more carbon layers formed (Fig. 6i) until the nanoparticle reached its final state at t = 39:10 (Fig. 6j), covered in about 10 layers of carbon. After the formation of the last carbon layer, the nanoparticle was monitored for about 10 more minutes, but no additional carbon was deposited afterwards.
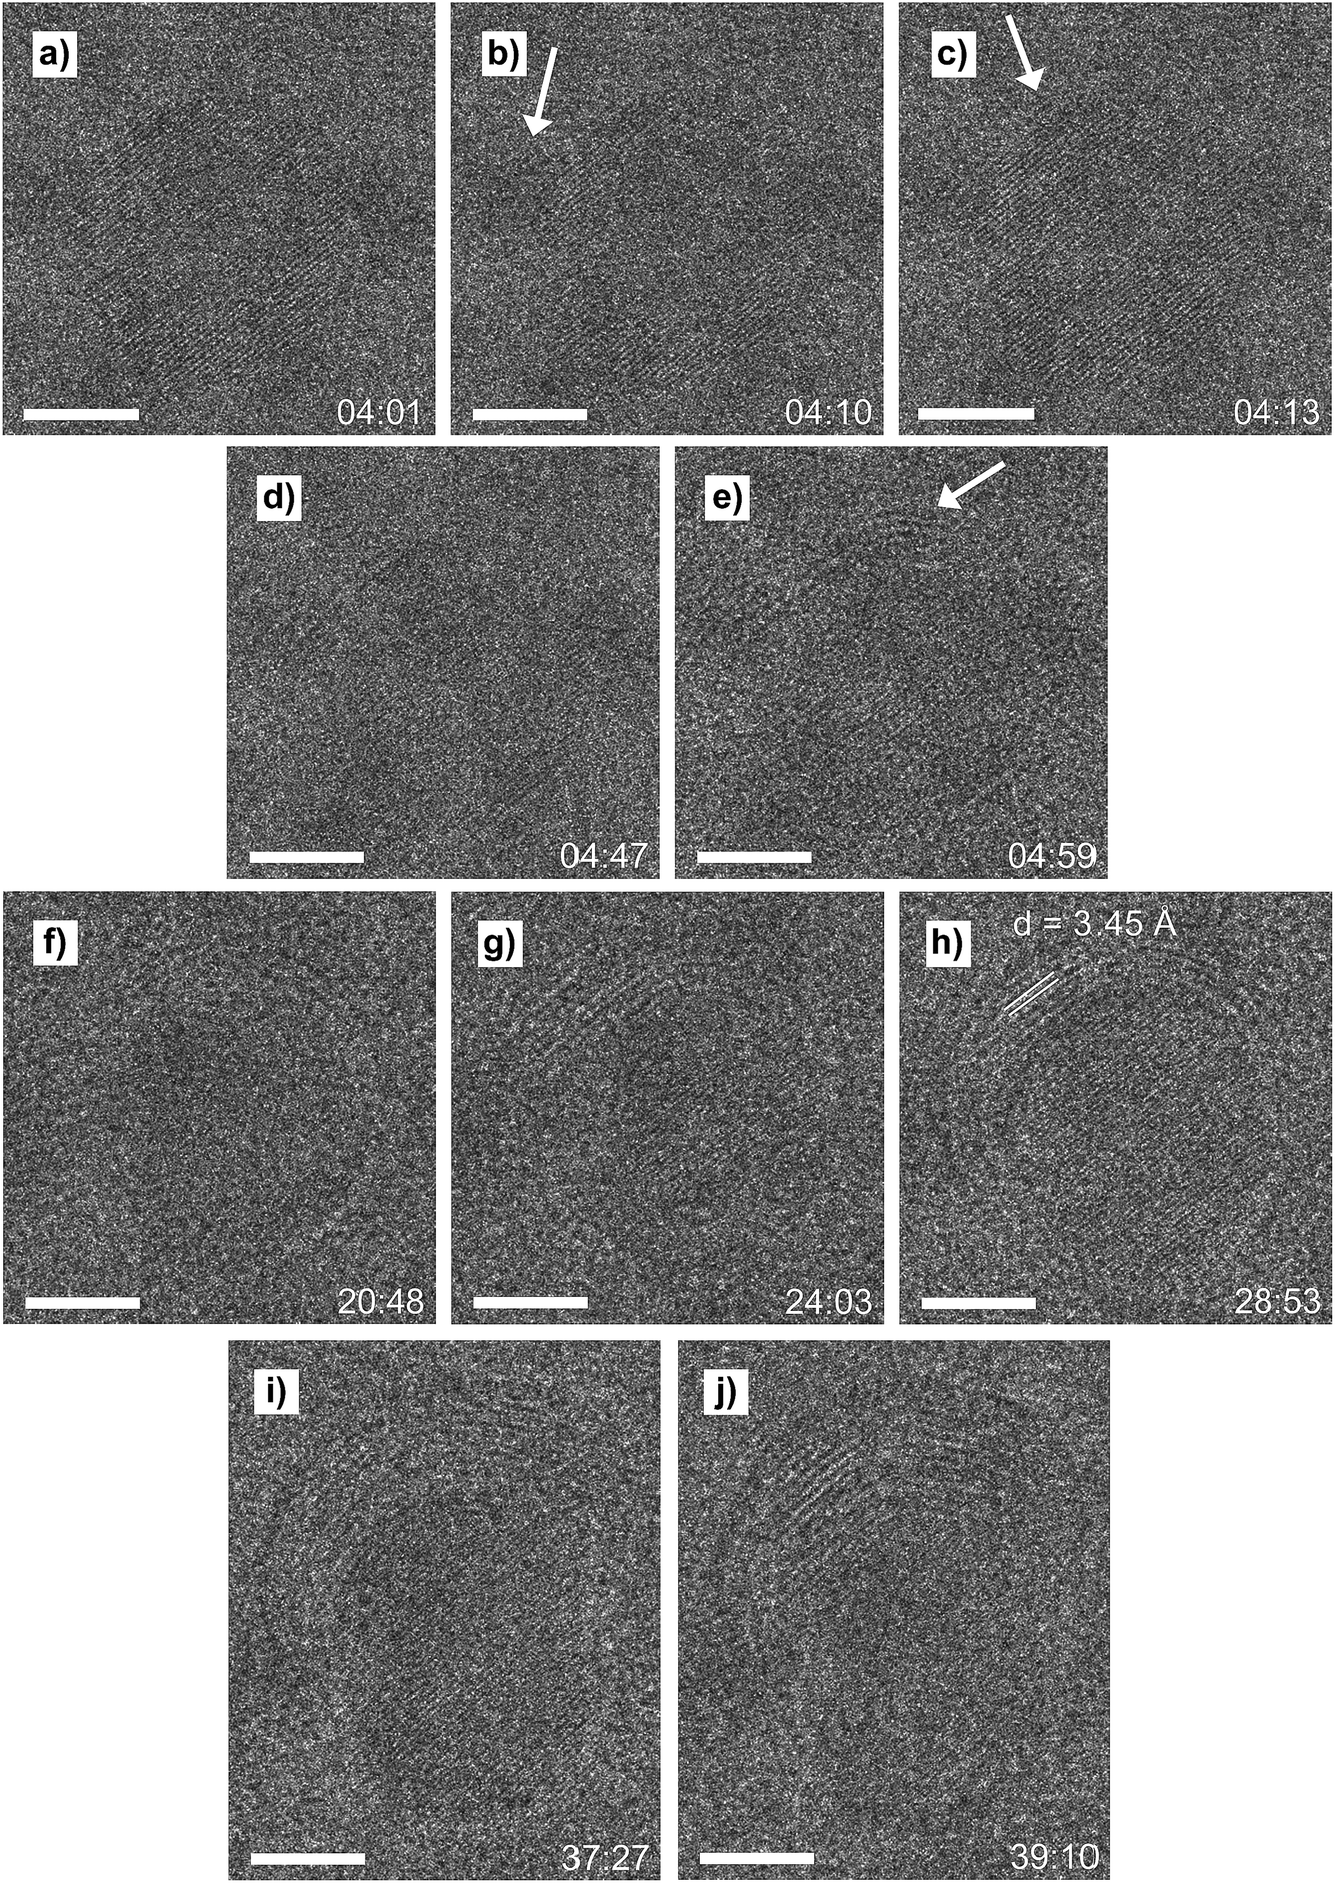 | ||
| Fig. 6 Carbon deposition process on a cobalt nanoparticle at 500 °C and 1 bar CO:N2 (1:1). An initially fresh nanoparticle (a) was covered by patches of carbon ((b and c), indicated by the white arrows) that then grew laterally and formed a first layer (d). A second layer formed ((e), indicated by the white arrow) and capped the nanoparticle (f). More carbon layers grew (g–i) until after 39 minutes the nanoparticle ended up it its final state (j), covered by around 10 layers of carbon. On each micrograph, the time since shutting off the H2 feed is indicated in minutes:seconds. Scale bar is 4 nm. | ||
The first carbon patches were formed at two sides of the nanoparticle surface (Fig. 6b and c, white arrows). The deposition of carbon could originate from either the dissociation of adsorbed CO molecules (eqn (1)) or via the Boudouard disproportionation reaction (eqn (2)).22,23
| COads → Cs + Oads | (1) |
| 2COads → CO2g + Cs | (2) |
Both reactions yield solid carbon at metal surfaces, but CO adsorption followed by dissociation occurs at temperatures up to around 400 °C, while the Boudouard reaction is facilitated at cobalt surfaces above 427 °C.22,23 Also, CO dissociation on cobalt leads to the formation of a single layer of carbidic carbon, while the Boudouard reaction can form multiple layers of graphitic carbon,22 which is what we observed in our experiment. The carbon–carbon interlayer distance of the carbon layers formed on our nanoparticles is 3.45 Å, Fig. 6h, indicating that graphitic carbon was indeed formed.24 We thus conclude that we have visualised the Boudouard reaction. Further evidence for assigning the Boudouard reaction as the cause for the observed carbon deposition could be embedded in the QMS signal, as the CO2 signal should rise as an effect of the formation of CO2 and C from CO. However, due to high background signals it was not possible during this experiment to draw any conclusions based on the QMS data.
The process of the formation of a new carbon layer, as shown in Fig. 7, was captured from t = 28:15. At this moment, there were nine carbon layers capping the cobalt nanoparticle. The next second, at 28:16, it was visible that the ensemble of nine layers was pushed up by a few Å. A new fringe appeared at the interlayer between the cobalt surface and the packet of carbon layers, indicating the formation of a new carbon layer. The new fringe is indicated by the black arrow in Fig. 7b. To facilitate interpretation of the weak contrast, a white arrow was drawn perpendicular to the visible d-spacing on the nanoparticle and the packet of carbon layers at the exact same positions in Fig. 7a and b. Contrast line profiles were obtained for both images, shown in Fig. 7c.
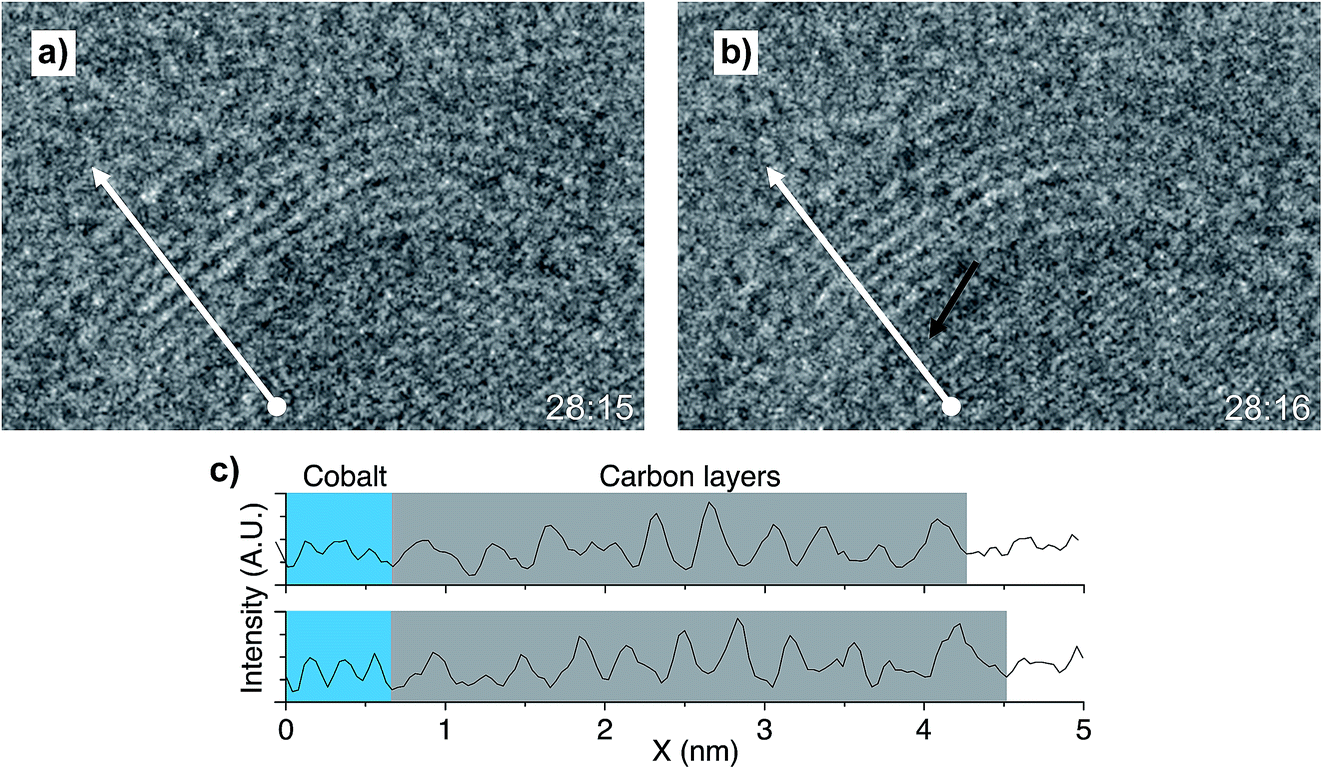 | ||
| Fig. 7 Growth of a new carbon layer, indicated by the black arrows, interlayered between the cobalt surface and the set of carbon layers capping the nanoparticle, before (a) and after (b) the formation. Profiles of the white lines are shown in (c). Top profile: image (a); bottom profile: image (b). White line length is 5 nm. | ||
By identifying the cobalt fringes (Fig. 7c, blue region, d-spacing 2.07 Å) and the carbon fringes (Fig. 7c, grey region, d-spacing 3.45 Å), it is clearly visible that the additional peak displaces the earlier formed carbon layers away from the cobalt nanoparticle surface, and the grey area expands by one lattice spacing of the carbon.
3.3 Effect on the nanoparticles
During the live observation of the growing layers, the nanoparticle was changing morphology. The initially spherical nanoparticle (Fig. 6a) became elongated at the end of the carbon deposition process (Fig. 6j). When the nanoparticle was covered with six carbon layers, the internal crystal structure was also temporarily altered, as shown in Fig. 8. At t = 25:26, the nanoparticle was still spherical (Fig. 8a), showing a uniform crystal structure. During the following ten seconds, the crystal structure shifted around and eventually a twin boundary was formed at t = 25:35 (Fig. 8b) in the centre of the nanoparticle. The crystal structure in the bottom right part of the nanoparticle continued showing mobility, and a second twin boundary appeared clearly at t = 25:57 (Fig. 8c). This situation was maintained for about 90 seconds. During that time the twin boundaries continuously shifted up and down several atomic rows. The top of the particle also showed a twin boundary for a few seconds, which was too mobile to be imaged clearly. After this period of twinning, the crystal structure of the nanoparticle became uniform again at t = 27:34 (Fig. 8d), which lasted until the end of the experiment.
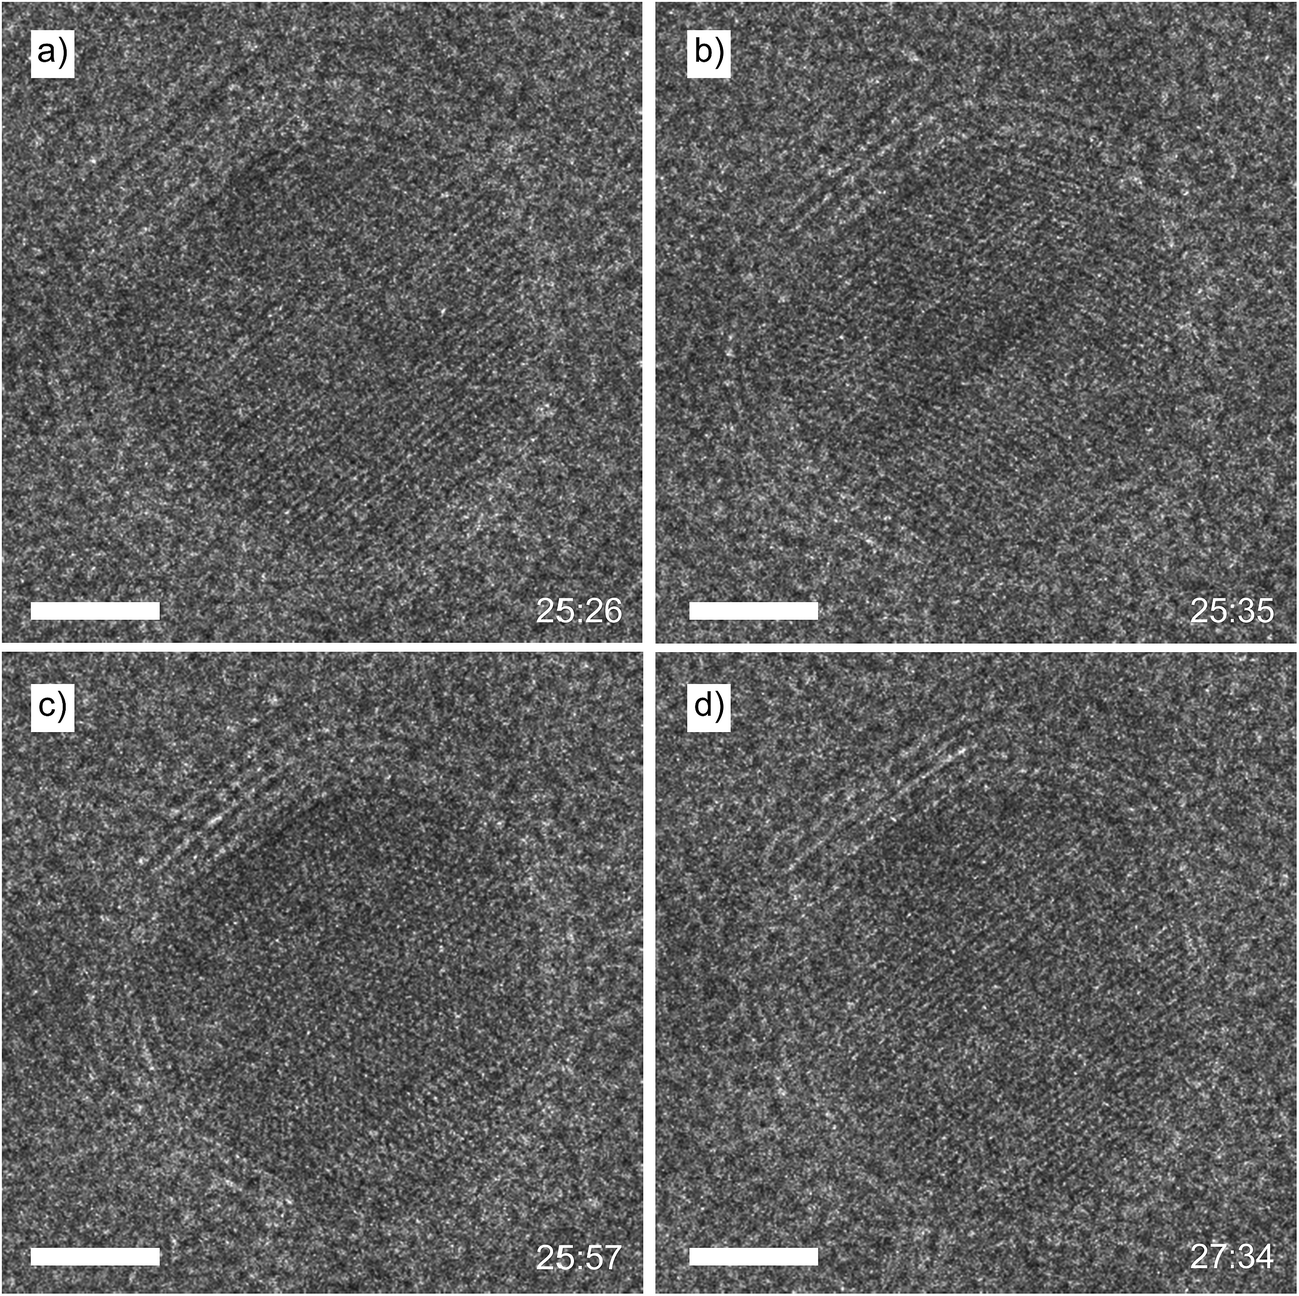 | ||
| Fig. 8 Cobalt nanoparticle, capped with six layers of carbon, initially showing a uniform crystal structure (a). A first twin boundary was formed through the centre of the nanoparticle (b), followed by a second twin boundary at the bottom right (c). After around 90 seconds of continuous mobility, the crystal structure relaxed into the final, uniform state (d). Scale bar is 3 nm. | ||
The presence of twin boundaries is related to the amount of stress inside the nanoparticle, as the formation of boundaries leads to the release of this stress25 and is known to occur in metallic nanoparticles.26–28 Metallic nanoparticles (e.g. Au, Co) encaged by carbon shells will eventually deform when heated to a temperature above 300 °C and irradiated with a TEM electron beam, as the electron beam displaces carbon atoms in the carbon shells, causing the shells to shrink.29–32 Similar deformation effects have been observed when carbon nanotubes were formed via CH4 decomposition on the surface of Ni nanoparticles.33 Our experiment showed a combination of both effects, as we initially started with uniform, crystalline nanoparticles, not covered by any graphite layers. Eventually, the growing carbon layers were capping just the top half of the nanoparticle. Due to continuous electron irradiation, the carbon must have been contracting and thereby compressing the capped particle. The formed strain was relieved by the formation of the twin boundaries. The initially spherical nanoparticle then deformed into an elongated shape, fitting inside the carbon cap and thereby releasing the twin boundaries to return to a uniform crystal structure.
3.4 Carbon morphologies
After continuously imaging the nanoparticle that showed the formation of the layers of carbon, other nanoparticles were imaged. Various other nanoparticles were also covered with layers of carbon, but not all of them. Around one third of all nanoparticles that were present on electron-transparent windows were encapsulated or covered with carbon. All carbon covered nanoparticles, independent of their size, supported carbon formations that consisted of around 7 to 14 layers of carbon. No trends could be established linking nanoparticle size to the number of layers. Different morphologies of carbon structures were visible: next to encapsulated nanoparticles also multi-walled carbon nanotube formations had been formed Fig. 9a, while other nanoparticles supported spherical structures Fig. 9b that did not cap the supporting nanoparticle as tightly as the previously imaged assembly Fig. 6. As the formation of the carbon layers shown in Fig. 9 occurred before any TEM imaging was done, we conclude that the carbon deposition is not induced by the TEM electron beam.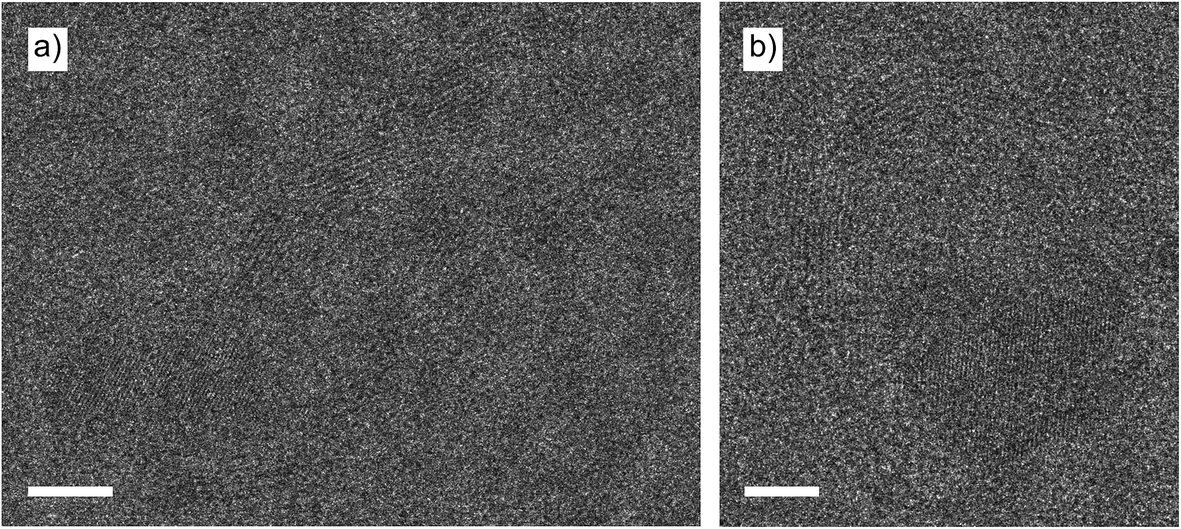 | ||
| Fig. 9 Cobalt nanoparticles supporting various shapes of carbon layers. (a) A multi-walled carbon nanotube, and (b) a spherical carbon formation loosely capping the supporting cobalt nanoparticle. Scale bar is 4 nm. | ||
Several of the imaged particles were stable under the electron beam. However, other particles showed shape deformation processes and formation of twin boundaries while being imaged. An example of a nanoparticle that was being deformed while imaged, after being encapsulated without electron beam irradiation, is shown in Fig. 10. When the nanoparticle was initially imaged (Fig. 10a), the shape was already heavily elongated at t = 0 (when TEM imaging started). After half a minute (Fig. 10b), the elongated particle started to slowly thin out in the centre, as the carbon shape around the particle was squeezing the nanoparticle. This process slowly continued (Fig. 10c) until finally at t = 1:19, the nanoparticle split into two separate particles (Fig. 10d). The carbon assembly continued to deform, thereby moving the two nanoparticles around. After around three minutes the system reached its final state (Fig. 10e).
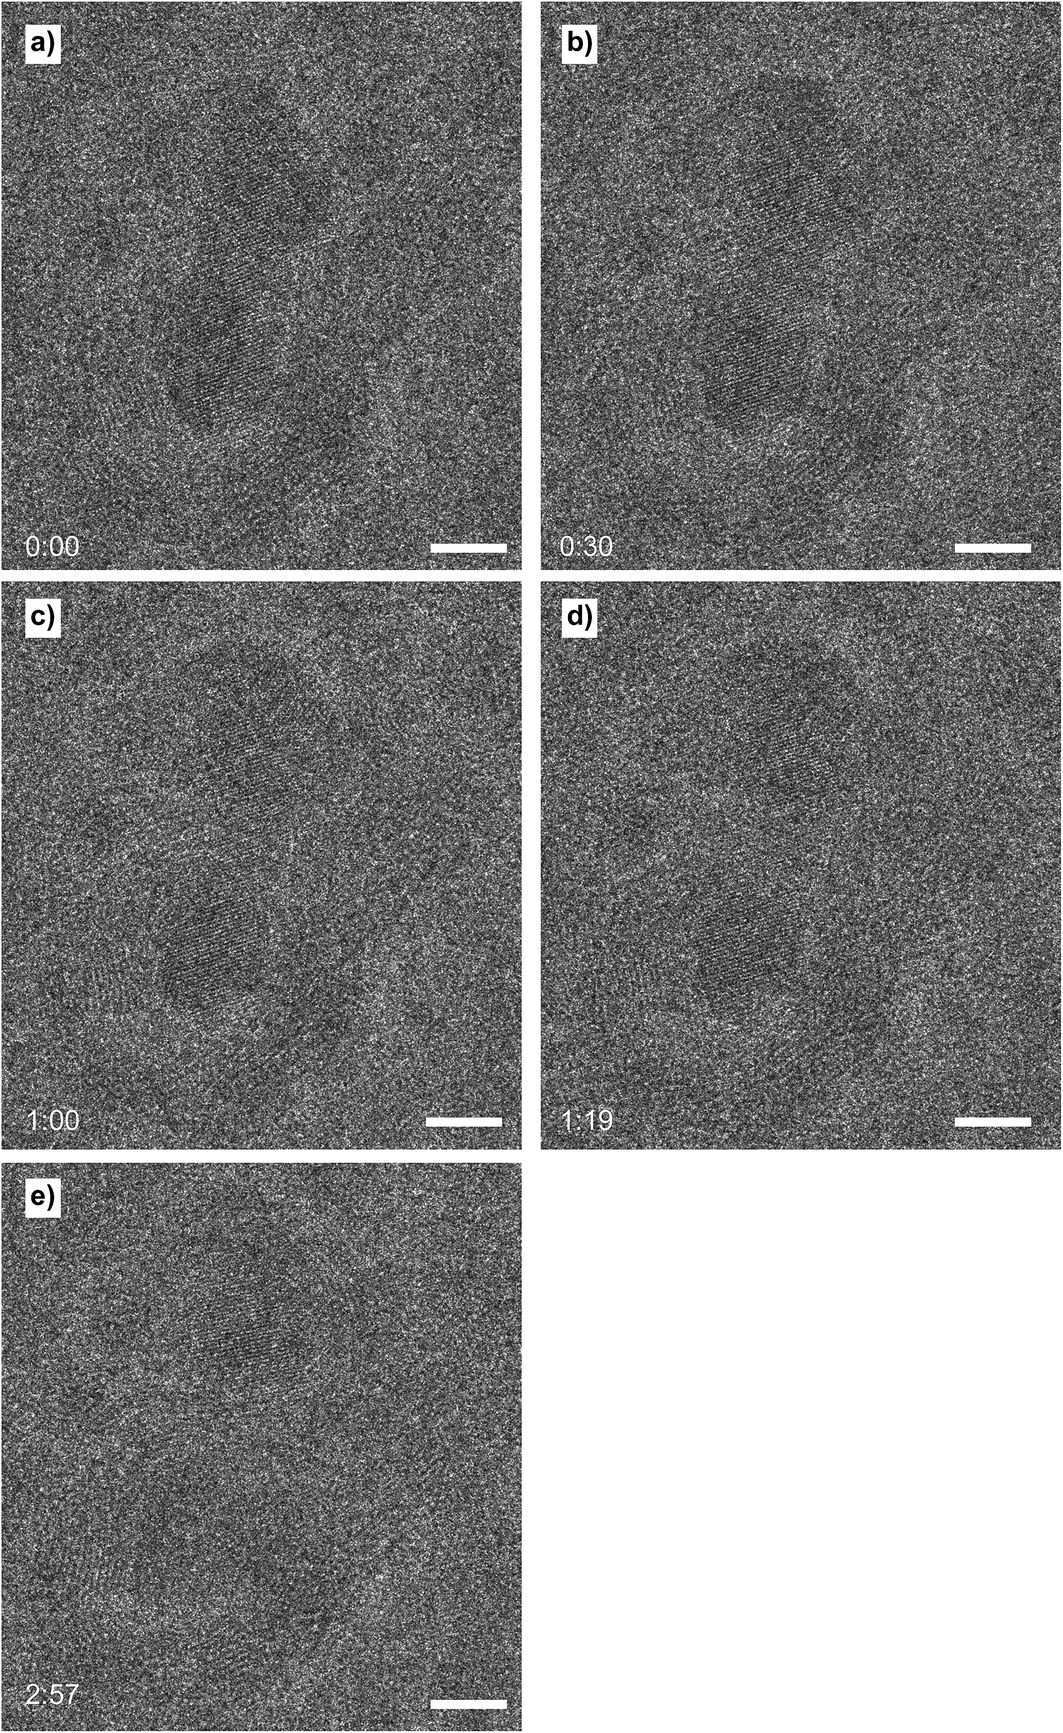 | ||
| Fig. 10 Cobalt nanoparticle encapsulated and deformed by an assembly of carbon layers (a). The nanoparticle was slowly squeezed by the surrounding carbon layers (b and c), leading to the splitting of the nanoparticle into two isolated particles (d). After further deformation of the carbon assembly surrounding the particles, the system reached the final, stable state (e). Scale bar is 4 nm. | ||
4. Conclusions and outlook
We have shown the in situ formation of layers of graphitic carbon on free-standing cobalt nanoparticles, at 500 °C and 1 bar CO:N2 (1:1). The nanoparticles were imaged using TEM, with a specially designed in situ TEM holder and MEMS nanoreactor devices. Reactant gases were added to the nanoreactor via a gas supply system, while a QMS analysed the product gas stream. Due to the high temperature and presence of CO gas, the Boudouard reaction led to the deposition of carbon and consequent formation of graphitic carbon on the cobalt nanoparticles.
During a 40 minute tracking period, a cobalt nanoparticle was covered and capped by layers of carbon, formed one by one at the interface of the nanoparticle surface and the carbon. The layers of carbon strained the nanoparticle. As a consequence, twin boundaries appeared until the nanoparticle was permanently deformed. Several other nanoparticles were imaged afterwards showed similar deformation behaviour.
Further measurements could provide additional evidence for the Boudouard reaction by revealing the formation of CO2 in the QMS data. The QMS data could also provide an indication whether all OA is fully removed from the surface of the nanoparticles, or if there is still OA present on the surface, however this is a topic for upcoming investigations.
Acknowledgements
This work was supported by The Netherlands Organization for Scientific Research (NWO/OCW) as part of the Frontiers of NanoScience (NanoFront) program. The research leading to these results has received funding from the European Union Seventh Framework Programme under Grant Agreement 312483 – ESTEEM2 (Integrated Infrastructure Initiative-I3). V. N. acknowledges NWO and the Technology Foundation (STW) for financial support as part of the Veni research programme (project no. 11920). We thank Prof. Dr H. W. Zandbergen and Dr Ir. F. D. Tichelaar (TU Delft) for their support in using the TEM hardware. We thank G. Pandraud and B. Morana (EKL) for supplying the nanoreactors.References
- A. Y. Khodakov, W. Chu and P. Fongarland, Advances in the Development of Novel Cobalt Fischer–Tropsch Catalysts for Synthesis of Long-Chain Hydrocarbons and Clean Fuels, Chem. Rev., 2007, 107(5), 1692–1744, DOI:10.1021/cr050972v.
- G. L. Bezemer, J. H. Bitter, H. P. C. E. Kuipers, H. Oosterbeek, J. E. Holewijn, X. Xu, F. Kapteijn, A. J. van Dillen and K. P. de Jong, Cobalt Particle Size Effects in the Fischer–Tropsch Reaction Studied with Carbon Nanofiber Supported Catalysts, J. Am. Chem. Soc., 2006, 128(12), 3956–3964, DOI:10.1021/ja058282w.
- V. Navarro, M. A. van Spronsen and J. W. M. Frenken, In Situ Observation of Self-Assembled Hydrocarbon Fischer–Tropsch Products on a Cobalt Catalyst, Nat. Chem., 2016, 8(10), 929–934, DOI:10.1038/nchem.2613.
- A. Banerjee, V. Navarro, J. W. M. Frenken, A. P. van Bavel, H. P. C. E. Kuipers and M. Saeys, Shape and Size of Cobalt Nanoislands Formed Spontaneously on Cobalt Terraces During Fischer–Tropsch Synthesis, J. Phys. Chem. Lett., 2016, 7(11), 1996–2001, DOI:10.1021/acs.jpclett.6b00555.
- B. Boeller, M. Ehrensperger and J. Wintterlin, In Situ Scanning Tunneling Microscopy of the Dissociation of CO on Co(0001), ACS Catal., 2015, 5(11), 6802–6806, DOI:10.1021/acscatal.5b01684.
- O. Ducreux, B. Rebours, J. Lynch, M. Roy-Auberger and D. Bazin, Microstructure of Supported Cobalt Fischer–Tropsch Catalysts, Oil Gas Sci. Technol., 2009, 64(1), 49–62, DOI:10.2516/ogst:2008039.
- S. Li, G. D. Meitzner and E. Iglesia, Structure and Site Evolution of Iron Oxide Catalyst Precursors During the Fischer–Tropsch Synthesis, J. Phys. Chem. B, 2001, 105(24), 5743–5750, DOI:10.1021/jp010288u.
- A. K. Tuxen, S. Carenco, M. Chintapalli, C.-H. Chuang, C. Escudero, E. Pach, P. Jiang, F. Borondics, B. Beberwyck and A. P. Alivisatos, et al., Size-Dependent Dissociation of Carbon Monoxide on Cobalt Nanoparticles, J. Am. Chem. Soc., 2013, 135(6), 2273–2278, DOI:10.1021/ja3105889.
- S. B. Vendelbo, C. F. Elkjær, H. Falsig, I. Puspitasari, P. Dona, L. Mele, B. Morana, B. J. Nelissen, R. van Rijn and J. F. Creemer, et al., Visualization of Oscillatory Behaviour of Pt Nanoparticles Catalysing CO Oxidation, Nat. Mater., 2014, 13(9), 884–890, DOI:10.1038/nmat4033.
- E. Zacharaki, M. Kalyva, H. Fjellvåg and A. O. Sjåstad, Burst Nucleation by Hot Injection for Size Controlled Synthesis of ε-Cobalt Nanoparticles, Chem. Cent. J., 2016, 10(1), 10, DOI:10.1186/s13065-016-0156-1.
- Website Else Kooi Laboratory, http://ekl.tudelft.nl/EKL/Home.php, Last consulted: 05-Sept-2016.
- J. F. Creemer, F. Santagata and B. Morana, An All-in-One Nanoreactor for High-Resolution Microscopy on Nanomaterials at High Pressures, J. Microelectromech. Syst., 2011, 1103–1106, DOI:10.1109/MEMSYS.2011.5734622.
- I. Puspitasari, P. Saputra, B. Morana, L. Mele, F. Santagata, J. F. Creemer, F. Kapteijn and P. Kooyman, Particle Imaging and Flow Visualization of In Situ TEM Nanoreactors, Microsc. Microanal., 2012, 18(S2), 740–741, DOI:10.1017/S1431927612005557.
- J. F. Creemer, S. Helveg, P. J. Kooyman, A. M. Molenbroek, H. Zandbergen and P. M. Sarro, A MEMS Reactor for Atomic-Scale Microscopy of Nanomaterials Under Industrially Relevant Conditions, J. Microelectromech. Syst., 2010, 19(2), 254–264, DOI:10.1109/JMEMS.2010.2041190.
- C. T. Herbschleb, P. C. van der Tuijn, S. B. Roobol, V. Navarro, J. W. Bakker, Q. Liu, D. Stoltz, M. E. Cañas-Ventura, G. Verdoes and M. A. van Spronsen, et al., The Reactor STM: Atomically Resolved Scanning Tunneling Microscopy Under High-Pressure, High-Temperature Catalytic Reaction Conditions, Rev. Sci. Instrum., 2014, 85(8), 083703, DOI:10.1063/1.4891811.
- C. E. H. Bawn, The Kinetics of the Decomposition of Nickel Carbonyl, Trans. Faraday Soc., 1935, 31, 440–446 RSC.
- W. M. Goldberger and D. F. Othmer, Kinetics of Nickel Carbonyl Formation, Ind. Eng. Chem. Process Des. Dev., 1963, 2(3), 202–209, DOI:10.1021/i260007a006.
- T. C. Williams and C. R. Shaddix, Contamination of Carbon Monoxide with Metal Carbonyls: Implications for Combustion Research, Combust. Sci. Technol., 2007, 179(6), 1225–1230, DOI:10.1080/00102200601057279.
- S. Roobol, The Structure of a Working Catalyst: From Flat Surfaces to Nanoparticles, PhD thesis, Leiden University, 2014, ISBN: 9789085932048.
- D. P. Dinega and M. G. Bawendi, A Solution-Phase Chemical Approach to a New Crystal Structure of Cobalt, Angew. Chem., Int. Ed. Engl., 1999, 38(12), 1788–1791, DOI:10.1002/(SICI)1521-3773(19990614)38.
- H. T. Yang, C. M. Shen, Y. G. Wang, Y. K. Su, T. H. Yang and H. J. Gao, Stable Cobalt Nanoparticles Passivated with Oleic Acid and Triphenylphosphine, Nanotechnology, 2004, 15(1), 70–74, DOI:10.1088/0957-4484/15/1/014.
- J. Nakamura, I. Toyoshima and K. Tanaka, Formation of Carbidic and Graphitic Carbon From CO on Polycrystalline Cobalt, Surf. Sci., 1988, 201(1–2), 185–194, DOI:10.1016/0039-6028(88)90605-X.
- F. L. Hutson, D. E. Ramaker and B. E. Koel, Spectroscopic Evidence for Carbon–Carbon Bonding in “Carbidic” Layers on Metals, Surf. Sci., 1991, 248(1–2), 104–118, DOI:10.1016/0039-6028(91)90065-Z.
- O. V. Kharissova and B. I. Kharisov, Variations of Interlayer Spacing in Carbon Nanotubes, RSC Adv., 2014, 4(58), 30807–30815, 10.1039/C4RA04201H.
- A. Mayoral, H. Barron, R. Estrada-Salas, A. Vazquez-Duran and M. José-Yacamán, Nanoparticle Stability From the Nano to the Meso Interval, Nanoscale, 2010, 2(3), 335–342, 10.1039/B9NR00287A.
- H. Hofmeister, Fivefold Twinned Nanoparticles, Encyclopedia of Nanoscience and Nanotechnology, American Scientific Publishers, 2004, ISBN: 1-58883-001-2 Search PubMed.
- A. S. Barnard, H. Konishi and H. F. Xu, Morphology Mapping of Platinum Catalysts Over the Entire Nanoscale, Catal. Sci. Technol., 2011, 1(8), 1440–1448, 10.1039/c1cy00238d.
- J. L. Elechiguerra, J. Reyes-Gasga and M. J. Yacaman, The Role of Twinning in Shape Evolution of Anisotropic Noble Metal Nanostructures, J. Mater. Chem., 2006, 16(40), 3906–3919, 10.1039/b607128g.
- L. Sun, J. A. Rodriguez-Manzo and F. Banhart, Elastic Deformation of Nanometer-Sized Metal Crystals in Graphitic Shells, Appl. Phys. Lett., 2006, 89(26), 263104, DOI:10.1063/1.2403898.
- L. Sun, A. V. Krasheninnikov, T. Ahlgren, K. Nordlund and F. Banhart, Plastic Deformation of Single Nanometer-Sized Crystals, Phys. Rev. Lett., 2008, 101(15), 156101, DOI:10.1103/PhysRevLett.101.156101.
- F. Banhart, J. X. Li and A. V. Krasheninnikov, Carbon Nanotubes Under Electron Irradiation: Stability of the Tubes and Their Action as Pipes for Atom Transport, Phys. Rev. B: Condens. Matter Mater. Phys., 2005, 71(24), 241408, DOI:10.1103/PhysRevB.71.241408.
- A. V. Krasheninnikov, P. O. Lehtinen, A. S. Foster and R. M. Nieminen, Bending the Rules: Contrasting Vacancy Energetics and Migration in Graphite and Carbon Nanotubes, Chem. Phys. Lett., 2006, 418(1–3), 132–136, DOI:10.1016/j.cplett.2005.10.106.
- S. Helveg, C. López-Cartes, J. Sehested, P. L. Hansen, B. S. Clausen, J. R. Rostrup-Nielsen, F. Abild-Pedersen and J. K. Nørskov, Atomic-Scale Imaging of Carbon Nanofibre Growth, Nature, 2004, 427(6973), 426–429, DOI:10.1038/nature02278.
| This journal is © The Royal Society of Chemistry 2017 |