Acute toxicity of graphene nanoplatelets on biological wastewater treatment process†
Hang N.
Nguyen
a,
Sarah L.
Castro-Wallace
b and
Debora F.
Rodrigues
 *a
*a
aDepartment of Civil and Environmental Engineering, University of Houston, Houston, TX 77204-4003, USA. E-mail: dfrigirodrigues@uh.edu; Tel: +1 713 743 1495
bNASA Johnson Space Center Microbiology Laboratory, Houston, TX 77058, USA
First published on 14th December 2016
Abstract
This study investigates the acute toxicity of graphene to sludge microbial communities. The acute toxicity was investigated with concentrations varying from low to relatively high concentrations of graphene (between 0 and 300 mg L−1) to understand the impact of different concentrations of graphene on the biological wastewater treatment process. The experiments were performed with a 10 h continuous aeration using batch reactors to simulate the wastewater biological treatment process. Results showed that increasing concentrations of graphene in the reactors led to decreasing COD, BOD5, ammonia and phosphate removals. In addition, abundances of ammonia oxidizing bacteria, ammonia monooxygenase and phosphate accumulating bacteria decreased along with the overall sludge microbial metabolic activity. The 16S rRNA deep sequencing of the sludge microbial community exposed to different concentrations of graphene showed that the abundances of the two most abundant phyla, i.e. Proteobacteria and Bacteriodetes, changed with increasing concentrations of graphene. The results also showed that releases of graphene concentrations at 10 mg L−1 and higher seem to present a short term impact in the wastewater treatment process.
Environmental significanceThe large market growth of graphene and graphene-based nanomaterials is indicative that more graphene will be consumed or produced by diverse industries in the coming years. The potential release of carbon-based nanomaterials and other nanoparticles in the environment by various industries will probably happen due to production, consumption and use of these nanomaterials. This study contributes for the body of knowledge of the impact of graphene nanomaterials in biological processes, such as biological treatment processes, if this nanomaterial is to be released to the environment. |
Introduction
Carbon-based nanomaterials are being intensively used in many applications in diverse fields. Among the carbon-based nanomaterials, graphene is the building block of graphitic materials, such as fullerenes, carbon nanotubes, graphene oxides, and graphite. Graphene consists of a monolayer of carbon atoms, arranged in a two-dimensional hexagonal lattice. It is stronger than steel, has high electrical conductivity and antimicrobial properties.1 Graphene nanomaterials have been used in broad applications, such as energy, automotive, aerospace, electronics, biomedical devices, cytotoxicity of tumour cell-lines and others therapeutic products.2In the next 10 years, it is estimated that $1.3 billion dollars will be spent in the development of new applications for graphene.3 Graphene's anticipated market will grow from $20 million to $390 million dollars from 2014 to 2024.4 This large market growth is indicative that more graphene will be consumed or produced by diverse industries in the coming years. Recent studies investigating the potential release of carbon based nanomaterials and other nanoparticles by various industries have indicated that release will happen due to consumption, reuse and production of these nanomaterials.5–7 These studies have raised the issue of the end-of-life of nanowastes due to increasing nanomaterial production and consumption.8 In these studies, different scenarios have been discussed on the potential release of these nanomaterials to the environment.9 The consensus is that the release of these nanomaterials will happened in the environment via soil, air or waterways, which will ultimately end up in wastewater treatment plants.10 Wastewater treatment plants have microbial communities involved in the biological treatment process that can be affected by toxic chemicals and nanomaterials. Graphene has known antimicrobial properties, however, little is known about the impact of graphene on wastewater treatment plants.11
Previous studies investigating other carbon-based nanomaterials showed that some of them can negatively impact wastewater treatment, at least temporarily. For instance, graphene oxide and carbon nanotubes were shown to be toxic to activated sludge.12–14 Another study stated that multi-walled carbon-nanotubes affected the nutrient removal and community structure of activated sludge.15 Hence, since graphene has been shown to have antimicrobial properties, and wastewater treatment is mainly a microbiological process, the impact of graphene in wastewater treatment needs to be investigated.
In the present study, acute toxicity of graphene, i.e. high concentrations of graphene for a short exposure time, was investigated using bioreactors to simulate the biological wastewater treatment process. This study presents the worst case scenario of graphene release to wastewater treatment plants, i.e. it simulates accidental spills and high concentration releases of this nanomaterial in the environment. The impact of graphene was determined by investigating the performance of nitrogen and phosphorous removal in the bioreactors. Acute toxicity of graphene in the abundances of ammonia oxidizing bacteria (AOB)16,17 and phosphate accumulating organisms (PAO) were also investigated in the sludge.18 Finally, the overall acute toxicity of graphene to the wastewater microbial community was determined using 16S rRNA gene deep sequencing analysis.
Materials and methods
Source of activated sludge
Activated sludge was collected directly from the aeration basin of the Sims South Bayou wastewater treatment plant (WWTP) (Houston, TX, USA). The activated sludge was collected in sterile Nalgene bottles, stored in a cooler containing ice, and transported to the laboratory immediately to start the experiments. The schematic flow of the treatment at the Sims South Bayou WWTP is described in Fig. S1.† The characteristics of the sludge collected for the experiments are presented in Table 1.| Parameters | Synthetic wastewater | Sims South |
|---|---|---|
| pH | 7.0 ± 0.5 | 7.2 ± 0.6 |
| Ammonia-nitrogen (NH3-N) (mg L−1) | 70 ± 2 | 5.38 ± 0.86 |
| Nitrate-nitrogen (NO3-N) (mg L−1) | 32 ± 1 | 23.4 ± 2.8 |
| Phosphate (mg L−1) | 40.7 ± 1.5 | 0.16 ± 0.06 |
| Chemical oxygen demand (COD) (mg L−1) | 673.7 ± 9.6 | 72 ± 1 |
Experimental design of batch reactors
Graphene nanoplatelets (grade C) were purchased from XG sciences, USA. Transmission electron microscopy (TEM), X-ray diffraction (XRD), atomic force microscopy (AFM), Raman and thermogravimetric analysis (TGA) characterizations of the nanomaterial are presented in the supporting information (Fig. S2†). The preparation of the graphene nanoplatelets for the experiments and methods used to characterize the nanomaterials were described in detail in our previously published study.11 Most of the chemicals used in this study were purchased from Sigma-Aldrich with purity >99%, unless stated otherwise. Synthetic wastewater was used as a feeding solution in all the bioreactor experiments. The synthetic wastewater consisted of mixing 100 mL solution A with 1900 mL solution B. These solutions were mixed just before use to obtain a fresh feeding solution.19 The solution A was prepared in 1 L of DI-water at pH 5.5 and contained NaCH3COO·3H2O (17.53 g), MgSO4 (0.49 g from EMD Millipore, U.S.A), CaCl2·H2O (0.45 g from Fisher, U.S.A), NH4Cl (3.3 g), Peptone (0.5 g) and 6 mL of nutrient solution. The nutrient solution contained a mixture of FeCl3 (0.9 g), H3BO3 (0.15 g), CuSO4·5H2O (0.03 g), KI (0.18 g from EMD Millipore, U.S.A), MnCl2·4H2O (0.12 g), Na2MoO4·2H2O (0.06 g), ZnCl2 (0.1 g), CoCl2·6H2O (0.15 g) and ethylenediamine tetraacetic acid (EDTA; 10 g). The solution B contained KH2PO4 (0.0285 g) and K2HPO4 (0.0325 g) in 1 L DI water, and its pH was adjusted to 10 using 10 M NaOH. Both solutions were autoclaved separately at 121 °C for 20 min. Characteristics of the synthetic wastewater are summarized in Table 1.After collection of the activated sludge, the sludge was settled for 30 min and then transferred to reactors with synthetic wastewater for acclimation at 22 °C. All reactors in this study were continuously mixed using a stir bar at 100 × g and air was introduced in the reactor through fine air bubbles with a flow of 0.5 LPM (Fisher air meter). The pH was monitored and maintained at 7.0 ± 0.5 throughout the experiments. A 4 L beaker was used as the main reactor for acclimation of the activated sludge. The beaker had an active volume of 3.2 L, which consisted of 2 L of synthetic wastewater and 1.2 L of activated sludge. The reactor was run for 44 h with a cycle every 10 to 11 h of settling, decanting, and feeding of 2 L of synthetic wastewater. This cycle was selected since this was the period required for the sludge to have an ammonia removal of 85–90%. Samples were taken every 3, 6 and 10 h for ammonia determination with a total of 4 cycles in this sludge acclimation period.
At the end of the acclimation period, the activated sludge in the main reactor was divided into five smaller reactors. The smaller bioreactors were set up with 200 mL of acclimated activated sludge and 1 L of synthetic wastewater. Each reactor was amended with the following graphene concentrations: 0, 1, 10, 100, and 300 mg L−1. The reactors were run simultaneously for 10 h. The aeration time of 10 h corresponds to the relative time for the activate sludge to remove 85% of ammonia in the control reactor (0 mg L−1 graphene).
The same acclimatization and experimental procedures with graphene were repeated three times to compare the reproducibility of the results of the reactors with sludge samples collected from the wastewater treatment plant at different time periods.
Analytical methods
During the simultaneous run of the five reactors, samples were taken from each reactor at times 0, 5 h and 10 h with 10 min settling time before ammonia (NH3-N), nitrate (NO3-N), phosphate (PO43−) and chemical oxygen demand (COD) analyses. All the analyses were done in triplicate using colorimetric methods (Hach, DR3900 spectrometer). The supernatant water (after 10 min settling) was immediately filtered using 0.2 μm pore size syringe filter (Corning filter) to remove particles. Mix-liquor was collected to determine the biological oxygen demand (BOD5) for all three periods. BOD5 was determined based on standard methods.20 All the analyses were done in triplicate, and the results were averaged out. The standard deviations were calculated and reported as well.Determination of microbial metabolic activity
The metabolic assay was done at the end of each run using the Vibrant Cell Metabolic Assay kit (Invitrogen, U.S.A.). The kit includes resazurin, a non-fluorescent dye, which is reduced by viable cells yielding resorufin, a highly fluorescent product. Samples containing 100 μL of mix-liquor were mixed with 60 μL of 10 μM resazurin in a 96-well black plate (Greiner, U.S.A.). After gentle mixing, the plate was incubated at 37 °C for 15 min in the dark, and the resorufin production was determined by measuring the fluorescence at 530/587 nm wavelength using a plate reader (Synergy MX Microplate reader, BioTek, U.S.A). The results were expressed as percentages to indicate the metabolically active cells following this formula: | (1) |
Microscopic observation of the interaction of graphene with sludge
Qualitative observation of the interaction of the sludge with graphene was done under a fluorescence microscope using the SYTO9 green-fluorescent stain (Invitrogen, U.S.A.). The following samples were observed under the microscope: 1 mL of graphene suspension, 1 ml of sludge (no graphene), and 1 ml of sludge containing 100 mg L−1 graphene. Then, 1 μL of SYTO9 was added to each tube. All the tubes were vortexed and incubated for 2 min at room temperature. The fluorescent images were taken using the BX 51 Olympus Fluorescence Microscope (Leeds Instrument Inc., USA) equipped with a DP72 digital camera under 40× objective and a fluoresceinisothiocyanate (FITC) filter.Polymerase chain reaction (PCR) and cloning
All PCR reactions in this study used the same procedure and reactions set-up. Briefly, triplicate PCR reactions of 25 μL for each sample were performed using 12.5 μL of 2× Amplitaq GoldFast PCR master-mix (Invitrogen, U.S.A.), 200 nM of reverse and forward primers, 0.125 μL of 0.1 ng μL−1 BSA, and 100 ng μL−1 of each DNA template in Applied Biosystems, Veriti 96-well thermal cycler with the thermal condition described in Table S1.† All the PCR products were confirmed by agarose gel electrophoresis using 1% agarose gel.The clones were generated from fresh PCR products using the extracted DNA from the WWTP activated sludge with specific primers for AOB, amoA and PAO gene. The TOPO TA cloning kit (Invitrogen, U.S.A.) was used to clone the PCR-amplified genes. Successful cloning of the genes was confirmed by PCR amplification with specific primers following the procedure suggested by the manufacturer. The agarose gel electrophoresis was used to determine whether the clones had the expected size of the AOB, amoA and PAO genes.
Sludge DNA extraction and real time PCR (RT-PCR)
Samples for DNA extraction were collected at times 0 h and after 10 h running the reactors. Aliquots of 2 mL of activated sludge were collected from each reactor, and centrifuged immediately at 22![[thin space (1/6-em)]](https://www.rsc.org/images/entities/char_2009.gif) 000 × g for 1 min. The total DNA extraction was conducted using PowerWater DNA isolation kit according to manufacturer's protocol (MoBio, U.S.A.). The concentrations of extracted DNA were quantified by the Take3 reader (Biotek, U.S.A.). Extracted DNA samples were kept at −20 °C until further experimentation.
000 × g for 1 min. The total DNA extraction was conducted using PowerWater DNA isolation kit according to manufacturer's protocol (MoBio, U.S.A.). The concentrations of extracted DNA were quantified by the Take3 reader (Biotek, U.S.A.). Extracted DNA samples were kept at −20 °C until further experimentation.
RT-PCR was performed using the StepOne Plus Real-Time PCR system (Applied Biosystems, U.S.A.) to quantify ammonia oxidizing bacteria (AOB), the ammonia monooxygenase gene (amoA), phosphate accumulating organisms (PAO) and the total bacterial population. Standard curves for quantification of these genes were generated using clones of the genes AOB, amoA and PAO prepared as described in the previous section. The genes cloned were cultivated at 37 °C overnight and freshly extracted for RT-PCR (QIAprep Spin, Qiagen, U.S.A.). The 16S rRNA genes were evaluated using the universal primers E8-F and E533-R with a standard curve generated from E. coli K12 DNA.21
The RT-PCR reaction contained 7.5 μL of 2× Power SYBR Green PCR master-mix (Invitrogen, U.S.A.), 0.6 μL of 0.1 ng μL−1 BSA, 1 μl of DNA template, and specific amounts of each primer as described in Table S1.† Sterile RNA/DNA free water was used to obtain a final reaction volume of 15 μL. The concentrations of the primers were optimized using the protocol described by the SYBR Green manufacturer. To prepare the standard curves, the plasmid copy numbers extracted for each cloned gene were initially calculated, using the formula below:22,23
 | (2) |
After determining the plasmid copy number extracted, dilutions of the plasmids were made to obtain concentrations ranging between 102 to 107 copies per μL. The Ct values corresponding to each dilution was used to plot the standard curves for each primer.
For each gene investigated, serial dilutions of each experimental sample, negative RT-PCR reaction controls containing no DNA template, and dilutions of the plasmid for the standard curve were run together in triplicate. The results were expressed in concentrations that were normalized to 1 ng of DNA template. Paired T-test analyses were performed to interpret the statistically significant (p ≤ 0.05) differences between each experimental and control reactors for each gene investigated.
16S rRNA gene amplification and deep sequencing
Amplicon preparation, library construction, and sequencing were carried out according to Illumina technical instructions (16S Metagenomic Sequencing Library Preparation Rev. B, Illumina, San Diego, CA). Briefly, a 460 bp amplicon spanning the V3–V4 region of the 16S rRNA gene was obtained using the forward S-D-Bact-0341-b-S-17 (5′-CCTACGGGNGGCWGCAG-3′) and reverse S-D-Bact-0785-a-A-21 (5′-GACTACHVGGGTATCTAATCC-3′) primers.24 The DNA was amplified following the protocol described in 16S Metagenomics sequencing library preparation in the Illumina protocol with the addition of one more holding stage at 98 °C for 20 s at the beginning of the thermal cycling. All the following steps, i.e. clean-up and index PCR followed the protocol from Illumina. The Illumina MiSeq Reagent Kit v3 (2 × 150 bp paired-end reads) was used to prepare the library and for sequencing, which were conducted at the NASA JSC Microbiology Laboratory (Johnson Space Center, Houston, TX). The data obtained was deposited in the NCBI database under the BioProject ID: PRJNA276567.Illumina MiSeq Reporter software was used for quality control, trimming, and mapping. The diversity of each consortium was determined using the 16S Metagenomics v1.0 application on Illumina's BaseSpace cloud-computing platform. Coverage of the species was determined by rarefaction curves generated by “iNEXT online: interpolation and extrapolation (Version 1.3.0)” software (http://glimmer.rstudio.com/tchsieh/inext/) (Fig. S6†).
Results and discussion
Impact of graphene on chemical parameters of the wastewater treatment
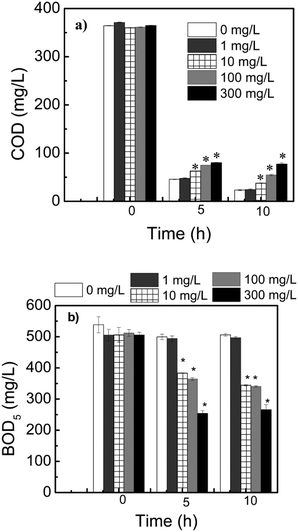
In this study, we investigated the effect of the presence of graphene in chemical oxygen demand (COD) and biochemical oxygen demand (BOD), which are important chemical parameters for the wastewater treatment. Overall, the presence of graphene in the sludge impacted all these parameters as shown in Fig. 1.The presence of graphene in the sludge had a direct impact on COD removal (Fig. 1a). In the case of COD, its removal was slightly inhibited with the presence of graphene. For instance, after exposing the reactors for 10 h to graphene, the COD removals were 93%, 90%, 85%, and 79% for 0, 10, 100 and 300 mg L−1 of graphene, respectively (Fig. 1a). These reductions were not observed in previous studies, where no significant effects of COD removals were observed with increasing concentrations of carbon nanotubes.13,25 However, this result is in agreement with a long-term exposure study with multi-walled carbon nanotubes (MWCNT) that also observed reduced COD removal.15 Hence, graphene, like MWCNT, can have a negative impact on the COD removal at concentrations higher than 10 mg L−1.
The acute effect of graphene to BOD was also investigated using the BOD5 assay. The assay allows us to determine the microorganism's capability to remove organic matter in the presence of oxygen.26 The results showed a reduction in BOD5 after 5 h exposure of the sludge to graphene (Fig. 1b). Furthermore, the impact of graphene was directly related to its concentration. For instance, there was a reduction in the wastewater BOD from 23% to 49% after exposure to graphene concentrations ranging from 10 to 300 mg L−1, respectively (Fig. 1b). On the other hand, there was no change in the wastewater BOD for the control and the wastewater exposed to 1 mg L−1. In the latter, the high BOD levels, which are typically observed in wastewater effluents, are due to the decline in dissolved oxygen (DO) levels caused by the high microbial oxygen demand in the wastewater. In the presence of antimicrobials in the water, such as graphene and chlorine, the BOD will typically be smaller, since there will be not as many active microorganisms to decompose the organic matter and consume oxygen. Previous studies with carbon-based nanomaterials, such as graphite, graphene and graphene oxide showed similar trend. These materials were shown to be toxic to bacteria in either pure culture or activated sludge when the nanomaterial concentrations increased.14,27,28 Besides the concentration effect, the time exposure of graphene to the sludge, i.e. 5 h and 10 h, also affected the level of graphene toxicity. The time dependency of graphene toxicity was more apparent in the concentration of 300 mg L−1 (Fig. 1a).
This overall low BOD in the sludge in the presence of graphene suggested that graphene could be affecting the microbial metabolic activity during biodegradation of the organic matter and other biological processes. Further investigation of the metabolic activity of graphene showed that graphene with concentrations ranging from 10 to 300 mg L−1 presented about 24% to 98% metabolic activity reduction, respectively (Fig. 2). Further microscopic investigation of the interaction of graphene with the sludge showed that graphene is able to interact with the sludge flocs (Fig. 3). This direct interaction of the graphene with the sludge would explain the negative impact of graphene in the sludge metabolic activity.
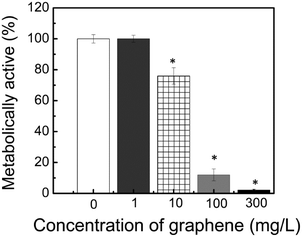 | ||
| Fig. 2 Metabolic activity assay of activated sludge with different concentrations of graphene. *Statistically significant different results compared to control samples (0 mg L−1) (p ≤ 0.05). | ||
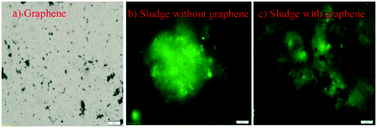 | ||
| Fig. 3 Microscopic images of interactions between activated sludge and graphene (G) (100 mg L−1). Scale bar at 20 μm. | ||
It is worth to note that no significant changes in microbial metabolic activity, BOD and COD was observed in the reactors containing 1 mg L−1 of graphene (Fig. 1). These results suggest that acute toxicity can lead to reduced microbial metabolic activity and that graphene at concentrations higher than 1 mg L−1 can impact the wastewater treatment chemical parameters.
Acute toxicity of graphene on the wastewater biological processes
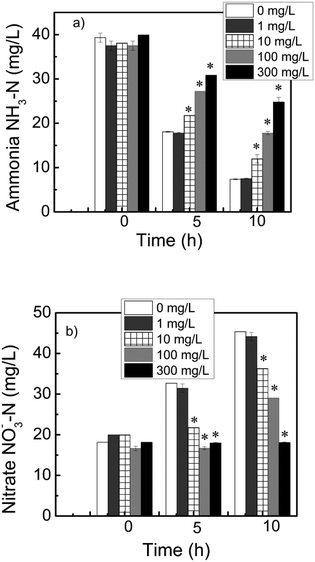
The reduced metabolic activity results suggest that other biological process for wastewater treatment could be in jeopardy, such as phosphorous and nitrogen removal. In wastewater, nitrogen and phosphorus need to be removed because of eutrophication effects and human health problems.29 The removal of these compounds require microbial communities present in the sludge, such as ammonia oxidizing bacteria (AOB) and polyphosphate accumulating organisms (PAO). During microbial activity, under aerobic conditions, ammonia is converted to nitrate, and phosphate is removed and accumulated intracellularly by PAO.The results showed that the ammonia removals in the control and in 1 mg L−1 graphene reactors were 54% and 53% after 5 h of incubation and 81% and 80% after 10 h, respectively. When the graphene concentrations were 10, 100, and 300 mg L−1, the ammonia removals after 5 h were 43%, 27%, and 23%; and after 10 h, they were 69%, 53%, and 38%, respectively (Fig. 4a). Based on these results, the 300 mg L−1 of graphene exhibited the highest toxicity to the nitrifiers. To confirm the reduced ammonia transformation to nitrate, we measured the amount of nitrate produced by the activated sludge. The results showed no significant increase in nitrate concentrations in the reactor having 300 mg L−1 of graphene, even after 10 h (Fig. 4b). This indicated that the ammonia oxidation decreased, since nitrate was not produced from the activity of ammonia oxidizing microorganisms.
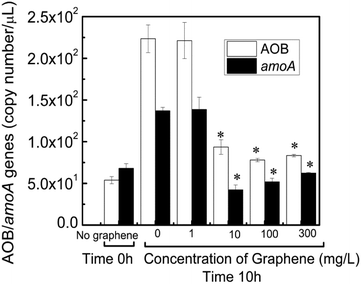
The ammonia-oxidizing bacteria (AOB) population abundance in the sludge exposed or not to graphene was further investigated by real-time PCR. Two genes were investigated to determine the abundance and activity of AOB: the conserved region of the 16S rRNA gene for AOB and the amoA gene. The amoA gene encodes the active site of ammonia monooxygenase, an enzyme unique to nitrifying bacteria.30 The initial inoculated activated sludge in the reactors (time 0 h) had a concentration of 54 AOB gene copies per μL. The gene copies increased to 224 and 221 copies per μL for 0 and 1 mg L−1 after 10 h running reactors with freshly prepared synthetic wastewater media, respectively (Fig. 5). A similar trend was also observed for the amoA gene copies that were 69 copies per μL and increased to 137 and 139 copies per μL for 0 and 1 mg μL−1 of graphene, respectively. These results indicate that at low graphene concentrations, i.e. 1 mg L−1, and short time exposure (10 h) the AOB population is not affected (Fig. 5). On the other hand, the reactors with concentrations of graphene of 10, 100 and 300 mg L−1 exhibited 58%, 65% and 63% lower concentrations of AOB gene copies and 69, 62 and 56% reduction in the amoA copy numbers in comparison to the control reactors after 10 h of contact with graphene (Fig. 5). Clearly, the presence of graphene impacted the AOB cell growth in the bioreactors, which resulted in lower ammonia removal as observed in Fig. 4.
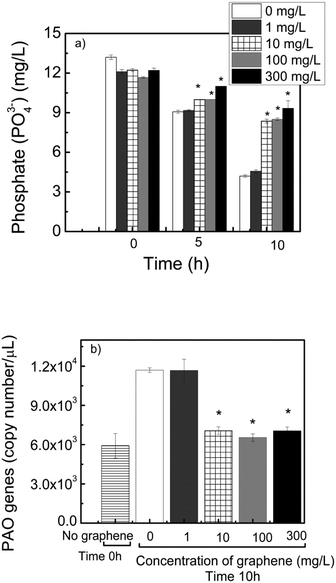
In the case of phosphate, inhibition of the activity of PAO microorganisms will lead to accumulation of phosphate in the effluent, instead of phosphate removal. The removal of phosphate by the control reactors were 31% and 68% after 5 h and 10 h incubation (Fig. 6a). For the reactor containing 300 mg L−1 of graphene, only 10% and 23% removals were observed after 5 h and 10 h incubation, respectively. The abundance of PAO was also determined after 10 h running the reactor. The gene copies for PAO in the reactors with 10, 100 and 300 mg L−1 graphene were 41% less than the control reactors (Fig. 6b). These results suggest that graphene can inhibit the PAO activity in the activated sludge, and thus prevent the removal of phosphate during wastewater treatment.
Similar results were observed in a previous acute toxicity study of activated sludge with graphene oxide. In this study, nutrient removal was increasingly inhibited with increasing concentrations of graphene oxide in the activated sludge.14 This nutrient inhibition trend, however, is not true for all carbon-based nanomaterials since another acute toxicity study with MWCNT on activated sludge did not present any significant change in nutrient removal.15 This difference in nutrient removal could be explained by the different antimicrobial properties of MWCNT and graphene. For instance, MWCNT does not display strong short-term antimicrobial activity.31 Graphene, on the other hand, has been shown to have antimicrobial property in less than 1 h exposure.11 In previous studies, the antimicrobial effects of graphene have been associated to production of reactive oxygen species, nanomaterial large surface area, and sharp edges.32,33 The small size of the graphene used in this study (less than 100 nm) could be one of the reasons for the strong antimicrobial activity observed in the AOB and PAO sludge communities.
Changes in the sludge microbial community exposed to graphene
Besides looking at the impact of acute toxicity of graphene in specific microbial communities, i.e. AOB and PAO, we also investigated the effects of graphene in the total bacterial community abundance and composition. The change in abundance of the eubacterial community was determined by real-time PCR with universal primers for the 16S rRNA gene. Increasing concentrations of graphene resulted in reduced concentrations of 16S rRNA gene copies from 39% to 49% in concentrations ranging between 10 and 300 mg L−1 after 10 h exposure, respectively (Fig. 7). This trend was not observed in the control and in the reactor with 1 mg L−1 of graphene, which presented an increase in the concentration of gene copies (Fig. 7). These results suggest that in these reactors the microbial community is growing over time. These results corroborate well the findings for the PAO and AOB microbial communities.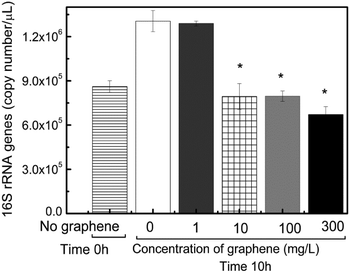 | ||
| Fig. 7 Change in the total microbial community abundance in the reactors with different concentrations of graphene at initial exposure (before addition of graphene) and after 10 h. | ||
In order to investigate the overall changes in the sludge microbial community structure, 16S rRNA gene deep sequencing was performed with the Illumina MiSeq. The Basespace cloud system showed that there were 2![[thin space (1/6-em)]](https://www.rsc.org/images/entities/char_2009.gif) 216
216![[thin space (1/6-em)]](https://www.rsc.org/images/entities/char_2009.gif) 142 effective reads, after filtering out the low-quality reads. The reads identified to the genus level accounted 40% of all reads. There were 1486 operational taxonomic units (OTUs) identified at the species-level.
142 effective reads, after filtering out the low-quality reads. The reads identified to the genus level accounted 40% of all reads. There were 1486 operational taxonomic units (OTUs) identified at the species-level.
In all reactors, Proteobacteria was the predominant phylum with 57 to 60% of the total bacterial sequences identified (Fig. S4†). Other dominant phyla were Bacteroidetes (18 to 24%), Firmicutes (4 to 5%), Verrucomicrobia (4 to 5%), and Actinobacteria (2 to 3%). The dominance of Proteobacteria, Bacteroidetes and Actinobacteria were similar to a previous report investigating the sludge microbial community exposed to MWCNT.15
In the reactors, the phyla Bacteroidetes and Proteobacteria were the most affected by the presence of graphene in the sludge (Fig. S4†). In the phylum Proteobacteria, the Beta-proteobacteria was the most abundant class in all samples at time 0 h and in the samples having 0 and 1 mg L−1 of graphene. This class includes ammonia-oxidizing genera.34 In the reactors containing graphene, the Beta-proteobacteria class decreased when compared to the control reactor (Fig. S5†). The decreasing number of microorganisms in this class would explain the reduction in ammonia removal rates observed earlier (Fig. 4a).35
In the case of Bacteriodetes, the classes most affected were Sphingobacteriia and Flavobacteriia (Fig. S5†). These two classes are commonly found in wastewater treatment plants and they are involved especially in protein degradation.36,37 In the reactors containing graphene, both these classes decreased in abundance. The reduction of these classes could explain the lower BOD and COD removals. In the case of Flavobacteriia, which contains the genera Flavobacterium, this class has been reported to participate in formation of flocs in the sludge. Hence, reduced abundance in this class could potentially affect the wastewater treatment settling process.38
At the genus level (Fig. 8), some important genera involved in the wastewater treatment from the Proteobacteria and Bacteroidetes phyla changed in the presence of graphene. For instance, the genera most affected were Dechloromonas, Curvibacter, Rubrivivax, Pedobacter, Zoogloea, and Flavobacterium. (Fig. 8) Among these genera, Dechloromonas has been described to promote removal of phosphate removal in biological reactors.39 Besides being involved with phosphate removal, Dechloromonas and Curvibacter have also been described to reduce perchlorate in bioreactors.40,41 In the presence of graphene, the levels of these genera went below the detection limit of the deep sequencing method. This result, i.e. the significant reduction of Dechloromonas in the reactor, is consistent with the lower removal of phosphate in the presence of graphene (Fig. 6).
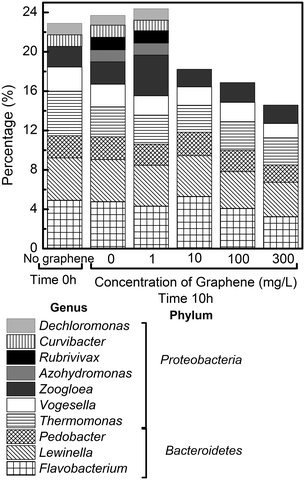 | ||
| Fig. 8 Abundance of predominant genera identified in the reactors. The abundance is expressed in terms of percentage of total effective sequences in each reactor (excluding unclassified genera). | ||
Rubrivivax and Pedobacter, on the other hand, have been associated with COD and BOD removals.42,43 The reduction of these genera is consistent with the decrease in COD removal observed in the present study (Fig. 1a). In the case of the Zoogloea and Flavobacterium, both genera decreased in the presence of graphene (Fig. 8). Both genera have been reported to be abundant in heavy metal polluted sewage samples.44Zoogloea have also been reported to be resistant and have heavy metal biosorption capabilities.45 Furthermore, species of Zoogloea have been widely reported in activated sludge, and to play an important role in the flocculation of activated sludge.46,47 Therefore, the decrease of Zoogloea in the reactors containing graphene would potentially reduce the sludge settling ability.
Both Zoogloea and Flavobacterium have been previously reported to be sensitive to nanoparticles, such as silver, titanium dioxide and zinc, hence it is not surprising that it is also sensitive to graphene.45,48Flavobacterium was shown to not be resistant to nano-Ag, but to be resistant to silver ions.48 Clearly both of these genera are not resistant to graphene, since the presence of graphene reduced their presence in the reactors (Fig. 8). Many other species have also been shown to be affected by the presence of graphene at 10 mg L−1 or higher (Fig. S4†), but it is still unclear their role in the wastewater treatment process and therefore they are not discussed in this study.
Based on the results of the microbial community structure, it is clear that different species of microorganisms presented different sensitivity to the graphene nanoplatelets in the sludge. Previous studies, investigating the toxicity of graphene and graphene oxide with different microorganisms in pure cultures, showed that not all microorganisms are sensitive or get inactivated in the presence of graphene.4,49 These studies suggested that the different susceptibilities of microorganisms to nanomaterials are due to different cell-wall structures and other intrinsic physiological resistance mechanisms.50 Other studies have also suggested that the presence of graphene based nanomaterials presented different toxicity levels to Gram (−) and Gram (+) bacteria, even though these microbes were exposed to the same concentrations of the nanomaterial.51,52 Hence, the different toxicological effects of graphene observed with different groups of microorganisms in the sludge is not surprising, since clearly not all microorganisms will respond similarly to toxic compounds in the environment.53–55
Conclusions
This study aimed to determine the acute toxicity of different concentrations of graphene to the microbial community involved in the wastewater biological treatment process. The results showed significant effects on the chemical and biological parameters of the reactors in the presence of graphene at 10 mg L−1 or higher concentrations. The changes in the biological parameters of the wastewater treatment in the presence of graphene was further confirmed by investigating the changes in abundance of AOB and PAO communities and the total microbial community. Results also showed that the graphene acute toxicity led to significant reduction of the microbial community metabolic activity, which in return reduced BOD, nitrogen and phosphorous removals. Additionally, the presence of graphene led to significant changes in the sludge microbial community structure. The deep sequencing analyses showed that several important genera involved in the wastewater treatment process were no longer detected in the reactor when graphene was present, probably because they were below the detection limit of our number of sequencing reads. The concentrations of graphene impacting the wastewater biological treatment process were overall smaller than the ones observed for GO and MWCNTs, which suggest that graphene can be more deleterious to the wastewater treatment process than other carbon-based nanomaterials. It is important to highlight, however, that the relatively high concentration of graphene necessary to impact the wastewater treatment process (concentrations higher than 10 mg L−1) suggest that the impact of graphene in wastewater treatment will most likely happen in waste streams from industries or manufacturers of graphene and carbon-based nanocomposites or in case of accidental spills of this nanomaterial. Besides this acute toxicity study, chronic studies still need to be performed to complement this study and give us a better understanding of the long term effects of this nanomaterial in wastewater treatment processes. These chronic studies should be done for longer periods of time and under smaller concentrations of graphene to simulate real release of nanomaterials from consumer products. Such studies would determine whether exposure to lower concentrations of graphene for long periods of time would lead to potential adaptation of the microbial community to the presence of this nanomaterial, as previously observed with several other environmental contaminants.Acknowledgements
This project was supported by the NSF Career Award Nanohealth #104093. The authors would like to acknowledge Douglas J. Botkin for training Hang to use the Miseq. Hang also would like to thank Kelly Hainline, an undergraduate student participating in the UH Research experience of undergraduates.References
- I. Childres, L. A. Jauregui, W. Park, H. Cao and Y. P. Chen, Developments in photon and materials research, 2013, pp. 978–971 Search PubMed.
- E. L. K. Chng and M. Pumera, RSC Adv., 2015, 5, 3074–3080 RSC.
- A. A. LLP, Global Graphene Market (Product Type, Application, Geography) – Size, Share, Global Trends, Company Profiles, Demand, Insights, Analysis, Research, Report, Opportunities, Segmentation and Forecast, 2013–2020, http://www.researchandmarkets.com/research/5jf4sm/global_graphene, (accessed 11/24/2014, 2014) Search PubMed.
- S. C. Smith and D. F. Rodrigues, Carbon, 2015, 91, 122–143 CrossRef CAS.
- A. R. Köhler, C. Som, A. Helland and F. Gottschalk, J. Cleaner Prod., 2008, 16, 927–937 CrossRef.
- C. Kingston, R. Zepp, A. Andrady, D. Boverhof, R. Fehir, D. Hawkins, J. Roberts, P. Sayre, B. Shelton, Y. Sultan, V. Vejins and W. Wohlleben, Carbon, 2014, 68, 33–57 CrossRef CAS.
- S. A. Blaser, M. Scheringer, M. MacLeod and K. Hungerbühler, Sci. Total Environ., 2008, 390, 396–409 CrossRef CAS PubMed.
- G. Bystrzejewska-Piotrowska, J. Golimowski and P. L. Urban, Waste Manage., 2009, 29, 2587–2595 CrossRef CAS PubMed.
- B. Nowack, R. M. David, H. Fissan, H. Morris, J. A. Shatkin, M. Stintz, R. Zepp and D. Brouwer, Environ. Int., 2013, 59, 1–11 CrossRef CAS PubMed.
- I. Chowdhury, M. C. Duch, N. D. Mansukhani, M. C. Hersam and D. Bouchard, Environ. Sci. Technol., 2013, 47, 6288–6296 CrossRef CAS PubMed.
- C. M. Santos, J. Mangadlao, F. Ahmed, A. Leon, R. C. Advincula and D. F. Rodrigues, Nanotechnology, 2012, 23, 395101 CrossRef PubMed.
- L. A. Luongo and X. J. Zhang, J. Hazard. Mater., 2010, 178, 356–362 CrossRef CAS PubMed.
- Y. Yin and X. Zhang, Water Sci. Technol., 2008, 58, 623–628 CrossRef CAS PubMed.
- F. Ahmed and D. F. Rodrigues, J. Hazard. Mater., 2013, 256, 33–39 CrossRef PubMed.
- R. Hai, Y. Wang, X. Wang, Z. Du and Y. Li, PLoS One, 2014, 9, e107345 Search PubMed.
- G. F. Wells, H. D. Park, C. H. Yeung, B. Eggleston, C. A. Francis and C. S. Criddle, Environ. Microbiol., 2009, 11, 2310–2328 CrossRef CAS PubMed.
- T. Limpiyakorn, F. Kurisu and O. Yagi, Water Sci. Technol., 2006, 54, 91–99 CrossRef CAS PubMed.
- S. He, D. L. Gall and K. D. McMahon, Appl. Environ. Microbiol., 2007, 73, 5865–5874 CrossRef CAS PubMed.
- R. J. Zeng, R. Lemaire, Z. Yuan and J. Keller, Biotechnol. Bioeng., 2003, 84, 170–178 CrossRef CAS PubMed.
- APHA, Standard methods for the examination of water and wastewater, American Public Health Association-AWWA-WEF, Washington, D.C., 2005 Search PubMed.
- S. Mao, R. Zhang, D. Wang and W. Zhu, BMC Vet. Res., 2012, 8, 237 CrossRef PubMed.
- J. A. Whelan, N. B. Russell and M. A. Whelan, J. Immunol. Methods, 2003, 278, 261–269 CrossRef CAS PubMed.
- D. F. Rodrigues and J. M. Tiedje, FEMS Microbiol. Ecol., 2007, 59, 489–499 CrossRef CAS PubMed.
- A. Klindworth, E. Pruesse, T. Schweer, J. Peplies, C. Quast, M. Horn and F. O. Glockner, Nucleic Acids Res., 2013, 41, e1 CrossRef CAS PubMed.
- Y. Yin, X. Zhang, J. Graham and L. Luongo, J. Environ. Sci. Health, Part A: Toxic/Hazard. Subst. Environ. Eng., 2009, 44, 661–665 CrossRef CAS PubMed.
- G. Tchobanoglous, F. T. Burton and H. D. Stensel, Wastewater Engineering: Treatment and Reuse, Metcalf & Eddy, McGraw-Hill, New York, 4th edn, 2003 Search PubMed.
- S. Liu, T. H. Zeng, M. Hofmann, E. Burcombe, J. Wei, R. Jiang, J. Kong and Y. Chen, ACS Nano, 2011, 5, 6971–6980 CrossRef CAS PubMed.
- O. Akhavan and E. Ghaderi, ACS Nano, 2010, 4, 5731–5736 CrossRef CAS PubMed.
- H. Wang, C.-C. Huang, Y. Ge, J. zhi Wu and J. Chang, Pol. J. Environ. Stud., 2014, 23, 917–922 CAS.
- J. H. Rotthauwe, K. P. Witzel and W. Liesack, Appl. Environ. Microbiol., 1997, 63, 4704–4712 CAS.
- L. R. Arias and L. Yang, Langmuir, 2009, 25, 3003–3012 CrossRef CAS PubMed.
- E. L. Chng and M. Pumera, Chemistry, 2012, 18, 1401–1407 CrossRef CAS PubMed.
- V. C. Sanchez, A. Jachak, R. H. Hurt and A. B. Kane, Chem. Res. Toxicol., 2012, 25, 15–34 CrossRef CAS PubMed.
- H. Dang, J. Li, R. Chen, L. Wang, L. Guo, Z. Zhang and M. G. Klotz, Appl. Environ. Microbiol., 2010, 76, 4691–4702 CrossRef CAS PubMed.
- U. Purkhold, M. Wagner, G. Timmermann, A. Pommerening-Röser and H.-P. Koops, Int. J. Syst. Evol. Microbiol., 2003, 53, 1485–1494 CrossRef CAS PubMed.
- R. Haiyan, J. Shulan, N. ud din Ahmad, W. Dao and C. Chengwu, Chemosphere, 2007, 66, 340–346 CrossRef PubMed.
- E. L. W. Sack, P. W. J. J. van der Wielen and D. van der Kooij, Appl. Environ. Microbiol., 2014, 80, 2360–2371 CrossRef PubMed.
- A.-J. Li, S.-F. Yang, X.-Y. Li and J.-D. Gu, Water Res., 2008, 42, 3552–3560 CrossRef CAS PubMed.
- Y. Liu, T. Zhang and H. H. Fang, Bioresour. Technol., 2005, 96, 1205–1214 CrossRef CAS PubMed.
- L. A. Achenbach, U. Michaelidou, R. A. Bruce, J. Fryman and J. D. Coates, Int. J. Syst. Evol. Microbiol., 2001, 51, 527–533 CrossRef CAS PubMed.
- X. Li, W. Yuen, E. Morgenroth and L. Raskin, Appl. Microbiol. Biotechnol., 2012, 96, 815–827 CrossRef CAS PubMed.
- L. Faust, M. Szendy, C. M. Plugge, P. F. H. van den Brink, H. Temmink and H. H. M. Rijnaarts, Appl. Microbiol. Biotechnol., 2015, 1–11 Search PubMed.
- P. Wu, J.-Z. Li, Y.-L. Wang, Q.-Y. Tong, X.-S. Liu, C. Du and N. Li, Bioprocess Biosyst. Eng., 2015, 38, 79–84 CrossRef CAS PubMed.
- F. B. Dilek and C. F. Gökçay, Water Sci. Technol., 1996, 34, 183–191 CrossRef CAS.
- J. Chen, Y.-Q. Tang, Y. Li, Y. Nie, L. Hou, X.-Q. Li and X.-L. Wu, Chemosphere, 2014, 104, 141–148 CrossRef CAS PubMed.
- R. A. Rosselló-Mora, M. Wagner, R. Amann and K.-H. Schleifer, Appl. Environ. Microbiol., 1995, 61, 702–707 Search PubMed.
- T. Zhang, M.-F. Shao and L. Ye, ISME J., 2012, 6, 1137–1147 CrossRef CAS PubMed.
- Y. Ma, J. W. Metch, E. P. Vejerano, I. J. Miller, E. C. Leon, L. C. Marr, P. J. Vikesland and A. Pruden, Water Res., 2015, 68, 87–97 CrossRef CAS PubMed.
- I. E. Mejias Carpio, J. D. Mangadlao, H. N. Nguyen, R. C. Advincula and D. F. Rodrigues, Carbon, 2014, 77, 289–301 CrossRef CAS.
- Y. L. F. Musico, C. M. Santos, M. L. P. Dalida and D. F. Rodrigues, ACS Sustainable Chem. Eng., 2014, 2, 1559–1565 CrossRef CAS.
- J. Peña-Bahamonde, V. San Miguel, H. N. Nguyen, R. Ozisik, D. F. Rodrigues and J. C. Cabanelas, Carbon, 2017, 111, 258–268 CrossRef.
- I. E. Mejias Carpio, C. M. Santos, X. Wei and D. F. Rodrigues, Nanoscale, 2012, 4, 4746–4756 RSC.
- S. C. Smith and D. F. Rodrigues, J. Biorem. Biodegrad., 2013, 4, e129 Search PubMed.
- D. F. Rodrigues, D. P. Jaisi and M. Elimelech, Environ. Sci. Technol., 2013, 47, 625–633 CrossRef CAS PubMed.
- D. F. Rodrigues, S. K. Sakata, J. V. Comasseto, M. C. Bicego and V. H. Pellizari, J. Appl. Microbiol., 2009, 106, 1304–1314 CrossRef CAS PubMed.
Footnote |
| † Electronic supplementary information (ESI) available: The supporting information contains additional figures and tables. See DOI: 10.1039/c6en00442c |
| This journal is © The Royal Society of Chemistry 2017 |

