
 Open Access Article
 This Open Access Article is licensed under a
 Creative Commons Attribution 3.0 Unported Licence
On verdigris, part I: synthesis, crystal structure solution and characterisation of the 1–2–0 phase (Cu3(CH3COO)2(OH)4)†
Sebastian
Bette
 *a,
Reinhard K.
Kremer
a,
Gerhard
Eggert
b,
Chiu C.
Tang
c and
Robert E.
Dinnebier
a
*a,
Reinhard K.
Kremer
a,
Gerhard
Eggert
b,
Chiu C.
Tang
c and
Robert E.
Dinnebier
a
aMax Planck Institute for Solid State Research, Heisenbergstr. 1, 70569 Stuttgart, Germany. E-mail: S.Bette@fkf.mpg.de
bState Academy of Art and Design, Am Weißenhof 1, 70191 Stuttgart, Germany
cHigh Resolution Powder Diffraction Beamline (I11), Diamond Light Source Ltd, Harwell Science and Innovation Campus, Didcot, Oxfordshire, OX11 0DE, UK
First published on 17th October 2017
Abstract
Known synthesis approaches for basic copper(II) acetates, the main components of historic verdrigis pigments were reinvestigated and revealed to be partially irreproducible. A modification of the reaction conditions led to the successful and reproducible synthesis of the 1–2–0 phase (Cu3(CH3COO)2(OH)4 = 1Cu(CH3COO)2·2Cu(OH)2·0H2O). The phase composition was derived from elemental and thermal analysis and confirmed by the crystal structure solution using synchrotron X-ray powder diffraction (XRPD) data. The 1–2–0 phase crystallises in space group Pbca with lattice parameters of a = 20.9742(1) Å, b = 7.2076(1) Å, and c = 13.1220(1) Å. The crystal structure consists of Cu2(CH3-COO)2(OH)4/3(OH)2/21/3− dimers, which are interconnected by corner sharing Cu(OH)2/3(OH)2/21/3+ squares forming layers perpendicular to the a-axis. The deep blue color of the solid originates from a reflectance maximum at 472 nm and from an absorbance maximum at 676 nm that is comparable with other historic blue pigments like azurite or Egyptian blue. IR- and Raman-spectroscopic properties of the solid were investigated as well, which demonstrated that the obtained product is identical with a previously synthesised verdigris phase that was obtained by applying historical procedures. Therefore, our reference data for the title compound will help to improve the understanding of the multiphase mixtures occurring in historic verdigris samples. The magnetic properties of the 1–2–0 phase were also investigated. At low temperatures the magnetic susceptibility is well described by a spin-1/2 Heisenberg chain with uniform antiferromagnetic nearest-neighbour spin exchange coupling of only one of three Cu magnetic moments. Due to the very strong antiferromagnetic coupling of the Cu2(CH3-COO)2(OH)4/3(OH)2/21/3− dimers their contribution to magnetism becomes relevant above ∼140 K, which results in the presence of two distinct temperature regions where Curie–Weiss behaviour of the magnetic susceptibility with different Curie constants and Weiss temperatures is found.
Introduction
“Verdigris” is a collective term for green and blue painting pigments that have been used since antiquity. Often, these pigments were produced by the corrosion of copper metal in acetic containing atmosphere (Fig. 1b) or by chemical conversion of copper minerals.1 During the Middle Ages and the modern period blue and green copper(II)-acetate based pigments became also known as “Grünspan” (German term), “verdet” (French term) and “vert-de-gris” (French term).2 They were frequently used by the Old Masters, e.g. by Raphael for the green coat of Saint John in the Mond Crucifixion (Fig. 1a) painted ca. 1502/3.3 These pigments were classified into two groups: neutral and basic verdigris. Neutral verdigris is also denoted as crystallized or distilled verdigris and basically refers to Cu(CH3COO)2·H2O. The identification of basic verdigris is much more complicated as this term refers to a group of copper(II)-acetate hydroxide salts, also known as “basic copper(II)-acetates”, which are distinguished and denoted according to their chemical composition: xCu(CH3COO)2·yCu(OH)2·zH2O ≡ x–y–z phase. Several of these phases were identified during numerous synthetic attempts which were inspired by ancient recipes for verdigris synthesis (Table 1).1,2,4–6 Nevertheless, the majority of the basic copper(II)-acetates remains poorly characterised as most approaches led to multiphase mixtures or poorly crystalline solids or the purity of an obtained basic copper acetate could not be proven unambiguously as the phase characterisation led to contradictory results. For instance, San Andrés et al.7 replicated a recipe from the medieval recipe collection Mappae clavicula by exposing sheet copper for 6 months at 40 °C in a closed container to vapours of vinegar. After drying at least three phases could be detected in the blue and green corrosion products: neutral verdigris and the 1–3–2 phase could be identified as XRD reference data are published, another basic acetate (according to the vibrational spectra) evaded identification. This emphasises the need for reference data for the pure x–y–z phases, the overall goal of our project.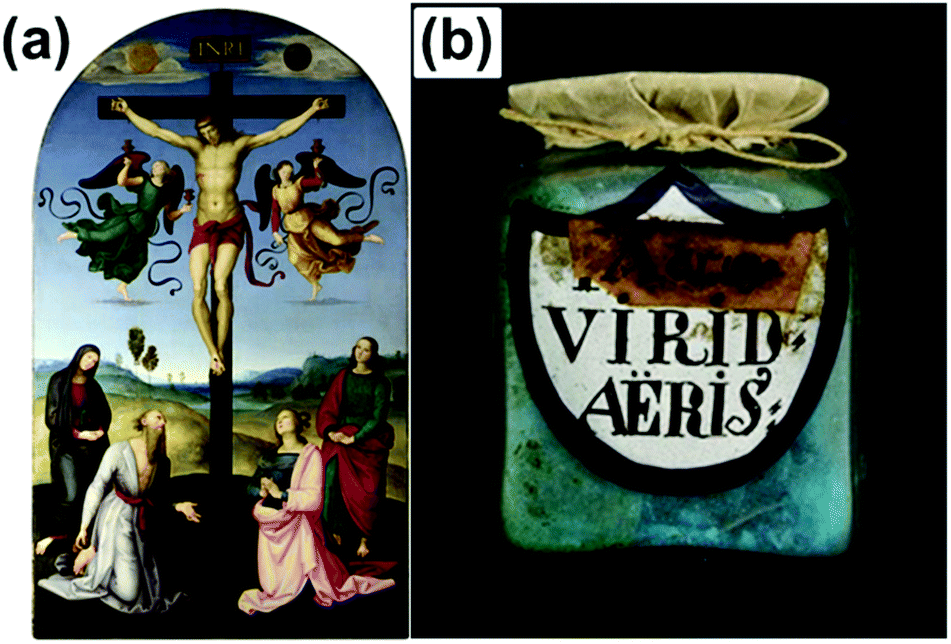 | ||
| Fig. 1 (a) The Crucified Christ with the Virgin Mary, Saints and Angels (The Mond Crucifixion). The green robe of Saint John the Evangelist (standing to the right of the cross) consists ‘of translucent deep green verdigris glazes, virtually undiscoloured, over a more solid dark green underlayer, also containing verdigris with some lead-tin yellow and white’3 bound in linseed oil. © National Gallery London, (b) historic pigment vessel, labelled with “Aerugo”, which means copper rust and “viride aeris” which means copper green. | ||
| Chemical formula/x–y–z notation | Characterization |
|---|---|
| ↔ indicates a contradiction in the literature. | |
| Cu3(CH3COO)4(OH)2·5H2O/2–1–5 phase | XRPD1,5 (no pdf-card17), Raman-spectroscopy,6 morphology: brush like,1 color: green,5,6 blue-green1 |
| Cu2(CH3COO)2(OH)2·5H2O/1–1–5 phase | XRPD1,2 (no pdf-card17), Raman-spectroscopy,6 morphology: fine fibres,1 color light blue,2 greenish6 ↔ blue-green1 |
| Cu3(CH3COO)2(OH)4/1–2–0 phase | XRPD1,2,5 (no pdf-card17), TG-DTA,5 IR5- and Raman-spectroscopy,6 morphology: prismatic,1 color: light blue,5,6 pale turquoise1 |
| Cu5(CH3COO)2(OH)8·3H2O/1–4–3 phase | XRPD5 (no pdf-card17), IR-spetroscopy,5 color: blue5 |
| Cu2(CH3COO)(OH)3·H2O/1–3–2 phase | XRPD1,2,5,8,11,16,18,20,22 (pdf-cards17: 00-058-0183, 00-056-0407), XPS,18 EXAFS,8 TG-DTA,8,18,22 IR-spetroscopy,8,12,18,20 Raman-spectroscopy,7 UV/VIS-spectroscopy8 SQUID-measurements,16,18 morphology: flat shaped rods11,20 ↔ hexagonal plates,8,22 color: green2,5,11 ↔ light green blue1,8,16,18,20 |
| Cu2(CH3COO)(OH)3/1–3–0 phase | XRPD18 (no pdf-card17) |
Besides their relevance as pigments, basic copper salts attract broad scientific interests as materials for anion exchangers,8–11 heterogeneous catalysis11 and due to their tuneable magnetic properties.12–16 These investigations, however, were focused only on Cu2(CH3COO)(OH)3·H2O ≡ 1Cu(CH3COO)2·3Cu(OH)2·2H2O ≡ 1–3–2 phase, which is therefore the only copper(II)-acetate phase that can be considered as “well characterised” (Table 1). Reference data for phase identification by X-ray powder diffraction (XRPD) can be found in the PDF-database17 (pdf-cards: 00-058-0183, 00-056-0407). The atomic structure of the 1–3–2 phase was derived from the crystal structure of botallackite (one polymorph of Cu2Cl(OH)3)11 and from EXAFS inevestigations.8 Detailed structural models of this phase were obtained from XRPD data,18 molecular dynamics simulations19 and from X-ray single crystal diffraction.20,21 The authors report on a pronounced occurrence of structural disorder appearing as stacking faults in the 1–3–2 phase, that impeded the structure solution.18,20 This can explain the differences in the structure model derived from powder and single crystal diffraction data, in the reported crystal morphologies8,11,20,22 and color of the solid (Table 1), in the lattice parameters derived from the XRPD data22 and in the analysed phase composition that has been also determined as Cu2(CH3COO)0.9(OH)3.1·0.7H2O.22
Basic copper(II)-acetates can be synthesised in aqueous solution by refluxing a Cu(CH3COO)2-solution20 or incomplete precipitation using NaOH,2,8,11,18,22 NH3(aq)![[thin space (1/6-em)]](https://www.rsc.org/images/entities/char_2009.gif) 2,5,6 or Ca(OH)2.4 The 2–1–5 phase was obtained from a warm (60 °C to 90 °C), concentrated Cu(CH3COO)2 solution immediately after adding NH3 as precipitating agent.1,2,4–6 By adding a diluted NaOH-solution (1.4 M) to a 0.4 M Cu(CH3COO)2 solution at room temperature and aging the suspension for 4 days the 1–1–5 phase was obtained.1,2,6 Rahn-Koltermann et al.,5 however, report that this approach yields only Cu(CH3COO)2·H2O. The authors obtained the 1–4–3 phase after the addition of NH3(aq) to 0.3 M Cu(CH3COO)2(aq) at room temperature after 6 months of aging. This approach, however, has not been successfully reproduced, yet. The synthesis of the 1–3–2 phase was reported at 60 °C in concentrated Cu(CH3COO)2 solution20 by using NaOH18 or NH3(aq)2,5 as precipitation agent. Thermal dehydration of this basic copper(II)-acetate phase leads to the formation of a 1–3–0 phase18 that cannot be obtained from aqueous solutions. Schweizer & Muehlethaler2 report that the 1–2–0 phase is formed after aging of the 1–3–2 phase in its mother liquor at 60 °C, which indicates that the latter phase is thermodynamically metastable. This has not been observed by other researchers, so far. Instead a direct synthesis of the 1–2–0 phase is described by adding a small amount of NH3(aq) to a vast excess of warm, concentrated (ca. 0.66 m) Cu(CH3COO)2 solution.5,6 Data on the thermodynamically stability of basic copper(II)-acetates, which are essential for the assessment of the resistivity of the green and blue pigments against deterioration by humidity or heat, have been only reported very rudimentarily, yet.1
2,5,6 or Ca(OH)2.4 The 2–1–5 phase was obtained from a warm (60 °C to 90 °C), concentrated Cu(CH3COO)2 solution immediately after adding NH3 as precipitating agent.1,2,4–6 By adding a diluted NaOH-solution (1.4 M) to a 0.4 M Cu(CH3COO)2 solution at room temperature and aging the suspension for 4 days the 1–1–5 phase was obtained.1,2,6 Rahn-Koltermann et al.,5 however, report that this approach yields only Cu(CH3COO)2·H2O. The authors obtained the 1–4–3 phase after the addition of NH3(aq) to 0.3 M Cu(CH3COO)2(aq) at room temperature after 6 months of aging. This approach, however, has not been successfully reproduced, yet. The synthesis of the 1–3–2 phase was reported at 60 °C in concentrated Cu(CH3COO)2 solution20 by using NaOH18 or NH3(aq)2,5 as precipitation agent. Thermal dehydration of this basic copper(II)-acetate phase leads to the formation of a 1–3–0 phase18 that cannot be obtained from aqueous solutions. Schweizer & Muehlethaler2 report that the 1–2–0 phase is formed after aging of the 1–3–2 phase in its mother liquor at 60 °C, which indicates that the latter phase is thermodynamically metastable. This has not been observed by other researchers, so far. Instead a direct synthesis of the 1–2–0 phase is described by adding a small amount of NH3(aq) to a vast excess of warm, concentrated (ca. 0.66 m) Cu(CH3COO)2 solution.5,6 Data on the thermodynamically stability of basic copper(II)-acetates, which are essential for the assessment of the resistivity of the green and blue pigments against deterioration by humidity or heat, have been only reported very rudimentarily, yet.1
In order to complete the knowledge on the formation, stability, properties and crystal structures of basic copper(II)-acetates we reproduced the synthesis procedures given by Rahn-Koltermann et al.5 as closely as possible. After carefully analyses of the obtained products, we modified the proposed procedures and succeeded in synthesizing pure Cu3(CH3COO)2(OH)4 (1–2–0 phase). The thermal behaviour, as well as the spectral and magnetic properties of Cu3(CH3COO)2(OH)4 were investigated and the crystal structure was solved from synchrotron XRPD data. In addition, the phase formation and stability in the ternary system Cu(CH3COO)2–Cu(OH)2–H2O was investigated by systematic conversion of Cu(OH)2 in aqueous copper(II)-acetate solution at 60 °C.
Experimental section
Reproduction of published synthesis of verdrigis phases
As a starting point an attempt was made to reproduce the syntheses of four different basic copper acetates: the 1–2–0 phase, the 2–1–5 phase, the 1–3–2 phase and the 1–4–3 phase, which were described by Rahn-Koltermann et al.51–2–0 phase (Cu3(CH3COO)2(OH)4)
100 g Cu(CH3COO)2·H2O (Merck, p.A.) were dissolved in 750 g deionized water at 75 °C yielding a 0.66 m Cu(CH3COO)2(aq) solution. While stirring 3 mL NH3(aq) (24 wt%) were added dropwise. The formation of a precipitate could not be observed. The solution was filtered off, anyway, to reproduce the synthesis of Rahn-Kolterman et al.5 exactly. Afterwards the solution was cooled down to 40 °C and stored for 64 h. After 48 h the formation of deep blue crystals could be observed. As the product turned out to be Cu(CH3COO)2·H2O the synthesis was adopted to the temperature dependent solubility of Cu(CH3COO)2 in water.23 Therefore 50 g Cu(CH3COO)2·H2O were dissolved in 585 g deionized water at 75 °C yielding a 0.43 m Cu(CH3COO)2(aq) solution. The procedure described above was repeated using 1.6 mL NH3(aq) (24 wt%). After 64 h of aging at 40 °C no precipitate was formed.2–1–5 phase (Cu3(CH3COO)4(OH)2·5H2O)
11.7 g Cu(CH3COO)2·H2O were dissolved in 88.3 g deionized water at 70 °C yielding 0.65 m Cu(CH3COO)2(aq) solution. While stirring 3 mL NH3(aq) (24 wt%) were added dropwise within 8 min. A turquoise precipitate formed immediately that was filtered off. Adherent mother liquor was removed by suspending the solid in cold (T < 4 °C), deionized water, two times and subsequent washing with cold (T < 4 °C) ethanol. The product was dried at room temperature.1–3–2 phase (Cu2(CH3COO)(OH)3·H2O) and 1–4–3 phase (Cu5(CH3COO)2(OH)8·3H2O)
6.0 g Cu(CH3COO)2·H2O were dissolved in 100 g deionized water at room temperature yielding 0.30 m Cu(CH3COO)2(aq) solution. While stirring 5.3 mL NH3(aq) (24 wt%) were added. During the addition a pale blue precipitate was formed, which was dissolved after the whole amount of NH3(aq) had been added. Afterwards 106 g of a 0.30 m copper(II) acetate solution were added and a jelly like precipitate was formed. After 48 h of aging at room temperature a turquoise precipitate conglomerated at the bottom of the reaction vessel. One part of the solid was filtered off, treated as described above and analysed. The remaining suspension was aged for 6 months at room temperature. During the aging period no change in color or consistency of the precipitate could be observed.Preparation of the 1–2–0 phase (Cu3(CH3COO)2(OH)4)
Phase characterisation
SEM-images of the purified and dried solids were taken with a TESCAN Vega 5130 SB (20 kV accelerating voltage), after coating the sample with gold. Elemental analyses of carbon, hydrogen, sulfur and nitrogen were performed with a Vario Micro Cube analyzer (Elementar). The infrared spectrum was recorded from a KBr blank using a FT-IR spectrometer Nicolet 380X (Thermo Electron Company) with DLaTGS-Detector. μ-Raman spectroscopy was conducted using a Renishaw inVia Raman spectrometer with a Leica DMLM microscope and a RenCam CCD detector. The spectrometer was equipped with a He–Ne laser operating at 632.8 nm, with power kept below 400 μW on the sample surface. The diffuse reflectance spectrum of the powder was measured at room temperature in a wavelength range from 200–800 nm with a resolution of 0.5 nm, using an UV/VIS spectrometer V-650 (Jasco) and employing an integrating sphere. Thermal analysis was carried out using a TG/DTA 22 of Seiko instruments (reference substance: Al2O3, open platinum crucible, nitrogen flow 300 mL min−1, heating rate 2 K min−1). The magnetic measurement of a powder sample enclosed in gel capsules was carried out in the temperature range from 1.8 K to 300 K in a DC mode using a SQUID magnetometer (MPMS XL, Quantum Design) at 0.1 T. XRPD patterns for phase identification of synthesized verdrigis phases were taken at room temperature with a laboratory powder diffractometer in Bragg–Brentano geometry (D8 Discover (Bruker), Cu-Kα1 radiation, Vontec-1 detector), within a scan range from 4.0°2θ to 70°2θ, employing a step size of 0.02°2θ and a scan time of 2 s per step. The samples were prepared as flat plates. For a detailed investigation on the phase purity, XRPD patterns were collected at room temperature on a laboratory powder diffractometer in Debye–Scherrer geometry (Stadi P-Diffraktometer (Stoe), Cu-Kα1 radiation from primary Ge(111)-Johann-type monochromator, Mythen 1 K detector (Dectris)). The samples were sealed in 0.5 mm diameter borosilicate glass capillaries (Hilgenberg glass no. 0140), which were spun during the measurements. Each pattern was measured in a 2θ range from 5.0° to 120° applying a total scan time of 24 h. Temperature dependent in situ X-ray diffraction experiments were performed on a D8-Advance diffractometer (Bruker, Cu-Kα1 radiation from primary Ge(220)-Johannson-type monochromator, Lynx Eye position sensitive detector (Bruker)) in Debye–Scherrer geometry using a water cooled furnace (mri capillary heater, (25–1000) °C) for heating the capillary. The sample was sealed in a 0.7 mm diameter quartz glass capillary (Hilgenberg), which were spun during the measurement. The patterns were measured with a scan range of 5.0°2θ to 50.0°2θ, employing a step size of 0.005 and a total scan time of 4 h. For crystal structure determination a powder pattern was recorded at the High Resolution Powder Diffraction Beamline (I11) at the Diamond Light Source (UK) with a wavelengths of 0.8260 Å (15.01 keV) in transmission geometry using a multi MYTHEN II (Dectris) detector. For the measurement, the sample was sealed in a 0.5 mm glass capillary (Hilgenberg) that was spun during the measurement. Calibration of the photon energy was carried out using a Si640D NIST standard, which was measured in a 0.3 mm borosilicate capillary, as well. A Pawley refinement24 returned the exact wavelengths and the 2θ zero-offset. For determination of the instrumental resolution function a diffraction pattern a Si640D NIST standard was recorded using the same experimental conditions.Crystal structure solution
The program TOPAS 6.025 was used to determine and refine the crystal structure of the 1–2–0 phase. Indexing of the phase was carried out by an iterative use of singular value decomposition (LSI)26 leading to a primitive orthorhombic unit cell with lattice parameters given in the ESI (Table S1†) and Pbca(61) was determined as most probable space group from the observed systematic reflection extinction. The peak profile and the precise lattice parameters were determined by LeBail27 fits applying user defined convolutions for the description of the instrumental resolution function (see above). The background was modeled by employing Chebychev polynomials of 6th order. To account for the anisotropic peak broadening and 2θ offsets which affect mainly the h00 and 00l reflections induced most likely by stacking faults and microstrain, symmetry adapted spherical harmonics of 6th order were successfully applied. The refinement converged quickly.
The crystal structure of the 1–2–0 phase was solved by applying the global optimization method of simulated annealing (SA) in real space as it is implemented in TOPAS.28 Rigid bodies for the acetate ions were defined in z-matrix notation and translated and rotated freely through the unit cell. Atoms located on identical positions were identified by using a merging radius of 0.7 Å.29 After few hours the positions of all atoms were found. The procedure was carried out several times and in result the simulated annealing process always yielded identical structural models that were independent from the starting parameters, i.e. the number of atoms that were initially put into the unit cell. For the final Rietveld refinement30 covering a 2θ range from 3.0 to 60.0°, all profile and lattice parameters were released iteratively and positions of the copper and oxygen (hydroxide ions) atoms were subjected to free unconstrained refinement. The bond lengths and angles of the rigid bodies were refined, restraining them to reasonable values and the hydrogen positions were omitted due to the limits of the powder diffraction method. The final agreement factors are listed in Table S1,† the atomic coordinates and selected bond distances are given in Tables S2 and S3,† the fit of the whole powder pattern is shown in Fig. S1 in the ESI.† The crystallographic data have been deposited at the CCDC, deposit number: 1565871.†
Results and discussion
Phase identification and phase composition
The synthesis of the 1–2–0 phase according to the procedure given by Rahn-Koltermann et al.5 using 0.66 m Cu(CH3COO)2(aq) at 75 °C with subsequent cooling to 40 °C led to the formation of deep blue crystals, which could be identified as Cu(CH3COO)2·H2O by XRPD. This appears reasonable with respect to the temperature dependent solubility of copper(II) acetate in water: at 75 °C saturation is reached at 0.69 m Cu(CH3COO)2 and at 40 °C already at 0.44 m Cu(CH3COO)2. Thus the data referring to concentration of the Cu(CH3COO)2-solution given in the paper5 are misleading. The adaption of the Cu(CH3COO)2-concentration to 0.43 m and otherwise applying exactly the same procedure did not lead to the formation of any precipitate.
By applying the synthesis procedure for the 2–1–5 phase a turquoise solid was obtained. Rahn-Koltermann et al.,5 however, describe this phase as a green solid. The measured XRPD pattern (Fig. 2b) is almost identical to the data for the 1–3–2 phase given by Rahn-Koltermann et al. and to a simulated XRPD pattern from the crystal structure of the 1–3–2 phase20 (Fig. 2a). The elemental analysis also points to this phase (Table 2). Hence the given procedure leads to the formation of the 1–3–2 phase instead of the 2–1–5 phase.
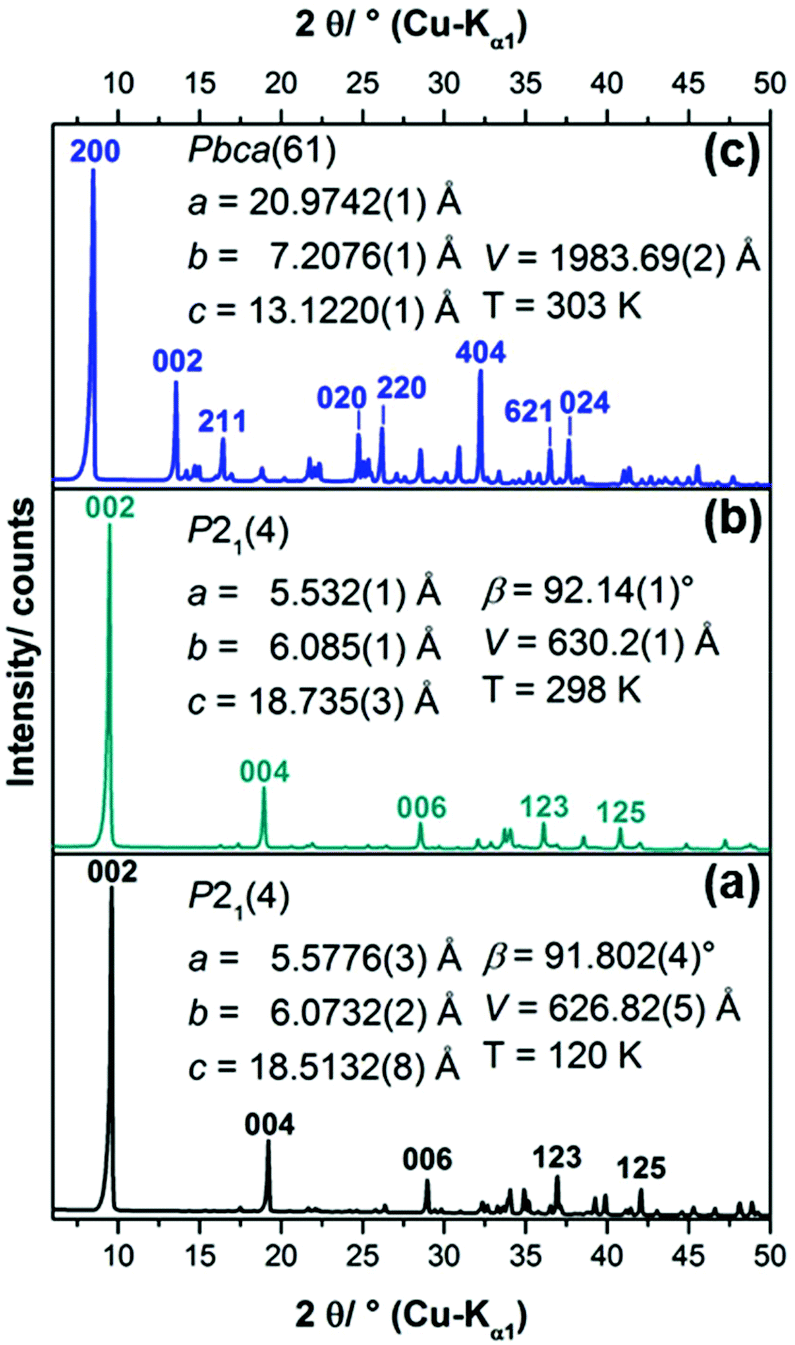 | ||
| Fig. 2 (a) XRPD pattern of the 1–3–2 phase, simulated from the crystal structure data,20 (b) measured XRPD pattern of the solid obtained from the synthesis procedure5 for the 2–1–5 phase including refined lattice parameters, (c) measured XRPD pattern of the solid (1–2–0 phase) obtained by aging the liquid phase of the synthesis approach for the 2–1–5 phase for 6 days at 60 °C, including space group symmetry according to LSI-indexing and refined lattice parameters. | ||
| Element | Intermediate: 1–3–2 phase (Cu2(CH3COO)(OH)3·H2O) | Subsequently formed 1–2–0 phase (Cu3(CH3COO)2(OH)4) |
|---|---|---|
| Cexp. (Ctheo.) | 9.4 (9.4) wt% | 12.7 (12.8) wt% |
| Hexp. (Htheo.) | 2.9 (3.2) wt% | 2.4 (2.7) wt% |
| Nexp. (Ntheo.) | 0.0 (0.0) wt% | 0.0 (0.0) wt% |
| Sexp. (Stheo.) | 0.0 (0.0) wt% | 0.0 (0.0) wt% |
The procedure for producing the 1–3–2 phase and the 1–4–3 phase yielded the 1–3–2 phase after 48 h (ESI Fig. S2†). By aging the suspension at room temperature for 6 months no further phase transformation could be observed.
In summary only the synthesis procedure for the 1–3–2 phase given by Rahn-Koltermann et al.5 could be reproduced. In order to obtain additional phases the synthesis procedures were modified. By aging the liquid phase from the synthesis approach for the 1–3–2 phase at 60 °C, a blue solid was obtained (Fig. 3). As the diffraction pattern of the blue solid (Fig. 2c) entirely differs from the one of the 1–3–2 phase (Fig. 2a and b), it can be concluded that this phase was completely transformed into another basic copper acetate.
 | ||
| Fig. 3 Photographs of the reaction vessels and of the solid products of the verdrigis synthesis in aqueous solution and SEM-images of the solid phases. | ||
Characterisation of the 1–2–0 phase
By addition of ammonia to a copper(II) acetate solution, the 1–3–2 phase that occurs as turquoise powder (Fig. 3) is formed intermediarily and is subsequently transformed into a deep blue solid. In addition the crystal morphology of these two phases significantly differs. The 1–3–2 phase crystallizes in agglomerated hexagonal plates (Fig. 3, left) as it was already observed in former studies.8,22 In contrast, the blue solid crystallizes in well-defined prismatic plates (Fig. 3, right). The elemental analyses (Table 2) confirm Cu2(CH3COO)(OH)3·H2O (≡1–3–2 phase) as the composition of the intermediarily formed turquoise powder and point to Cu3(CH3COO)2(OH)4 (≡1–2–0 phase) as the phase composition of the blue powder.In order to obtain a first insight into the stable or metastable occurrence of basic copper(II) acetates in aqueous solution, freshly precipitated Cu(OH)2 was systematically reacted with aqueous (0.05 to 0.35) m copper(II) acetate solution at 60 °C. The formation of the 1–3–2 phase could not be observed in any of the experiments within 3 weeks, instead the beginning conversion of Cu(OH)2 into the 1–2–0 phase was detected by XRPD (ESI, Fig. S2†). This seems to indicate a potential metastable occurrence of the 1–3–2 phase, which is most likely formed because of the high hydroxide supersaturation that is achieved by the addition of ammonia. Phase formation from the solid hydroxide usually doesn't lead to lower hydroxide supersaturations. In more dilute copper(II) acetate solutions the conversion of Cu(OH)2 at 60 °C leads to a solid, that is partially or completely black (ESI, Fig. S3†) which indicates the presence of CuO. Even in concentrated solution the appearance of black CuO can be observed. Hence the 1–2–0 phase also seems to be metastable in aqueous copper(II) acetate solution at 60 °C. At these conditions the thermodynamically stable phase is most likely CuO. Confirmed information on thermodynamical stability and metastability of distinct phases, however, can only be derived from further studies on the phase solubilities.
The diffraction pattern of the 1–3–2 phase (Fig. 2b) exhibits a strong basal reflection at 9.5°2θ and a motif that is characteristic for layered compounds. The lattice parameters of the phase that were determined by Švarcová et al.20 at 120 K were refined to the measured XRPD pattern taken at 298 K yielding values that are in good agreement with the lattice parameters given by Masciocchi et al.18 The diffraction pattern of the 1–2–0 phase (Fig. 2c) exhibits more sharp reflections but points to a layered crystal structure as well. According to the indexing of the XRPD pattern (Fig. 2c) the interlayer spacing in the crystal structure of the 1–2–0 phase, indicated by the 200 basal reflection (d = 10.487 Å) is considerably larger than in the 1–3–2 phase (d(002) = 9.368 Å).
Crystal structure description
In the crystal structure of the 1–2–0 phase copper ions occupy 3 crystallographically independent sites forming Cu3(CH3COO)2(OH)4 building units (Fig. 4). Each site is coordinated by 4 oxygen atoms forming a distorted squared planar coordination sphere (Fig. 4, orange bonds), with copper–oxygen distances ranging from 1.84 to 2.10 Å (ESI, Table S2†). One copper site (Cu1) is coordinated by 2 apical, monodentate coordinating acetate ions and two bridging hydroxide ions. The other copper sites (Cu2 and Cu3) are coordinated exclusively by hydroxide ions. An additional 5th oxygen site is located within the extended coordination spheres of the copper ions (Fig. 4, dark grey, dashed bonds). Cu1 is coordinated by an additional hydroxide ion with a Cu–O distance of 2.28 Å and the other copper sites are coordinated by the second carboxylate oxygens with Cu–O distances of 2.36 Å (Cu2) and 2.23 Å (Cu3), resulting in a pseudo bidentate and pseudo bridging character of the acetate ions. One of the carboxylate oxygens (O22) is seemingly located in the extended coordination spheres of two copper ions, but the distance between Cu3 and O22 (Fig. 4, light grey, dotted bond) is too long (2.56 Å). | ||
| Fig. 4 Coordination spheres of the copper cations and the acetate anions in the 1–2–0 phase, orange bonds indicate directly coordinating ligands, interactions within the extended coordination sphere are indicated by grey dashed and dotted bonds. | ||
The trimeric Cu3(CH3COO)2(OH)4 building units form layers perpendicular to the a-axis that are stacked in a hcp-like ABAB fashion (Fig. 5a). Interlayer interactions are most likely mediated by very weak C–H⋯O(acetate) (d C–O = 3.80 Å) contacts (Fig. 5b, grey, dashed line), as well as by van-der-Waals interactions between the methyl groups of acetate ions of adjacent layers (d C–O = 4.03 Å). By the weak interlayer interactions the occurrence of stacking faults in the crystal structure of the 1–2–0 phase, which mainly appears as a shift of the layers in c-direction and a modulation of the interlayer spacing (see Experimental section), can be explained. In layers edge linked Cu2(CH3-COO)2(OH)4/3(OH)2/21/3− dimers that are arranged in b-direction in an alternating fashion pointing to the top site (Fig. 5c, light blue squares) and to the bottom side (dark blue squares) of the layers are the most prominent structural motif. Each (Cu3)(OH)2/3(OH)2/21/3+ square interconnects four dimers with each other. Two dimers are interconnected via apical hydroxides (green bonds) and dimer chains running in b-direction are interconnected by bridging hydroxide ions (orange bonds).
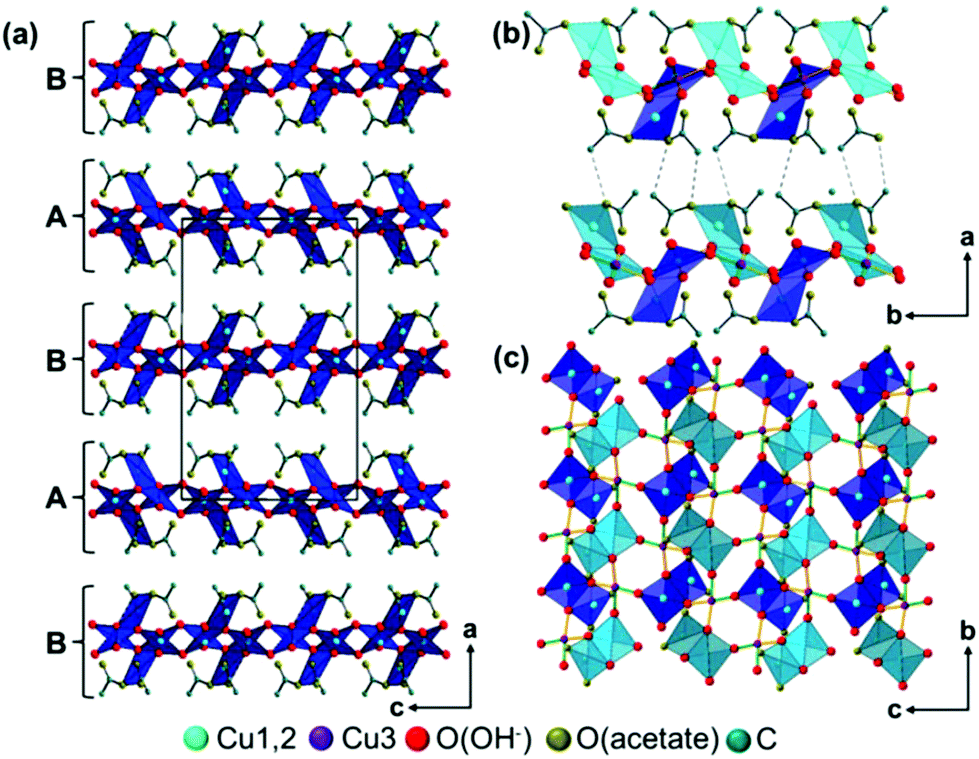 | ||
Fig. 5 Packing diagram of the 1–2–0 phase, (a) stacking order of the layers, (b) weak interlayer interactions, mediated by C–H⋯O (acetate) contacts, (c) layer constitution, Cu2(CH3-COO)2(OH)4/3(OH)2/21/3− dimers pointing in [100] direction are indicated by light blue color, dimers point in [00![[1 with combining macron]](https://www.rsc.org/images/entities/char_0031_0304.gif) ] direction are indicated by dark blue color. ] direction are indicated by dark blue color. | ||
Spectral properties
33 as well as the fundamental vibrations of the acetate ion34 were used. By band assignment and interpretation of the vibrational spectra, several features of the crystal structure can be confirmed.
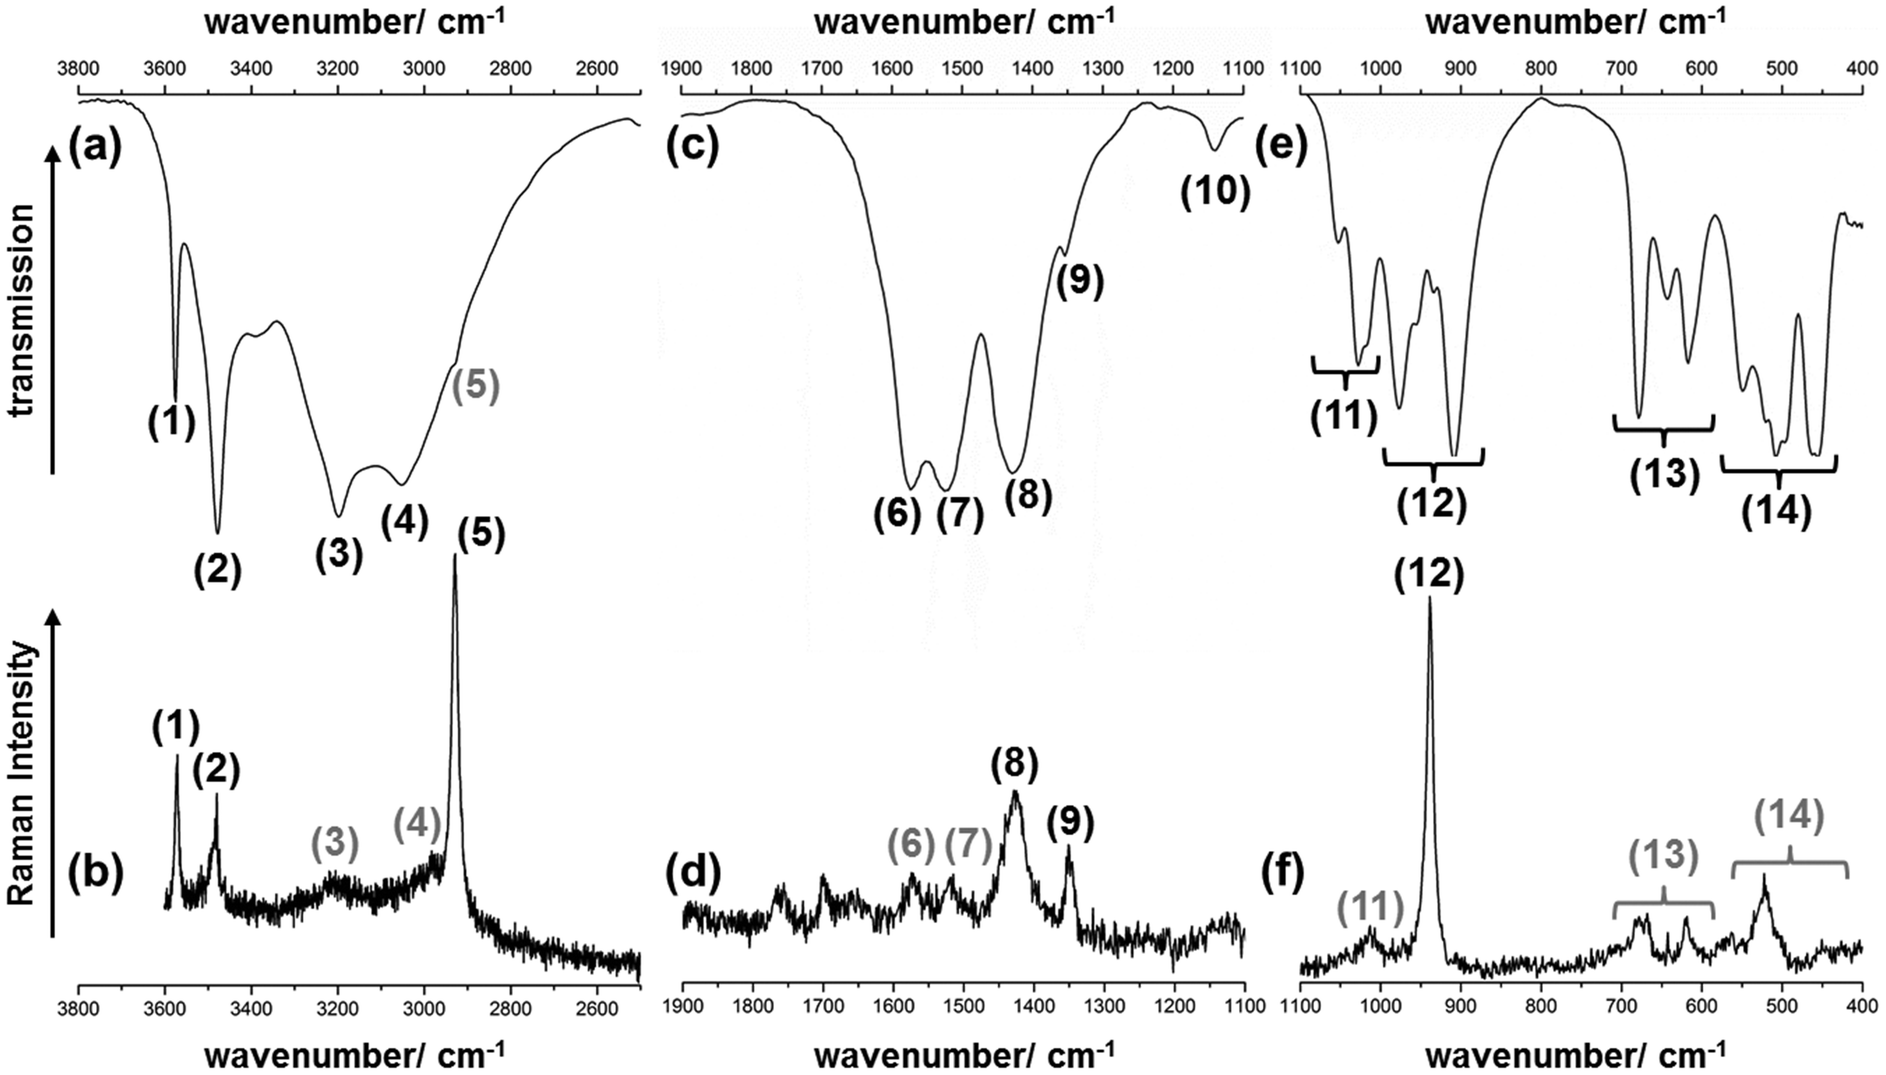 | ||
| Fig. 6 Excerpts of the IR- (a, c, e) and Raman-spectrum (b, d, f) of the 1–2–0 phase in the (a, b) high, (c, d) mid and (e, f) low wavenumber region. Bands with grey numbers are only hardly visible. | ||
| Band no. | Position/cm−1, shape | Assignment | Band no. | Position/cm−1, shape | Assignment | ||
|---|---|---|---|---|---|---|---|
| IR | Raman | IR | Raman | ||||
| vs: very strong, s: strong, m: medium, br broad, sh: shoulder. | |||||||
| (1) | 3575, vs | 3571, s | ν(OH) – OH− | (12) | 977, m | — | ν(CC) – CH3-COO |
| (2) | 3479, s | 3479, s | 956, sh | — | |||
| (3) | 3198, br | ≈3210, br | ν(CH) – CH3 | 934, sh | 938, vs | ||
| (4) | 3053, br | ≈2982, br | 909, s | — | |||
| (5) | 2929, sh | 2928, vs | (13) | 679, s | 670, br | δ(OCO) – COO− | |
| (6) | 1574, m | 1574, br | ν as(CO) – COO− | 644, m | 642, m | ||
| (7) | 1523, m | 1520, br | 617, m | 620, m | |||
| (8) | 1429, br | 1427, m | ν s(CO) – COO | (14) | 550, m | 562, br | ν, ρ, ω(Cu–O), |
| (9) | 1354, sh | 1351, m | δ(CH) – CH3 | 520 s, w | 536, sh | Lattice modes | |
| (10) | 1140, br | — | Combination mode | 508, s | 522, m | ||
| (11) | 1053, s | — | ρ(CH) – CH3 | 497, sh | — | ||
| 1028, s | ≈1013, br | 464, sh | — | ||||
| 1018, sh | — | 456, m | — | ||||
Thermal behaviour
The thermal behaviour of the 1–2–0 phase was investigated by thermal analysis and by ex- and in situ XRPD. The analyses are not completely correlated as the thermal analysis was performed in an Ar stream, which refers to decomposition in an inert atmosphere, whereas the in situ XRPD measurements were performed in an open capillary, which represent the decomposition in air.Thermal analysis – decomposition in inert atmosphere
At temperatures below 160 °C no mass loss occurs (Fig. 7, black line), which additionally proves the absence of hydrate water in the solid phase. The thermal decomposition of the 1–2–0 phase occurs rapidly and is completed already at ca. 275 °C. The first and the second decompositions step are associated with endothermic effects that show vast overlap (Fig. 7, blue line). In these steps, dehydration of the hydroxide ions occurs. During the first step a copper(II)-oxo-acetate, Cu3(CH3COO)2(OH)4−2xOx with x ≈ 1.1, is formed. By further dehydration the copper(II)-oxo-acetate decomposes into anhydrous Cu(CH3-COO)2 and CuO. The third step, in which the acetate ions are decomposed, starts directly after the second step. In the TG curve there is no plateau between step (2) and (3). The decomposition of the acetate ions is associated with several endo- and exothermic effects. According to the measured total mass loss of 43.1 wt% the thermal decomposition of the 1–2–0 phase yielded 1.5 Cu2O with calculated total mass loss of 43.0 wt%. An ex situ XRPD measurement (ESI, Fig. S6†) of the brownish-red residue of the thermal decomposition indicates the presence of both Cu2O and CuO, with Cu2O as the well crystalline main fraction (77.8 wt%) and CuO as poorly crystalline minor fraction (22.2 wt%). A close inspection of the TG-curve (ESI, Fig. S7†) reveals that the mass of the residue increased during heating from 320 °C to 450 °C. This points to slight oxygen impurities in the gas stream, which led to a beginning oxidation of Cu2O. During cooling and the XRPD measurement (in total 3 hours) the oxidation reaction proceeds and finally leads to a veritable amount of CuO in the solid. The poor crystallinity of CuO, indicated by the broad reflections (ESI, Fig. S6†), which is in contrast to the sharp Cu2O related reflections, supports this assumption. Hence it can be concluded that the decomposition of Cu(CH3-COO)2 leads to the formation Cu and Cu2O as described in literature.32,36 In addition, redox active species like CH3-CHO, CH3-CO-CH3 and CO are formed leading to a reduction of CuO and to a synproportion of Cu and CuO yielding Cu2O. This would explain the exothermic effects at 250 °C to 275 °C as the decomposition of pure anhydrous Cu(CH3-COO)2 in inert atmosphere is associated with endothermic effects, only.36 | ||
| Fig. 7 Thermogravimetric (TG, black line), differential thermoanalytic (DTA, blue line) and differential thermogravimetric (DTA, green line) curves of the 1–2–0 phase. | ||
In situ XRPD measurements – decomposition in air
Until the decomposition of the acetate starts (Fig. 7 (3)), the mechanism is independent from the oven atmosphere. Hence the in situ XRPD experiments are completely correlated with the thermal analysis up to a temperature of 190 °C. In the in situ XRPD patterns the reflections of the 1–2–0 phase are apparent up to temperatures of 160 °C (Fig. 8a). At more elevated temperatures the basic copper(II)-acetate is partially dehydrated into Cu3(CH3COO)2(OH)4−2xOx, which is indicated by vast changes in the diffraction pattern (Fig. 8b), in particular by the disappearance of 002 reflection (Fig. 9a). The diffraction pattern of Cu3(CH3COO)2(OH)4−2xOx (Fig. 9a, green line) points to a layered constitution of the phase and a very pronounced anisotropic peak broadening, yielding trigonal shaped Warren-type peaks37 indicating a pronounced turbostratic like stacking fault disorder of the layers. Hence no attempt was made to determine the crystal structure of the intermediately formed copper(II)-oxo-hydroxo-acetate nor to index the XRPD pattern. The position of the basal reflection (Fig. 9b) shows that the interlayer distance of the 1–2–0 phase increased from 10.487 Å at 30 °C to 10.611 Å at 150 °C due to thermal expansion. By partial dehydration the basal distance is shortened to 10.524 Å at 170 °C. As there is no potential interlayer interaction of hydroxide and acetate ions in the crystal structure of the 1–2–0 phase, the partial dehydration must have led vast changes in the constitution of the layers, as well. By further heating the reflections of Cu3(CH3COO)2(OH)4−2xOx slowly disappear and broad reflections attributed to CuO can be observed and sharp reflections from an additional solid phase appear (Fig. 8c). The diffraction pattern of this additional phase is very similar to the reported XRPD data of Cu(CH3-COO)2.38,39 As these datasets were evaluated as being low in precision or questionable (PDF cards: 00-027-1126, 00-046-0857),17 Cu(CH3-COO)2·H2O was dehydrated in a capillary for comparison, which eventually proved that anhydrous copper(II)-acetate was formed (Fig. 9b, red and blue line). During the decomposition of Cu(CH3-COO)2 in air the reflections of CuO increase in intensity and reflections attributed to Cu2O appear, as well (Fig. 9d and e).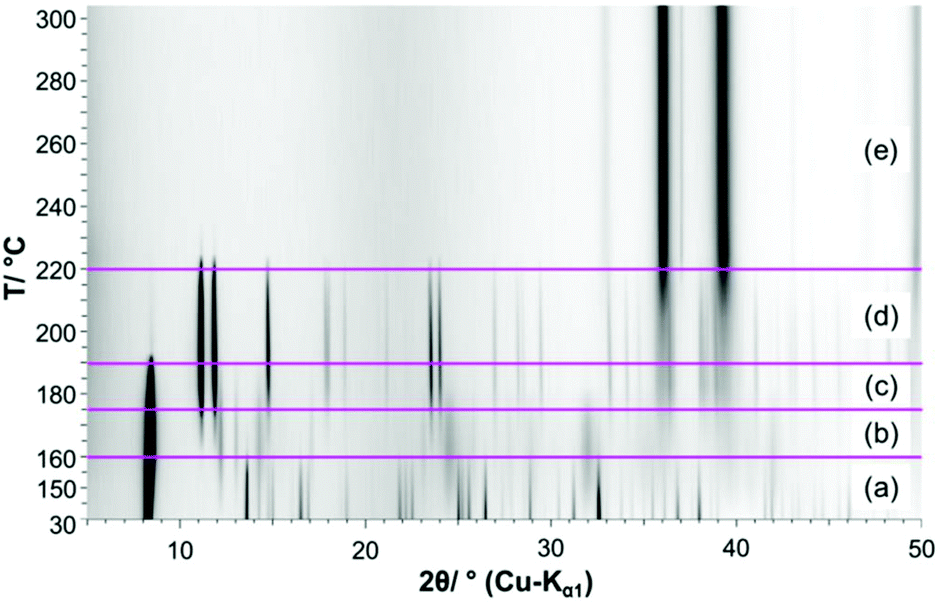 | ||
| Fig. 8 Temperature dependent in situ XRPD patterns of the 1–2–0 phase including assignment of the measured reflections: (a) 1–2–0 phase, (b) Cu3(CH3COO)2(OH)4−2xOx, (c) Cu3(CH3COO)2(OH)4−2xOx + Cu3(CH3COO)2 + CuO, (d) Cu3(CH3COO)2 + CuO, (e) CuO + Cu2O. | ||
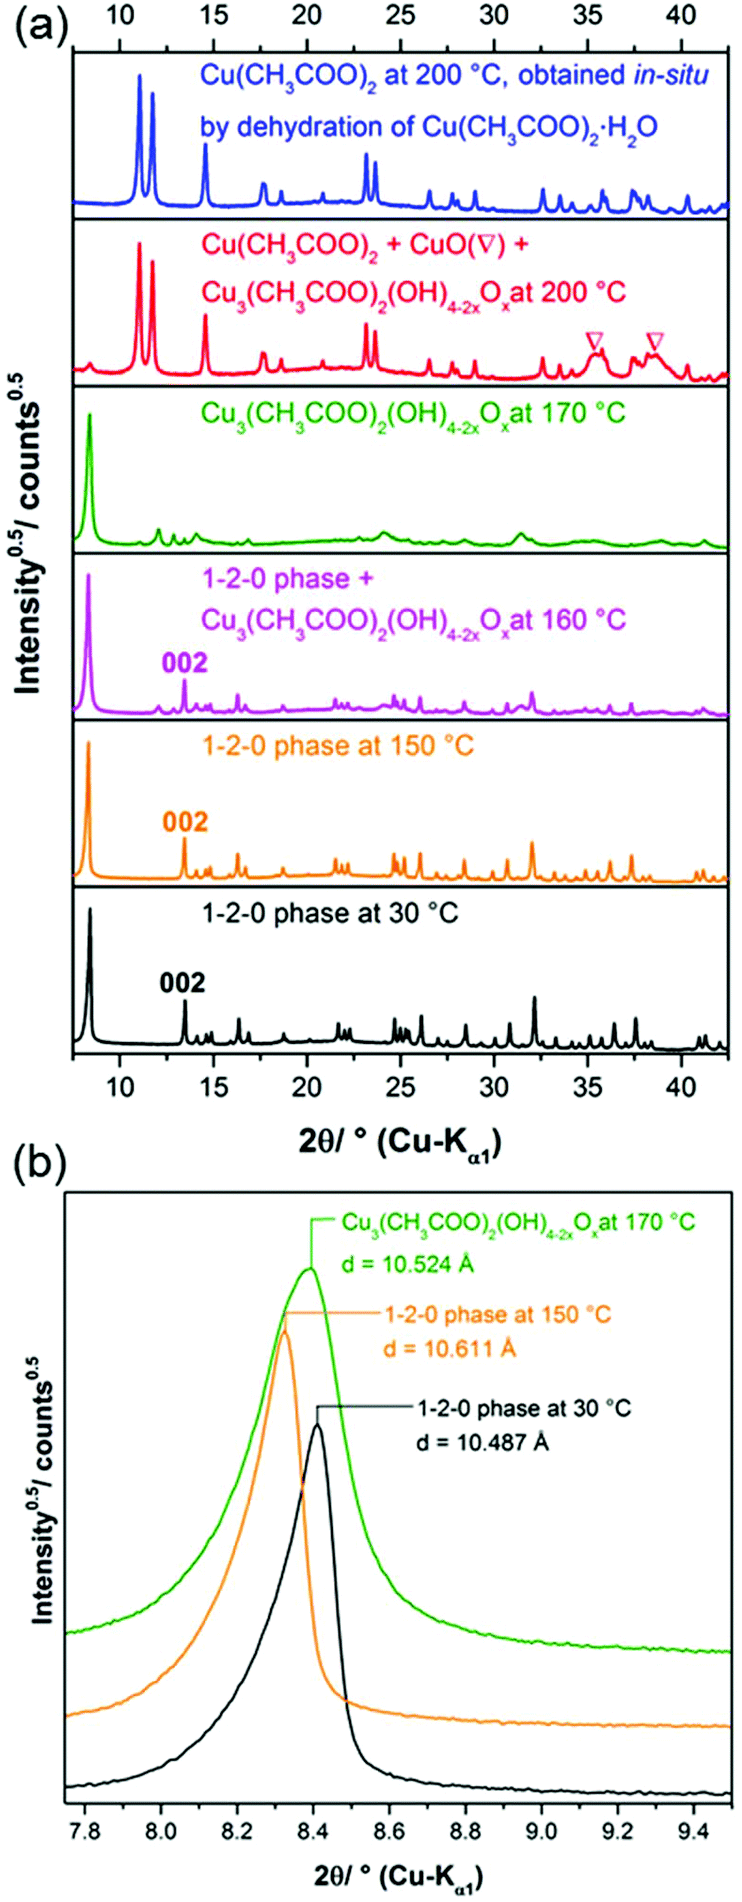 | ||
| Fig. 9 (a) In situ XRPD patterns taken during the thermal decomposition of the 1–2–0 phase and during the decomposition of Cu(CH3COO)2·H2O, (b) basal reflections of Cu3(CH3COO)2(OH)4 at 30 °C and 150 °C and of Cu3(CH3COO)2(OH)4−2xOx at 170 °C. | ||
Magnetic properties
The inverse of the magnetic susceptibility of the 1–2–0 phase measured in a MPMS SQUID magnetometer (Quantum Design) in a magnetic field of 0.1 T is displayed in Fig. 10. The inverse molar susceptibility (per one f.u. of Cu3(CH3COO)2(OH)4, i.e. three Cu atoms) is characterized by two distinct temperature regions, above ∼150 K, and between ∼150 K and ∼30 K, where Curie–Weiss behaviour according to | (1) |
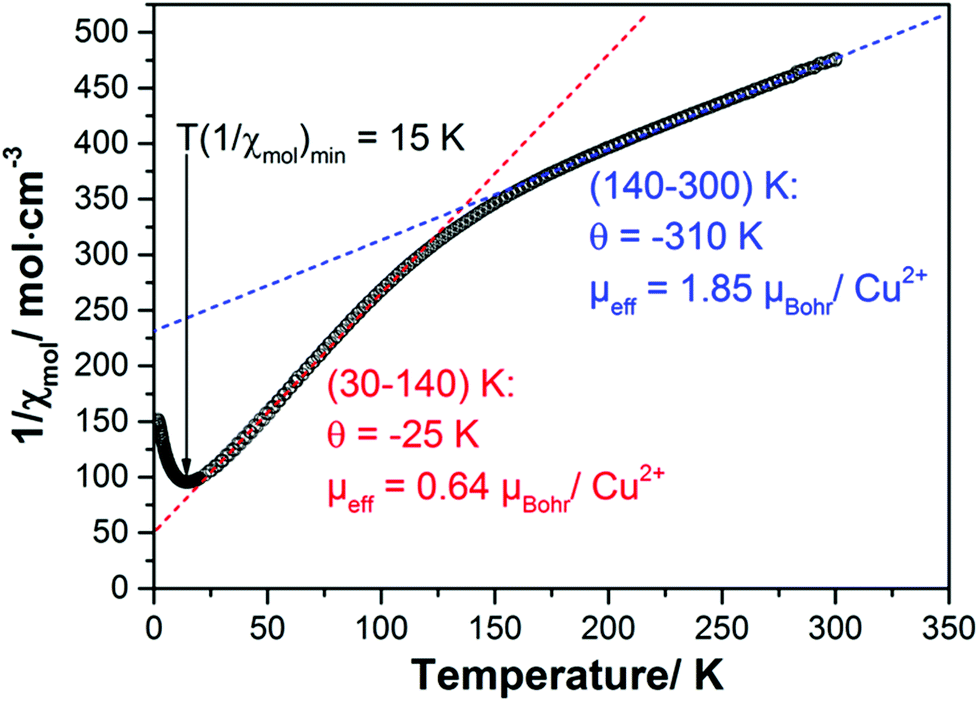 | ||
| Fig. 10 Inverse magnetic susceptibility of a powder sample of the 1–2–0 phase measured in a magnetic field of 0.1 T. The red and blue dashed lines represent Curie–Weiss fits to the inverse susceptibilities between 30 and 100 K and above ∼150 K indicating effective magnetic moments and Curie–Weiss temperatures as listed in the graph. | ||
The Curie constants, Ci, are related to the effective magnetic moment, μeff,i, by
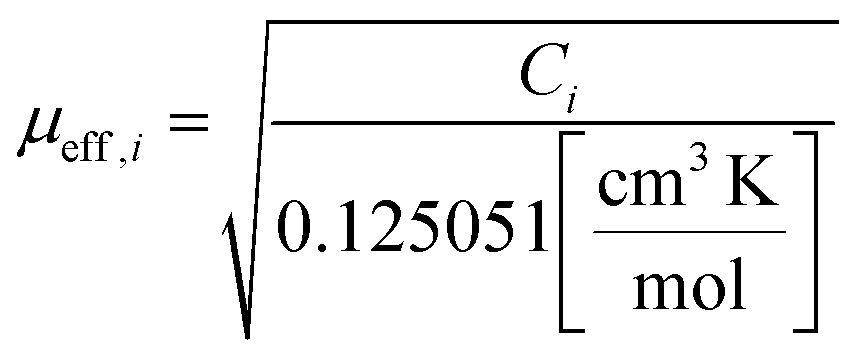 | (2) |
For Cu2+ cations with an electronic configuration 3d9 and spin-1/2 placed in an octahedral or slightly Jahn–Teller distorted octahedral anion environment one typically expects effective magnetic moments of ∼1.8–1.9μBohr.41
Taking the slopes of the straight lines approximating the inverse susceptibilities in the two temperature ranges above and below ∼150 K one obtains effective magnetic moments and Curie–Weiss temperatures:
| 30–140 K | μ eff = 0.64μBohr with 1.92μBohr related to one Cu atom only (see below) and Θ = −25 K. |
| 140–300 K | μ eff = 1.85μBohr for each of the three Cu atoms in a formula unit and Θ = −310 K. |
The effective moments exhibit an interesting temperature dependence which provides a first hint how to understand the magnetism of the 1–2–0 phase: whereas at high temperatures all three Cu cations in a formula unit carry an effective moment in good agreement with the theoretical expectation, it appears that below ∼140 K two of the three Cu moments disappear and only one magnetic Cu cation is left which carries an effective moment according to the theoretical expectation.
Both Curie–Weiss temperatures are negative indicating predominant antiferromagnetic spin exchange interaction. The Curie–Weiss temperatures derived from the susceptibilities above ∼140 K is particularly large indicating a strong antiferromagnetic spin exchange path which couples two Cu moments firmly to a nonmagnetic singlet with small to negligible contribution to the magnetic susceptibility at low temperatures.
Effectively, at low temperatures only one Cu cation contributes to the magnetism which also exhibits antiferromagnetic correlations leading to the minimum in the inverse susceptibility at ∼15 K, which is, however, broader than one would expect it for long-range antiferromagnetic ordering.
Following this preliminary analysis of the magnetic susceptibility we tested several model descriptions. The best fit of the magnetic susceptibility requiring only two adjustable parameters for an intra-dimer and an intra-chain spin exchange assumes that the magnetic properties of the 1–2–0 phase can be simulated by a superposition of two independent subsystems: a strongly antiferromagnetically coupled spin-1/2 dimer and a spin-1/2 Heisenberg chain with uniform antiferromagnetic nearest-neighbour spin exchange according to
| χmol(T) = χdimer(T) + χchain(T), | (3) |
| Jchain = 24(1) K |
| Jdimer = 610(20) K |
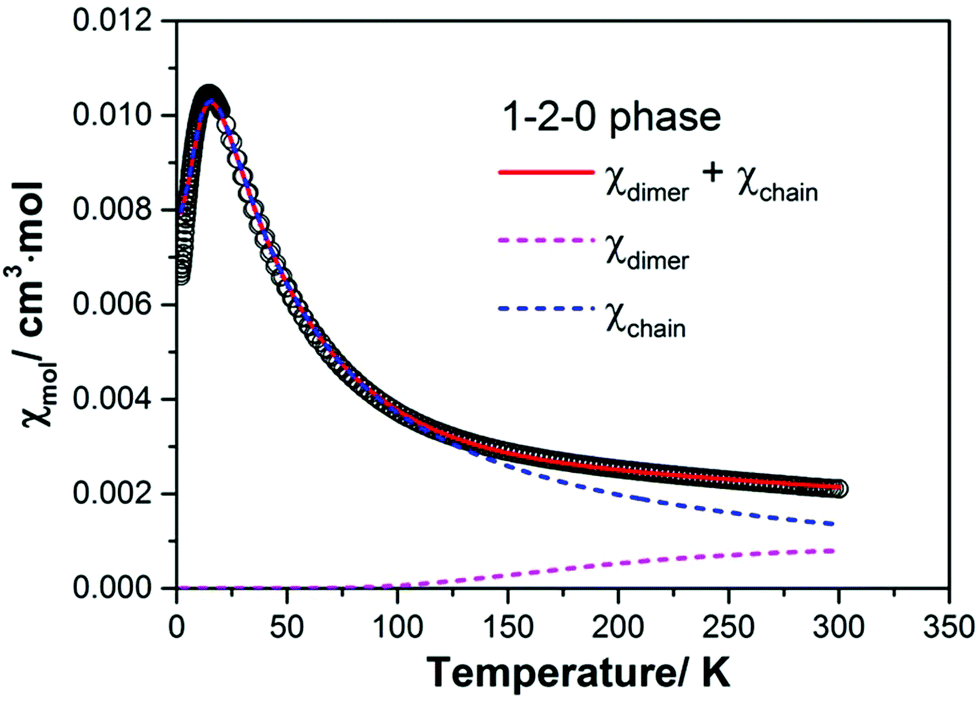 | ||
| Fig. 11 Magnetic susceptibility of a powder sample of the 1–2–0 phase measured in a magnetic field of 0.1 T. The red solid line represents the result of a model fit according to eqn (3) assuming contributions from a spin-1/2 dimer and a spin-1/2 Heisenberg spin chain with uniform nearest-neighbour spin exchange interaction. The magenta and blue dashed lines give the magnetic contributions from the dimer and the Heisenberg chain, respectively. | ||
The g-factors for the Cu moments in the dimer and the chain were assumed to be equal and fixed to 2.12 which is a reasonable value for a powder sample.40
As can be seen from Fig. 11 the magnetism of the 1–2–0 phase is essentially dominated by the susceptibility of the Heisenberg chain. Due to the very strong antiferromagnetic coupling in the dimer magnetic contributions from the dimer become relevant only above ∼150 K. At room temperature they amount to ∼1 × 10⁻³ cm3 mol−1, about one half of the total susceptibility at this temperature. In the fit we have neglected the temperature independent term χ0 (see eqn (1)). Using Selwood's increments for the respective ions the diamagnetic susceptibility of the 1–2–0 phase can be estimated to χdia = −126 × 10−6 cm3 mol−1. The negative diamagnetic contribution is approximately compensated by the positive van Vleck susceptibility of the three Cu2+ cations which amounts to approximately +43 × 10−6 cm3 per mol per Cu cation.
In view of the crystal structure featuring pronounced Cu–Cu dimers connected to neighboring dimers via Cu monomers the very good agreement between experimental data and the fit assuming a superposition of magnetic contributions from a dimer and a chain appears to be a reasonable model assumption. The very large antiferromagnetic intra-dimer spin exchange coupling mediated by O2− anions connected to the Cu atoms via bonds enclosing bonding angles of ∼100° and ∼103° has been discussed by Hay, Thibeault and Hoffmann for O–H bridged Cu dimers.44 The formation of a spin chain in the 1–2–0 phase is not immediately obvious from the crystal structure. One can tentatively identify possible spin exchange paths leading to a spin chain. However, more conclusive statements deserve support by electronic structure calculation for different magnetic coupling scenarios.
Conclusions
Known synthesis approaches for basic copper(II)-acetates, xCu(CH3COO)2·yCu(OH)2·zH2O = x–y–z phase, the main components of historic verdigris pigments were reinvestigated and revealed to be partially irreproducible. A modification of the reaction conditions led to the successful synthesis of the 1–2–0 phase (Cu3(CH3COO)2(OH)4 = 1Cu(CH3COO)2·2Cu(OH)2·0H2O). By Raman-spectroscopy it could be shown that the obtained product is identical with a compound occurring in previously synthesised historic blue pigments.7 Now, a reproducible synthesis procedure, as well as reliable spectroscopic data for the 1–2–0 phase are available that can be used by museums and collection worldwide to identify distinct verdigris phases in historic artwork and pigment samples. The 1–2–0 phase exhibits a deep blue color that originates from a reflectance maximum at 472 nm and from an absorbance maximum at 676 nm that is comparable with other historic blue pigments like azurite or Egyptian Blue. By thermal analysis and temperature dependent in situ XRPD measurements the temperature stability of the 1–2–0 phase could be proven up to 160 °C. The phase composition was determined from elemental and thermal analysis and confirmed by the crystal structure solution from synchrotron XRPD data. In the structure the copper cations are coordinated by hydroxide and acetate ions forming distorted square planar coordination spheres. The monodentate coordinating acetate ions are located at apical positions and the short distance between the non-coordinating carboxylate oxygen and a neighbouring copper ions suggest an interaction, that is reflected by the unusual small splitting of the νas(CO) and νs(CO) bands, as well as by the degeneration of the νas(CO) band in the IR-spectrum. Cu2(CH3-COO)2(OH)4/3(OH)2/21/3− dimers, which are interconnected by corner sharing Cu(OH)5/31/3+ squares form layers perpendicular to the a-axis of the orthorhombic unit cell. Magnetic measurements indicate a predominant antiferromagnetic spin coupling. In particular the Cu2(CH3-COO)2(OH)4/3(OH)2/21/3− dimers exhibit a very strong coupling thus the magnetic contributions of the dimers become relevant above ∼140 K, which results in the presence of two distinct temperature regions were magnetic susceptibility Curie–Weiss behaviour of the magnetic susceptibility with different Curie constants and Weis temperatures is found. At lower temperatures the magnetic susceptibility is mainly governed by a spin-1/2 Heisenberg chain with uniform antiferromagnetic nearest-neighbour spin exchange.Conflicts of interest
There are no conflicts to declare.Acknowledgements
Betty Günther from the Institute of Inorganic Chemistry of TU Bergakademie Freiberg is acknowledged for measuring the UV/VIS spectrum, Eva Brücher from the Max Planck Institute for Solid State Research for performing the SQUID measurements and Jörg Stelzner from the State Academy of Art and Design, Stuttgart for taking the Raman-spectrum. Funding by DFG for the project “In search of structure” (grant EG 137/9-1) and Open Access funding provided by the Max Planck Society is gratefully acknowledged.References
- D. A. Scott, Y. Taniguchi and E. Koseto, Rev. Conserv., 2001, 2, 73–91 CAS.
- F. Schweizer and B. Muehlethaler, Farbe Lack, 1968, 74, 1159–1173 CAS.
- A. Roy, M. Spring and C. Plazzotta, National Gallery Technical Bulletin, 2004, 25, 4–35 Search PubMed.
- J. Gauthier, Rev. Gen. Sci. Pures Appl. Bull. Assoc. Fr. Av. Sci., 1959, 66, 67–78 CAS.
- G. Rahn-Koltermann, D. H. Buss, R. Fuchs and O. Glemser, Z. Naturforsch., B: Anorg. Chem. Org. Chem., 1991, 46, 1020–1024 CrossRef CAS.
- T. D. Chaplin, R. J. H. Clark and D. A. Scott, J. Raman Spectrosc., 2006, 37, 223–229 CrossRef CAS.
- M. San Andrés, J. M. de la Roja, V. G. Baonza and N. Sancho, J. Raman Spectrosc., 2010, 41, 1468–1476 CrossRef.
- A. Jiménez-López, E. Rodríguez-Castellón, P. Olivera-Pastor, P. Maireles-Torres, A. A. G. Tomlinson, D. J. Jones and J. Rozière, J. Mater. Chem., 1993, 3, 303–307 RSC.
- S. Yamanaka, Stud. Surf. Sci. Catal., 1994, 83, 147–153 CrossRef CAS.
- S. Yamanaka, T. Sako and M. Hattori, Chem. Lett., 1989, 18, 1869–1872 CrossRef.
- S. Yamanaka, Solid State Ionics, 1992, 53–56, 527–533 CrossRef CAS.
- P. Rabu, M. Drillon and C. Hornick, Analusis, 2000, 28, 103–108 CrossRef CAS.
- G. Rogez, C. Massobrio, P. Rabu and M. Drillon, Chem. Soc. Rev., 2011, 40, 1031–1058 RSC.
- W. Fujita, K. Awaga and T. Yokoyama, Inorg. Chem., 1997, 36, 196–199 CrossRef CAS.
- V. Laget, C. Hornick, P. Rabu and M. Drillon, J. Mater. Chem., 1999, 9, 169–174 RSC.
- K. Suzuki, J. Haines, P. Rabu, K. Inoue and M. Drillon, J. Phys. Chem. C, 2008, 112, 19147–19150 CAS.
- WebPDF-4+2016-Database, ICCD, Newtown Square, PA, USA, 2016.
- N. Masciocchi, E. Corradi, A. Sironi, G. Moretti, G. Minelli and P. Porta, J. Solid State Chem., 1997, 131, 252–262 CrossRef CAS.
- F. Yang, M. Boero and C. Massobrio, J. Phys. Chem. C, 2010, 114, 20213–20219 CAS.
- S. Švarcová, M. Klementová, P. Bezdička, W. Łasocha, M. Dušek and D. Hradil, Cryst. Res. Technol., 2011, 46, 1051–1057 CrossRef.
- S. Haseloff, PhD PhD-thesis, Albert-Ludwigs-Universität, Freiburg im Breisgau, 2011 Search PubMed.
- N. Kozai, H. Mitamura, H. Fukuyama, F. Esaka and S. Komarneni, J. Mater. Res., 2005, 20, 2997–3003 CrossRef CAS.
- A. Apelblat and E. Manzurola, J. Chem. Thermodyn., 1999, 31, 1347–1357 CrossRef CAS.
- G. S. Pawley, J. Appl. Crystallogr., 1981, 14, 357–361 CrossRef CAS.
- B. AXS, 2017.
- A. A. Coelho, J. Appl. Crystallogr., 2003, 36, 86–95 CAS.
- A. Le Bail, H. Duroy and J. L. Fourquet, Mater. Res. Bull., 1988, 23, 447–452 CrossRef CAS.
- A. A. Coelho, J. Appl. Crystallogr., 2000, 33, 899–908 CrossRef CAS.
- V. Favre-Nicolin and R. Černý, Mater. Sci. Forum, 2004, 443–444, 35–38 CrossRef CAS.
- H. M. Rietveld, J. Appl. Crystallogr., 1969, 2, 65–71 CrossRef CAS.
- P. Baraldi and G. Fabbri, Spectrochim. Acta, Part A, 1981, 37, 89–92 CrossRef.
- Z. Lin, D. Han and S. Li, J. Therm. Anal. Calorim., 2011, 107, 471–475 CrossRef.
- H. D. Lutz and M. Schmidt, Eur. J. Solid State Inorg. Chem., 1995, 32, 937–945 CAS.
- E. Spinner, J. Chem. Soc., 1964, 4217–4226, 10.1039/jr9640004217.
- M. Aceto, A. Agostino, G. Fenoglio, A. Idone, M. Gulmini, M. Picollo, P. Ricciardi and J. K. Delaney, Anal. Methods, 2014, 6, 1488 RSC.
- S. A. A. Mansour, J. Therm. Anal., 1996, 46, 263–274 CrossRef CAS.
- B. E. Warren, Phys. Rev., 1941, 59, 693–698 CrossRef CAS.
- D. A. Edwards and R. Richards, Inorg. Nucl. Chem. Lett., 1974, 10, 945–950 CrossRef CAS.
- P. W. Brown, K. G. Galuk and W. J. Rossiter, Sol. Energy Mater., 1987, 16, 309–313 CrossRef CAS.
- M. G. Banks, R. K. Kremer, C. Hoch, A. Simon, B. Ouladdiaf, J. M. Broto, H. Rakoto, C. Lee and M. H. Whangbo, Phys. Rev. B: Condens. Matter, 2009, 80, 024404 CrossRef.
- H. Lueken, Magnetochemie, Teubner Studienbücher, Stuttgart, Leipzig, 1999 Search PubMed.
- A. Klümper and D. C. Johnston, Phys. Rev. Lett., 2000, 84, 4701–4704 CrossRef PubMed.
- D. C. Johnston, R. K. Kremer, M. Troyer, X. Wang, A. Klümper, S. L. Bud'ko, A. F. Panchula and P. C. Canfield, Phys. Rev. B: Condens. Matter Mater. Phys., 2000, 61, 9558–9606 CrossRef CAS.
- P. J. Hay, J. C. Thibeault and R. Hoffmann, J. Am. Chem. Soc., 1975, 97, 4884–4899 CrossRef CAS.
Footnote |
| † Electronic supplementary information (ESI) available. CCDC 1565871. For ESI and crystallographic data in CIF or other electronic format see DOI: 10.1039/c7dt03288a |
| This journal is © The Royal Society of Chemistry 2017 |