
 Open Access Article
 This Open Access Article is licensed under a
 Creative Commons Attribution 3.0 Unported Licence
Synthesis and temperature-dependent studies of a perovskite-like manganese formate framework templated with protonated acetamidine†
Mirosław
Mączka
 *a,
Jan
Janczak
a,
Monika
Trzebiatowska
a,
Adam
Sieradzki
b,
Sebastian
Pawlus
cd and
Adam
Pikul
a
*a,
Jan
Janczak
a,
Monika
Trzebiatowska
a,
Adam
Sieradzki
b,
Sebastian
Pawlus
cd and
Adam
Pikul
a
aInstitute of Low Temperature and Structure Research, Polish Academy of Sciences, Box 1410, 50-950 Wrocław 2, Poland. E-mail: m.maczka@int.pan.wroc.pl
bDepartment of Experimental Physics, Wrocław University of Technology, Wybrzeże Wyspiańskiego 27, 50-370, Wrocław, Poland
cInstitute of Physics, University of Silesia, ul. Uniwersytecka 4, 40-007 Katowice, Poland
dSilesian Center for Education and Interdisciplinary Research, 75 Pulku Piechoty 1A, 41-500 Chorzów, Poland
First published on 2nd June 2017
Abstract
We report the synthesis, crystal structure, thermal, dielectric, phonon and magnetic properties of the [CH3C(NH2)2][Mn(HCOO)3] (AceMn) compound. Our results show that this compound crystallizes in the perovskite-like orthorhombic structure, space group Imma. It undergoes a structural phase transition at 304 K into a monoclinic structure, space group P21/n. X-ray diffraction, dielectric, IR and Raman studies show that the ordering of the acetamidinium cations triggers the phase transition. Low-temperature magnetic studies show that this compound exhibits weak ferromagnetic properties below 9.0 K.
Introduction
Metal formate frameworks templated by ammonium or protonated amines constitute a class of dense metal organic framework (MOF) compounds that have received a lot of attention in recent years. In this context, rare-earth formate frameworks were found to be promising luminescent and non-linear optical materials1,2 whereas heterometallic and mixed-valence formates, with general formulas [amineH+][MIIIMII(HCOO)6] and [amineH+][NaI0.5MIII0.5(HCOO)3] (amine = dimethylamine, ethylamine, diethylamine; MIII = Fe, Cr; MII = Mg, Zn, Cu, Ni, Fe, Co, Mn) were shown to exhibit luminescence, ferroelectric, magnetic or even multiferroic properties.3–5 Multiferroic properties were also reported for the [NH2(CH2)4NH2][Mn(HCOO)6] compound.6 The most interesting sub-group of formate frameworks constitutes, however, MOFs with the general formula [amineH+][M(HCOO)3] (M = divalent metal cation). The first members of this family of formates with methylammonium, dimethylammonium (DMA+), ethylammonium and azetidinium cations were discovered by Wang et al. in 2004 and these compounds were shown to exhibit weak ferromagnetic properties.7 In 2009, the first report was published on the discovery of multiferroic properties in [(CH3)2NH2][M(HCOO)3] compounds (M = Mn, Fe, Ni, Co).8 This discovery promoted broad interest in the studies of these formates and the search for novel frameworks templated by various cations.9–24 In this context, azetidinium analogues were shown to exhibit giant dielectric anomalies9 whereas guanidinium (Gua+) analogues showed interesting magnetic properties.10,11 Furthermore, the coexistence of ferroelectric and magnetic orders was discovered in metal formate frameworks templated by ammonium, methylammonium, hydrazinium and methylhydrazinium cations, and MII = Mn, Fe, Co, Ni.12–16 It is also worth adding that multiferroic properties were also predicted theoretically for guanidinium (MII = Cr, Cu) and ethylammonium (MII = Mn) analogues.17,18 Apart from magnetic and dielectric properties, some of these divalent metal formates also exhibit negative thermal expansion and negative linear compressibility properties.19,20Almost all known divalent metal formates templated by ammonium or protonated amines undergo temperature-induced structural phase transitions associated with ordering of the organic cations and distortion of the metal formate framework.25,26 The size and shape of the organic cation as well as its ability to form hydrogen bonds (HBs) with the oxygen atoms of the framework determine the crystal structures and physicochemical properties.25,26 Therefore, much effort has been made to synthesise metal formate frameworks with various protonated amines. Until now, 11 cations were employed, i.e. apart from the above-mentioned 7 cations, formates with hydroxylammonium,27 formamidinium (FMD+),28,29 imidazolium,30 and tetramethylammonium31 are also known.
The acetamidinium cation (CH3C(NH2)2+, Ace+) has not yet been used in the synthesis of formate frameworks. However, it has been recently successfully used in the synthesis of the switchable dielectric material [CH3C(NH2)2]2[KFe(CN)6].32 Since its size (2.77 Å)33 is similar to the size of DMA+ (2.72 Å)33,34 and Gua+ (2.78 Å)34 that were previously used as a template ion in the metal formate frameworks, we have decided to try the synthesis of novel formate frameworks containing this cation. We will show that this synthesis was successful for a manganese analogue and that the novel MOF undergoes a temperature-induced structural phase transition.
Experimental details
Materials and instrumentation
MnCl2 (99%, Sigma-Aldrich), methanol (99.8%, Sigma-Aldrich), acetamidine hydrochloride (95%, Sigma-Aldrich), sodium formate (99%, Sigma-Aldrich) and formic acid (98%, Fluka) were commercially available and used without further purification. Heat capacity was measured using a Mettler Toledo DSC-1 calorimeter with a high resolution of 0.4 μW. Nitrogen was used as a purging gas and the heating and cooling rate was 5 K min−1. The excess heat capacity associated with the phase transition was evaluated by subtraction from the data the baseline representing variation in the absence of the phase transitions. A powder XRD pattern was obtained on an X'Pert PRO X-ray diffraction system equipped with a PIXcel ultrafast line detector, a focusing mirror, and Soller slits for CuKα1 radiation (λ = 1.54056 Å). The complex dielectric permittivity was measured using a broadband impedance Novocontrol Alpha analyser. The sample was investigated isothermally in the frequency range 10−1 to 106 Hz and the measurements were taken every 1 K over the temperature range from 230 to 350 K. Since the obtained single crystals were not big enough to perform single crystal dielectric measurements, a pellet made of a well-dried sample was measured instead. The pellet with a diameter of 6 mm and a thickness of 0.4 mm was located between copper electrodes. The sample was located in the sample chamber filled with dry nitrogen. The temperature values, with a stability ±0.2 K, were changed by a flow of vaporized liquid nitrogen heated and controlled by a Novocontrol heating system. The complex dielectric function is given by ε′′(ω) = ε′ − iε′′ = −i/(ωZ*(ω)C0), where Z* is the measured complex impedance, C0 is the geometrical capacitance of the sample and ω = 2πf is the angular frequency. All measurements including the calibration routine, temperature stabilization, and data acquisition were automatically controlled. The magnetic properties of a large number of freely oriented single crystals of AceMn (about 40 mg in total) were measured using a commercial SQUID (superconducting quantum interference device) magnetometer in the temperature range 2–300 K and in external magnetic fields up to 3 kOe. The AC magnetic susceptibility was measured below 20 K in zero magnetic field applied using the probing AC magnetic field of an amplitude of 3 Oe and frequencies ranging between 1 and 1000 Hz. The background coming from a weakly diamagnetic sample holder was found in the temperature range studied to be negligible in comparison to the total signal measured, so its subtraction was omitted. No demagnetization corrections were made to the data reported here either. The low-temperature specific heat of the largest single crystal available (about 2 mg) was measured using a Quantum Design PPMS (Physical Property Measurement System) platform utilizing the thermal relaxation method. The heat capacity of the calorimeter (sapphire plate) and adhesive (vacuum grease Apiezon N) was measured separately and subtracted from the total signal. Temperature-dependent Raman spectra were obtained using a Renishaw inVia Raman spectrometer equipped with a confocal DM 2500 Leica optical microscope, a thermoelectrically cooled CCD as a detector, an argon laser operating at 488 nm and a Linkam cryostat cell. Temperature-dependent IR spectra were obtained using a Nicolet iN10 stand-alone infrared microscope and a Linkam cryostat cell. The spectral resolution of the Raman and IR spectra was 2 cm−1.Synthesis of the sample
In order to grow single crystals of AceMn, 8 mL of methanol solution containing 3 mmol of acetamidine hydrochloride was mixed with 8 mL of methanol solution containing 3 mmol of sodium formate. The mixture was stirred for half an hour. After filtering off the white precipitate, 0.7 mL of HCOOH was added to the clear solution and the mixture was placed at the bottom of a glass tube (9 mm inner diameter). Into this solution, 15 mL of methanol solution containing 1 mmol of MnCl2 was gently added. The tube was sealed and kept undisturbed. Light pink crystals were harvested after 3 days. Comparison of their powder XRD pattern with the calculated ones based on the single-crystal data at 330 and 100 K (see Fig. S1 in the ESI†) confirmed the phase purity of the bulk sample.Single crystal X-ray diffraction
The X-ray intensity data for the AceMn crystal were collected using graphite monochromatic MoKα radiation on a four-circle κ geometry KUMA KM-4 diffractometer with a two-dimensional area CCD detector at 100(1) and 330(1) K. The ω-scan technique with Δω = 1.0° for each image was used for data collection. The unit cell parameters were refined by least-squares methods on the basis of all measured reflections. One image was used as a standard after every 40 images for monitoring of the crystal stability and data collection, and no correction on the relative intensity variations was necessary. Data collections were made using the CrysAlis CCD program.35 Integration, scaling of the reflections, correction for Lorenz and polarisation effects and absorption corrections were performed using the CrysAlis Red program.35 The structure was solved by direct methods using SHELXS97,36 and refined using the SHELXL-2014 programs.37 The hydrogen atoms of amine groups were located in difference Fourier maps and were refined for the structure at 100(1) K, whereas for the structure at 330(1) K due to the disorder the H atoms were introduced geometrically. The hydrogen atoms joined to carbon atoms were generated geometrically (C–H 0.96 Å) and refined as a riding model. The final difference Fourier maps showed no peaks of chemical significance. Details of the data collection parameters, crystallographic data and final agreement parameters are shown in Table S1.† Visualisation of the structure was made with the Diamond 3.0 program.38Results and discussion
DSC
The DSC measurements show the presence of one heat anomaly for AceMn at 304 K upon heating and at 303 K upon cooling (Fig. S2†). Fig. 1 shows that the heat capacity anomaly is asymmetric. The associated change in enthalpy ΔH and entropy ΔS was estimated to be ∼604 J mol−1 and ∼2.2 J mol−1 K−1, respectively (Fig. 1). For an order–disorder transition, ΔS = R![[thin space (1/6-em)]](https://www.rsc.org/images/entities/char_2009.gif) ln(N), where R is the gas constant and N is the ratio of the number of configurations in the disordered and ordered phase. Since according to the X-ray diffraction data discussed in the next paragraph N = 4, ΔS is expected to be 11.5 J mol−1 K−1. The experimental value is lower than expected. It is worth noting that significantly smaller than expected ΔS values were often reported for many metal formate frameworks templated by protonated amines, especially those that showed dielectric relaxation behaviour.15,29,39,40 For instance, the change of entropy associated with the loss of the trigonal disorder in formamidinium manganese formate, [NH2CHNH2][Mn(HCOO)3], which undergoes a second-order phase transition, was found to be only 0.97 J mol−1 K−1, instead of the expected value 9.1 J mol−1 K−1.24 Since some residual entropy is always left over if a phase transition has some relaxor character,41 the small value of ΔS for AceMn can be most likely explained in the same way as reported for related formate frameworks. That is, this behaviour indicates most likely that much residual entropy is left over below Tc, implying the relaxor character of the phase transition.
ln(N), where R is the gas constant and N is the ratio of the number of configurations in the disordered and ordered phase. Since according to the X-ray diffraction data discussed in the next paragraph N = 4, ΔS is expected to be 11.5 J mol−1 K−1. The experimental value is lower than expected. It is worth noting that significantly smaller than expected ΔS values were often reported for many metal formate frameworks templated by protonated amines, especially those that showed dielectric relaxation behaviour.15,29,39,40 For instance, the change of entropy associated with the loss of the trigonal disorder in formamidinium manganese formate, [NH2CHNH2][Mn(HCOO)3], which undergoes a second-order phase transition, was found to be only 0.97 J mol−1 K−1, instead of the expected value 9.1 J mol−1 K−1.24 Since some residual entropy is always left over if a phase transition has some relaxor character,41 the small value of ΔS for AceMn can be most likely explained in the same way as reported for related formate frameworks. That is, this behaviour indicates most likely that much residual entropy is left over below Tc, implying the relaxor character of the phase transition.
 | ||
| Fig. 1 The heat capacity of AceMn measured in a heating mode. The insets show the change in Cp and S related to the phase transition. | ||
Single crystal X-ray diffraction
The structures of AceMn at 100 and 330 K are provided in Fig. 2a and b, respectively. Selected bond lengths and angles for both modifications are summarized in Table 1.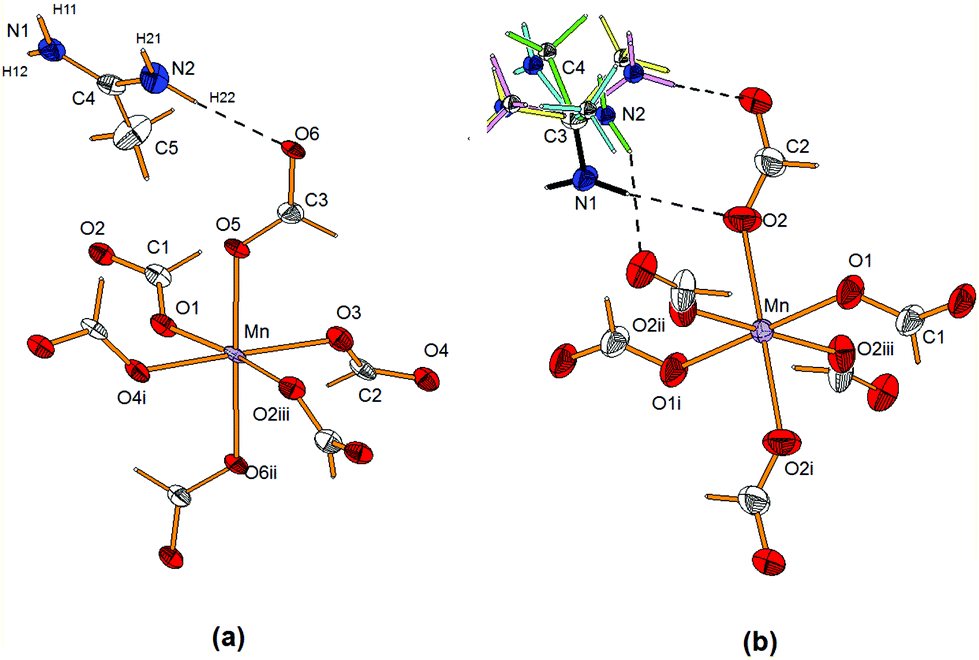 | ||
| Fig. 2 View of the structure of (a) the low-temperature (LT) monoclinic and (b) high-temperature (HT) orthorhombic modifications of AceMn showing anisotropic displacement parameters at 50 and 30% probability level for the LT and HT phase, respectively. Dashed lines represent N–H⋯O HBs. For the orthorhombic phase the green, blue, yellow and light-purple colours represent the four possible orientations of the Ace+ cation (C3 and amine N1 atoms are ordered). The symmetry code is the same as in Table 1. | ||
| 100 K | |||
| Mn–O1 | 2.211(2) | Mn–O2iii | 2.214(2) |
| Mn–O3 | 2.168(2) | Mn–O4i | 2.173(2) |
| Mn–O5 | 2.156(2) | Mn–O6ii | 2.175(2) |
| O3–Mn–O1 | 101.88(7) | O5–Mn–O1 | 93.34(8) |
| O5–Mn–O3 | 90.83(8) | O5–Mn–O4i | 87.32(8) |
| O3–Mn–O6ii | 88.81(8) | O1–Mn–O4i | 84.39(7) |
| O1–Mn–O6ii | 89.03(8) | O3–Mn–O2iii | 87.18(7) |
| O5–Mn–O2iii | 87.02(8) | O1–Mn–O4i | 84.39(7) |
| O1–Mn–O2iii | 170.93(7) | O3–Mn–O4i | 173.56(7) |
| O5–Mn–O6ii | 177.62(7) | ||
| Mn⋯Mnii | 5.9665(8) | Mn⋯Mniii | 6.1386(11) |
| Mn⋯Mniv | 6.3824(11) | Mnii⋯Mn⋯Mniii | 89.882(7) |
| Mnii⋯Mn⋯Mniv | 87.658(7) | Mniii⋯Mn⋯Mniv | 90.888(7) |
| Symmetry codes: (i) x − 1/2, −y + 1/2, z − 1/2; (ii) −x + 1/2, y − 1/2, −z + 3/2; (iii) x − 1/2, −y + 1/2, z + 1/2; (iv) x + 1/2, −y + 1/2, z − 1/2. | |||
| 330 K | |||
| Mn–O1 (×2) | 2.166(2) | Mn–O2 (×4) | 2.183(2) |
| O1–Mn–O2 | 90.25(5) | O1–Mn–O2i | 89.75(5) |
| O1–Mn–O2ii | 90.25(5) | O1–Mn–O2iii | 89.75(5) |
| O1–Mn–O1i | 180.00(4) | O2–Mn–O2i | 180.00(6) |
| O2ii–Mn–O2iii | 180.00(5) | ||
| Mn⋯Mniv | 6.0445(10) | Mn⋯Mnv | 6.2869(9) |
| Mn⋯Mnvi | 6.2869(9) | ||
| Mniv⋯Mn⋯Mnv | 90.00(1) | Mniv⋯Mn⋯Mnvi | 90.00(1) |
| Mnv⋯Mn⋯Mnvi | 88.173(1) | ||
| Symmetry codes: (i) −x, −y + 1, −z + 1; (ii) −x, y, z; (iii) x, −y + 1, −z + 1; (iv) −x, −y + 1/2, z; (v) −x + 1/2, −y + 1, z − 1/2; (vi) −x − 1/2, −y + 1, z − 1/2. | |||
At low temperature, the AceMn structure is monoclinic (space group P21/n) whereas at high temperature it is orthorhombic (space group Imma). In both phases the MnII ion is octahedrally coordinated by formate ligands that bridge neighbouring coordinating spheres in the anti–anti mode similar to many reported compounds with formate as the bridge ligand,7,42 thus forming the three-dimensional pseudo-perovskite anionic Mn-formate framework of {[Mn(HCOO)3]−}n with the topology of 412·63.7,43 In the monoclinic phase the MnII ion lies in the general position and the MnO6 octahedron is distorted, the Mn–O bond lengths are in the range of 2.156(2)–2.214(2) Å, the cis O–Mn–O angles are in the range of 84.39(7)–101.88(7)° while the trans O–Mn–O angles lie in the range of 170.93 (7)–177.62 (7)°. In the orthorhombic phase the MnII ion lies on the two-fold axis and the MnO6 octahedron has mm2 symmetry and exhibits 4 + 2 shortened octahedral conformation geometry with four long Mn–O bonds of 2.183(2) Å and two short apical Mn–O bonds of 2.166(2) Å. The cis O–Mn–O angles are less deviated from 90° and the trans O–Mn–O angles are equal to 180° (Table 1). The 3D anionic Mn-formate framework in both modifications has cavities occupied by the template Ace+ cations (Fig. 3a and b).
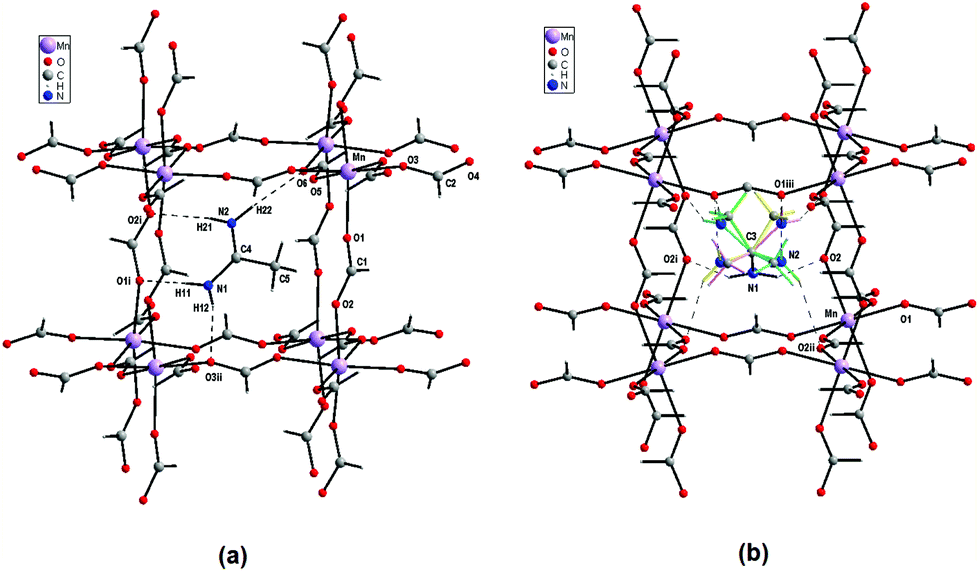 | ||
| Fig. 3 View of the N–H⋯O hydrogen bonded Ace+ cation inside the pseudo-perovskite cavity for (a) monoclinic and (b) orthorhombic phases. For the orthorhombic phase, the green, blue, yellow and light purple represent the four possible orientations of Ace+ cation (C3 and amine N1 atoms are ordered). The symmetry code is the same as in Table 1. | ||
In the LT monoclinic phase the cavity has three edges (Mn–OCO–Mn) with distances of 5.9665(8) (×4), 6.1386(11) (×4) and 6.3824(11) Å (×4); the shortest linkages are along the b direction, whereas the longer ones are along the ac plane. These distances are the Mn⋯Mn through the bridging formate anions. The angles between the edges slightly deviate from 90.0° (Table 1). In the orthorhombic phase the cavity has eight long edges that lie in the ac plane (6.2869(9) Å) and four slightly shorter ones (6.0445(9) Å) that are parallel to the b direction. The cavity volume calculated by the PLATON software44 is equal to ∼84 Å3 for the monoclinic LT phase and ∼88 Å3 for the orthorhombic HT phase. In the cavity of the LT modification, the planar Ace+ cation (except for the H atoms of the CH3 group) has its molecular plane nearly parallel to the two body-diagonal lines but normal to the third one that interacts by four conventional N–H⋯O HBs with the anionic Mn-formate framework (Fig. 3a). The HB geometries with the N⋯O distances of 2.910(4)–3.045(3) Å and the N–H⋯O angles of 164–175° (Table 2) indicate different HB strengths. In the orthorhombic phase the cavity has about 5% greater volume than that of the LT phase. As a result, the Ace+ cation is held inside the cavity by weaker N–H⋯O HBs with the N⋯O distances and N–H⋯O angles of 3.111(18)–3.198(2) Å and 137–159°, respectively (Table 2). These HBs are too weak to overcome thermally induced motions and the Ace+ cation is disordered (except for the amine N1 group and the C3 atom) over four symmetrically equivalent positions (Fig. 3b).
| a The two last HBs involving the N2 atom are disordered over four equivalent positions. | ||||
|---|---|---|---|---|
| 100(1) K | ||||
| D–H⋯A | D–H | H⋯A | D⋯A | D–H⋯A |
| N1–H11⋯O1i | 0.87(3) | 2.13(3) | 2.989(4) | 169(3) |
| N1–H12⋯O3ii | 0.77(3) | 2.30(3) | 3.045(3) | 164(3) |
| N2–H21⋯O2i | 0.85(3) | 2.08(3) | 2.910(4) | 167(3) |
| N2–H22⋯O6 | 0.89(3) | 2.05(3) | 2.939(4) | 175(3) |
| Symmetry codes: (i) −x + 1/2, y + 1/2, −z + 1/2; (ii) x, y, z − 1. | ||||
| 330(1) K | ||||
| D–H⋯A | D–H | H⋯A | D⋯A | D–H⋯A |
| N1–H1N⋯O2 | 0.85(4) | 2.52(3) | 3.198(2) | 137(2) |
| N1–H1N⋯O2i | 0.85(4) | 2.52(3) | 3.198(2) | 137(2) |
| N2–H2A⋯O2ii | 0.86 | 2.34 | 3.131(19) | 153 |
| N2–H2B⋯O1iii | 0.86 | 2.29 | 3.111(18) | 159 |
| Symmetry codes: (i) −x, y, z; (ii) x − 1/2, y, −z + 1/2; (iii) −x, −y + 1, −z. | ||||
A view of the crystal structure of the anionic pseudo-perovskite Mn-formate framework together with the Ace+ counter-ions in the cavities of both low- (monoclinic) and high-temperature (orthorhombic) phases is provided in Fig. S3a and S3b,† respectively. The anionic pseudo-perovskite cavities with the edges of Mn–OCO–Mn exhibit C2h and D2h symmetry at low and high temperatures, respectively.
It is worth noting that although AceMn has a different orthorhombic structure (space group Imma) from the related GuaMn and formamidinium analogues with MII = Fe, Co and Mg (space group Pnna),9,28,45,46 the metrics of the unit cell as well as the topology of the frameworks are very similar. In particular, all these compounds possess pseudo-tetragonal cavities in the metal formate framework with the shortest distances between MII ions parallel to the b direction (5.8703, 5.989 and 6.0445 Å) and the longer ones of 6.0661, 6.219 and 6.2869 Å lying in the ac plane for FMDFe, GuaMn and AceMn, respectively (see Table S2†). These cavities accommodate counter-ions and they are less distorted for AceMn (Mn–Mn–Mn angles are 88.173–91.827°) compared to GuaMn and FMDFe, for which the M–M–M angles are 86.493–93.507° and 86.668–93.507°, respectively (Table S2†). Comparison of these compounds also shows that the size of the unit cell is the smallest for formamidinium analogues and it increases by 3.3% when going from GuaMn to AceMn. It is worth adding here that the effective size of the Ace+ cation was estimated as very close (2.77 Å)33 to the size of Gua+ (2.78 Å).34 A significantly larger unit cell volume and the distances between MnII for AceMn compared to GuaMn indicate, however, that the ionic size of Ace+ is larger compared to Gua+. This conclusion is also consistent with the structural data reported for isostructural [CH3C(NH2)2]2[KFe(CN)6] and [C(NH2)3]2[KFe(CN)6] compounds that also revealed 5.0% larger unit cell volume in the former case.32 Table S2† also shows that the N⋯O distances in AceMn (3.111–3.198 Å at 330 K and 2.910–3.045 Å at 100 K) are longer than in GuaMn (2.953–2.991 Å at 293 K), FMDFe (2.8883 and 2.9340 Å at 294 K) and FMDMn (2.8876 Å at 355 K, and 2.8570 and 2.8984 Å at 110 K). This behavior is consistent with increasing ionic size when going from FMD+ to Gua+ and Ace+. Weaker HBs for AceMn compared to FMDMn explain its lower phase transition temperature (303 K) compared to FMDMn (334 K).29 It is worth adding that although HBs are weaker for GuaMn than for FMDMn, this compound remains ordered up to the decomposition temperature.45 This behavior can be attributed to the fact that each Gua+ cation forms six HBs whereas AceMn and FMDMn form only four such bonds.
Dielectric studies
The structural analysis reveals the ordering of the Ace+ cations with decreasing temperature. Such a process is usually accompanied by a dielectric response. We have, therefore, measured the temperature-variable complex dielectric constant (ε) (ε = ε′ − iε′′, where ε′ is the real part and ε′′ is the imaginary part) of AceMn at frequencies from 1 Hz to 1 MHz. As shown in Fig. 4a the real part of dielectric permittivity takes relatively small values of around 4 in the vicinity of the phase transition. Similar behaviour was previously reported for other perovskite-like MOFs such as tetrapropylammonium metal dicyanamides and trimethylammonium metal azides.47,48 Generally, the observed tendency is that ε′ increases monotonically with increasing temperature at all frequencies. There is a clear anomaly at around 304 K in the plot of ε′ vs. temperature. It is natural to associate this anomaly with the order–disorder phase transition in the investigated material. Additionally, in the whole investigated temperature range ε′ shows a regular frequency dispersion. At the same time ε′′ exhibits strong frequency-dependent changes with no distinct anomalies owing to the structural phase transition (see Fig. 4b). The peak maximum shifts towards higher temperatures with increasing frequency, implying a relaxor nature of the observed electric ordering. In the investigated host–guest compound, the dielectric permittivity ε′ is generally determined by the possessing dipole moment of the Ace+ cation. The dynamic movement of this molecule modifies the internal electric field and leads to dielectric permittivity changes. The ordering of the Ace+ cations leads to a change of the orientation of the internal dipole moment of these cations and in consequence modifies the shape of ε′, especially at the phase transition temperature. | ||
| Fig. 4 (a) Dielectric permittivity and (b) dielectric loss spectra as a function of temperature in AceMn. The representative curves are plotted in frequency decades between 1.8 Hz and 1 MHz. The dashed line corresponds to the structural phase transition temperature. | ||
In order to identify the nature of the relaxation process occurring in the material, the frequency-dependent dielectric permittivity of AceMn for several isotherms was analyzed. The isothermal dielectric spectra of AceMn at temperatures above and below the structural phase transition at 304 K are presented in Fig. 5. Close inspection of these spectra, especially for the ε′′ as a function of frequency, reveals the occurrence of two dipolar relaxation processes. In the investigated temperature and frequency ranges, the faster relaxation process is well visible in both phases, whereas the slower one can be noticed in the experimental frequency window just above the phase transition temperature. Both the observed dipolar dielectric responses of AceMn deviate from the classical Debye behavior. The dielectric loss spectra were fitted (see Fig. S4†) by the sum of the conductivity and the two Havriliak–Negami (HN) equations:
 | (1) |
 | ||
| Fig. 5 Frequency dependence of (a) the dielectric permittivity (ε′) and (b) loss spectra (ε′′) for selected temperatures. The arrow indicates the direction of shift of the relaxation process on heating. The dipolar relaxation processes were depicted in logε′′ spectra. | ||
In order to describe the relaxation dynamics of the observed dipolar processes, we compare the temperature dependent behavior of its dielectric relaxation times, estimated from the fits by eqn (1), as a function of 1000/T (see Fig. 6). This relaxation map mirrors the dynamic properties of the system and the central feature of the investigated structure.
 | ||
| Fig. 6 Relaxation times of two dipolar processes as a function of 1000/T. | ||
Closer inspection of the slower process reveals that the thermal activation of their relaxation time τs spans through almost four decades in frequency. In the high-temperature (HT) phase, τs exhibits almost linear dependence on the inverse temperature. Therefore, the relaxation times in the first approximation can be modelled using the Arrhenius relationship:
 | (2) |
τ0 = −17.9 s (τ0 = 1.25 × 10⁻¹⁸ s). The physical nature and mechanism of this relaxation process in the examined material are attributed to the reorientational motion of Ace+ cations in the structure. From the structural data, it is known that the Ace+ cation is held inside the cavity by HBs, which are too weak in the HT phase to overcome thermally induced motions leading to the Ace+ cation disorder. The rotation dynamics of the Ace+ ions is mostly controlled by the confinement effect, including HB interactions. The deformation of the framework during the phase transition results in different confinement for the Ace+ cations and in consequence to its ordering.
The activation energy and dielectric relaxation, attributed to the active rotation of the guest cations, strongly depend on the chemical components. The Ea values in amine-templated frameworks may vary from tens of meV up to several eV.48–52 The relatively high value of Ea in the HT phase (Ea = 1.1 eV) indicates that it is not easy to force the Ace+ cation to oscillate with the applied electric field. The freedom of motions in the disordered phase definitely makes these oscillations difficult. Based on the data reported for other compounds,49,52 we expect that in the LT (ordered) phase of AceMn the Ea should significantly decrease. It is also worth noting that the value of the relaxation time attributed to the Ace+ motions (τ0 = 1.25 × 10⁻¹⁸ s) is relatively small. For instance, the relaxation time found in dimethylammonium analogues is of the order of 10−13–10−14 s whereas for [CH3NH2NH2][Zn(HCOO)3] and [CH3CH2NH3][Mg(HCOO)3] the relaxation time is smaller, i.e. 3.9 × 10⁻¹⁶ s and 5.3 × 10⁻¹⁶ s, respectively.5a,19a,53,54 The mentioned compounds differ significantly with respect to the HB network. In particular, each DMA+ and CH3CH2NH3+ cation forms two5a,24a and three19a HBs, respectively, four H-atoms in the CH3NH2NH2+ cation are able to form HBs but only those involving the central NH2 group are relatively strong16 whereas all four H-atoms of the Ace+ cations in AceMn are involved in relatively strong HBs. This comparison suggests, therefore, that the relaxation time is dominated by the number and strength of HBs.
The faster, also dipolar relaxation process, occurring in the whole investigated temperature range, exhibits an activation type of dynamics with a lower magnitude of activation energy, i.e., Ea = 0.6 eV and log10τ0 = −15.2 s (τ0 = 6.31 × 10⁻¹⁶ s). This Ea value is about two times smaller in comparison with that of the Ace+ relaxation process. Such behavior, together with the smaller relaxation time, indicates that the intermolecular stiffness of the cage-like anionic framework is weaker. It is worth noting that the symmetry changes and the associated framework deformation at the phase transition temperature have no significant impact on the activation energy of the framework relaxation. This fact clearly confirms that the Ace+ cation ordering is responsible for the observed order–disorder phase transition.
Magnetic properties
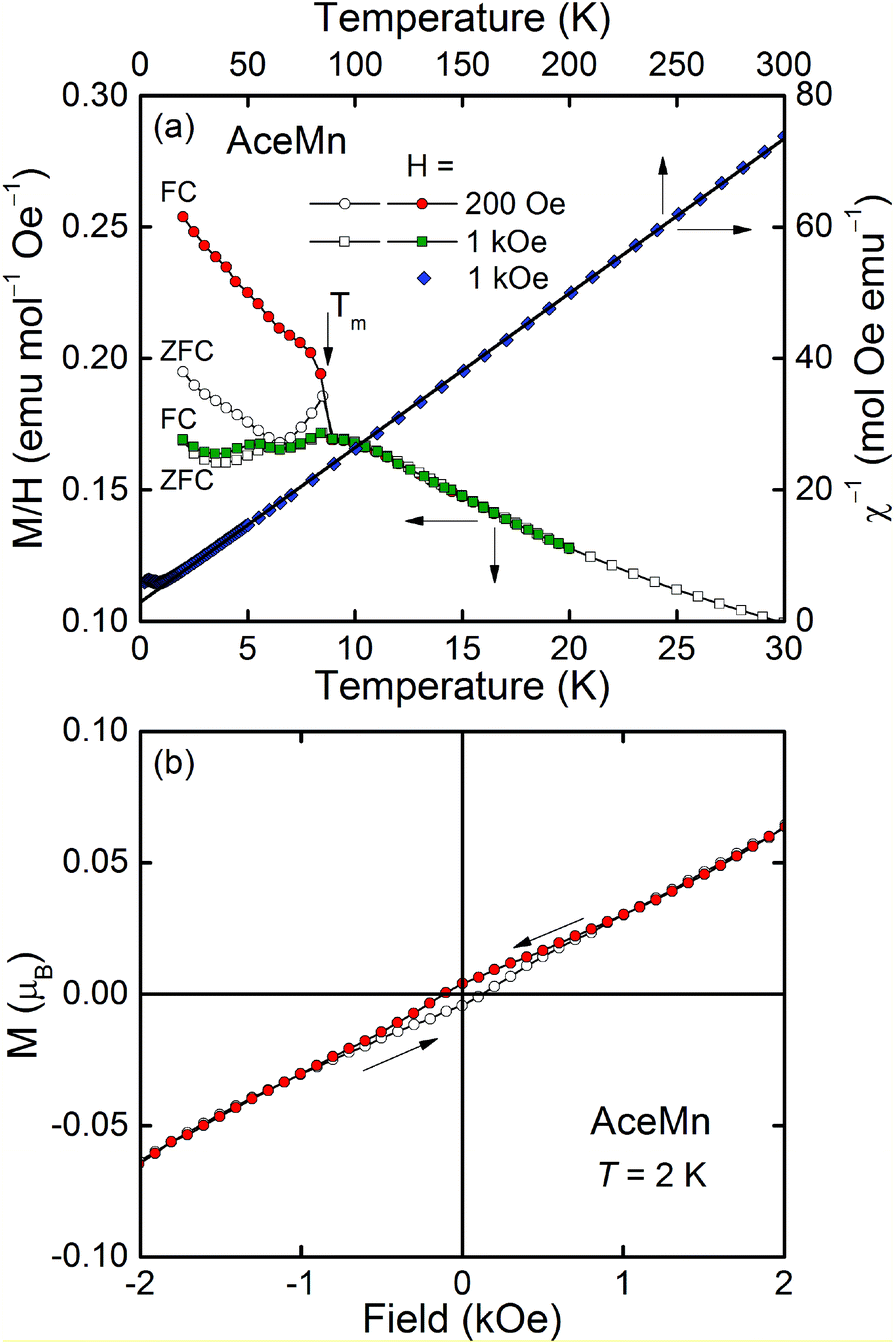
Fig. 7 displays the results of magnetic property measurements performed for AceMn. At high temperatures the compound shows paramagnetic behavior with a linear temperature dependence of the inverse magnetic susceptibility χ−1 (see the right and top axes in Fig. 7a). The experimental χ−1(T) data can be described by the conventional Curie–Weiss law: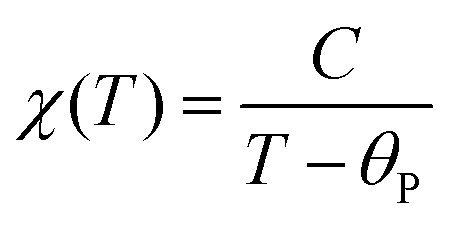 | (3) |
 is equal to 5.83(1)μB, which is close to 5.92μB calculated for free Mn2+ ions within the Russel–Sounders coupling scheme, i.e. for the 6S5/2 term of the electron configuration 3d5 (S = 5/2, L = 0, J = 5/2 and g = 2). This finding fully corroborates the results of the structural studies of AceMn, showing the presence of Mn2+ in the crystal structure. The negative value of θp points at the predominantly antiferromagnetic character of the interactions between the magnetic moments.
 | ||
| Fig. 7 (a) Left and bottom axes: The temperature variation of magnetization M of AceMn divided by the applied magnetic field H and measured in zero-field-cooling (ZFC) and field-cooling (FC) regimes; solid lines serve as guides for the eye and the arrow marks the ordering temperature Tm. Right and top axes: The inverse magnetic susceptibility χ−1vs. T; the solid line is a fit of the Curie–Weiss law to the experimental data. (b) M measured at the lowest temperature upon increasing and decreasing field (open and closed symbols, respectively); solid lines and arrows serve as guides for the eye. | ||
A distinct anomaly observed in M(T)/H at low temperatures (see the left and bottom axes in Fig. 7a) indicates an onset of long-range ordering of the magnetic moments of Mn below Tm = 9.0(5) K. The cusp-like shape of this anomaly in H = 1 kOe and the hardly visible difference between the curves measured in that field in zero-field-cooling (ZFC) and field-cooling (FC) regimes indicate the antiferromagnetic character of the ordering, being in line with the negative value of the paramagnetic Curie–Weiss temperature. However, distinct bifurcation of M(T) associated with some tendency of M to saturation visible in the FC curve measured in H = 200 Oe suggests the presence of a small ferromagnetic component in the antiferromagnetic lattice, i.e. weak ferromagnetism. The origin of the small hump visible at about 5 K remains unclear.
The field dependence of the magnetization of AceMn measured at 2 K is displayed in Fig. 7b. At high fields the magnetization increases linearly with increasing magnetic field (as expected for antiferromagnets) achieving at the highest fields studied the values far below the saturation value MS = 5μB calculated for spin-only Mn2+. At low fields (below about 800 Oe) a magnetic hysteresis loop is noticeable with the coercivity field Hc = 130 Oe and the remnant magnetization MR = 0.004μB, being in line with the postulated weak ferromagnetism. The ferromagnetic component results most probably from the canting of the antiferromagnetically ordered moments by a small angle. It is a consequence of an antisymmetric exchange interaction or single-ion anisotropy,55,56 which is very likely in the compound studied. The canting angle α can be estimated via the relationship sinα = MR/MS as about 0.05 degree.
In order to verify the long-range character of the magnetic ordering of AceMn we measured the low-temperature AC magnetic susceptibility and specific heat of the compound (Fig. 8). A distinct cusp visible at Tm in the real part of the susceptibility and associated with the absence of any clear anomaly in its imaginary part (cf.Fig. 8a) confirms the predominantly antiferromagnetic character of the ordering of AceMn. The lack of any frequency dependence of either χ′ or χ′′ allows us to safely exclude a spin-glass behavior. A sharp lambda-shaped peak observed in the temperature dependence of the specific heat (Fig. 8b) manifests a second-order phase transition, hence being another confirmation of the bulk, long-range character of the magnetic ordering at Tm.
 | ||
| Fig. 8 (a) Real (χ′) and imaginary (χ′′) part of AC magnetic susceptibility of AceMn measured in zero applied magnetic field as a function of temperature. (b) Low-temperature specific heat Cp of AceMn measured in H = 0. Solid lines serve as guides for the eye and the arrows mark the ordering temperature Tm. | ||
The magnetic behavior of the compound AceMn is similar to that reported for other perovskite-like Mn-bearing MOFs, e.g. [(CH3)2NH2]Mn(HCOO)3, [NH2NH3]Mn(HCOO)3 and [(CH3)2ND2][Mn(HCOO)3],14a,24a,57 which have been found to order magnetically at very similar temperatures, i.e. 8.5 K, 7.9 K and 8.5 K, respectively. AceMn is most probably another example of a weak ferromagnet.
Raman scattering and IR studies
Temperature-dependent Raman and IR spectra of AceMn are presented in Fig. 9, 10 and Fig. S5, S6.† The observed Raman and IR modes and their assignment are listed in Table S3.† We also present the temperature dependence of wavenumbers and full width at half maximum (FWHM) for a few selected Raman-active modes in order to better see the changes induced by the phase transition (Fig. S7†). | ||
| Fig. 9 Details of the Raman spectra of AceMn corresponding to the spectral ranges 1410–1340, 920–760, 590–440 and 300–50 cm−1. | ||
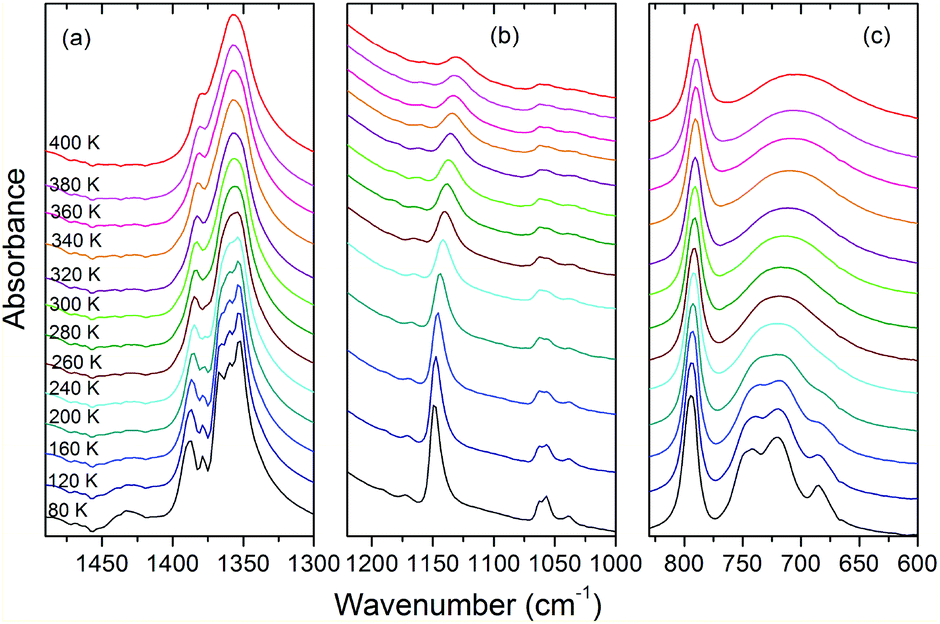 | ||
| Fig. 10 Details of the IR spectra of AceMn corresponding to the spectral ranges 1490–1300, 1220–1000 and 830–600 cm−1. | ||
The assignment of modes corresponding to the internal vibrations of HCOO− is straightforward since these vibrations give rise to characteristic bands observed in narrow wavenumber ranges for different metal formate frameworks.4,6,29,58 The internal vibrations of acetamidinium cations should be observed in a very broad wavenumber range, i.e., from about 400 to 3400 cm−1.59 Based on the literature data for formamidinium metal formates,29,46,60 as well as acetamidinium salts and theoretical studies,59 we assign the characteristics bands at 3150–3450, 2860–3100, 1700–1720, 1430–1430, 1157–1170, 1130–1149, 893, 685–742, 534–570 and 462 cm−1 to νNH2, νCH3, δNH2, δCH3, νasCCN, ρNH2, νsCCN, ωNH2, τNH2 and δNCN modes, respectively. Lattice modes are observed in the Raman spectrum below 250 cm−1 and similarly as in other formates, the major contribution to the observed bands comes from the librational motions of HCOO− ions.58
Temperature-dependent Raman and IR spectra show weak changes upon cooling from 400 K to 300 K. They show, however, a few characteristic features upon cooling below 300 K. Firstly, the observed bands exhibit clear narrowing. This behaviour is most pronounced for the lattice modes (Fig. 9d) and the modes related to the vibrations of the NH2 groups. For instance, the FWHM of the IR bands at 3136 and 1130 cm−1 changes from 289 and 31.3 cm−1 at 400 K to 49.3 and 9.7 cm−1, respectively, at 80 K. This behaviour indicates that the phase transition is associated with ordering of the Ace+ cations. Secondly, a number of modes split at low temperatures. In particular, a single Raman (IR) band corresponding to the ν5HCOO− mode near 1360 cm−1 splits into three components. This behavior proves that the phase transition is also associated with distortion of the manganese formate framework. Thus IR and Raman data are consistent with X-ray diffraction that revealed the presence of two unique HCOO− ions with equal C–O bonds in the HT phase and three such ions with all C–O bonds different in the LT phase. It is worth adding that the observed splitting of the ν5 modes is less pronounced than in the related [NH2CHNH2][Mn(HCOO)3] compound,29 indicating smaller distortion of the framework in the former case. Thirdly, the νNH2 bands exhibit a very pronounced shift towards lower wavenumbers upon cooling (up to 62 cm−1, see Fig. S5–S7†). This behavior points to a strong increase of the HB strength upon cooling.
Conclusions
We report the synthesis of the first metal formate framework templated by Ace+ cations. In contrast to the related formamidinium manganese formate crystallizing in the trigonal strucure,29 AceMn crystallizes in the orthorhombic structure, space group Imma, with disordered Ace+ cations. Similar orthorhombic structures were, however, reported for guanidinium (MII = Mn, Fe, Co, Ni, Zn) and formamidinium (MII = Mg, Co, Fe) analogues.10,28,46 AceMn undergoes a temperature-induced phase transition at 304 K into the monoclinic P21/n structure. X-ray diffraction, DSC, dielectric, Raman and IR data prove that the phase transition is associated with the ordering of the Ace+ cations and distortion of the manganese formate framework. IR and Raman data provide evidence for large strengthening of HBs upon cooling. This compound also exhibits weak ferromagnetic properties below 9.0 K.References
- (a) A. Rossin, G. Giambastiani, M. Peruzzini and R. Sessoli, Inorg. Chem., 2012, 51, 6962–6968 CrossRef CAS PubMed; (b) X. Ma, J. Tian, H. Y. Yang, K. Zhao and X. Li, J. Solid State Chem., 2013, 201, 172–177 CrossRef CAS.
- M. Ptak, M. Mączka, A. Gągor, P. Głuchowski and L. Macalik, J. Mater. Chem. C, 2016, 4, 1019–1028 RSC.
- L. Cañadillias-Delgado, O. Fabelo, J. A. Rodriguez-Velamazán, M. H. Lemée Cailleau, S. A. Mason, E. Pardo, F. Lloret, J. P. Zhao, X. H. Bu, V. Simonet, C. V. Colin and J. Rodriguez-Carvajal, J. Am. Chem. Soc., 2012, 134, 19772–19781 CrossRef PubMed.
- (a) A. Ciupa, M. Mączka, A. Gągor, A. Sieradzki, J. Trzmiel, A. Pikul and M. Ptak, Dalton Trans., 2015, 44, 8846–8854 RSC; (b) A. Ciupa, M. Mączka, A. Gągor, A. Pikul and M. Ptak, Dalton Trans., 2015, 44, 13234–13241 RSC; (c) M. Mączka, A. Ciupa, A. Gągor, A. Sieradzki, A. Pikul and M. Ptak, J. Mater. Chem. C, 2016, 4, 1186–1193 RSC.
- (a) M. Mączka, B. Bondzior, P. Dereń, A. Sieradzki, J. Trzmiel, A. Pietraszko and J. Hanuza, Dalton Trans., 2015, 44, 6871–6879 RSC; (b) M. Ptak, M. Mączka, A. Gągor, A. Sieradzki, B. Bondzior, P. Dereń and S. Pawlus, Phys. Chem. Chem. Phys., 2016, 18, 29629–29640 RSC.
- M. Mączka, A. Gągor, N. L. M. Costa, W. Paraguassu, A. Sieradzki and A. Pikul, J. Mater. Chem. C, 2016, 4, 3185–3194 RSC.
- (a) Z.-M. Wang, B. Zhang, H. Fujiwara, H. Kobayashi and M. Kurmoo, Chem. Commun., 2004, 416–417 RSC; (b) X. Y. Wang, L. Gan, S. W. Zhang and S. Gao, Inorg. Chem., 2004, 43, 4615–4625 CrossRef CAS PubMed.
- P. Jain, V. Ramachandran, R. J. Clark, H. D. Zhou, B. H. Toby, N. S. Dalal, H. W. Kroto and A. K. J. Cheetham, J. Am. Chem. Soc., 2009, 131, 13625–13627 CrossRef CAS PubMed.
- B. Zhou, Y. Imai, A. Kobayashi, Z.-M. Wang and H. Kobayashi, Angew. Chem., Int. Ed., 2011, 50, 11441–11445 CrossRef CAS PubMed.
- K.-L. Hu, M. Kurmoo, Z. Wang and S. Gao, Chem. – Eur. J., 2009, 15, 12050–12064 CrossRef CAS PubMed.
- Z. Wang, K. Hu, S. Gao and H. Kobayashi, Adv. Mater., 2010, 22, 1526–1523 CrossRef CAS PubMed.
- G. C. Xu, W. Zhang, X. M. Ma, Y. H. Hen, L. Zhang, H. L. Cai, Z. M. Wang, R. G. Xiong and S. J. Gao, J. Am. Chem. Soc., 2011, 133, 14948–14951 CrossRef CAS PubMed.
- L. C. Gómez-Aguirre, B. Pato-Doldán, J. Mira, S. Castro-García, M. A. Señarís-Rodríguez, M. Sánchez-Andújar, J. Singleton and V. S. Zapf, J. Am. Chem. Soc., 2016, 138, 1122–1125 CrossRef PubMed.
- (a) S. Chen, R. Shang, K.-L. Hu, Z.-M. Wang and S. Gao, Inorg. Chem. Front., 2014, 1, 83–98 RSC; (b) S. Chen, R. Shang, B.-W. Wang, Z.-M. Wang and S. Gao, Angew. Chem., Int. Ed., 2015, 54, 11093–11096 CrossRef CAS PubMed.
- M. Mączka, K. Pasińska, M. Ptak, W. Paraguassu, T. Almeida da Silva, A. Sieradzki and A. Pikul, Phys. Chem. Chem. Phys., 2016, 18, 31653–31663 RSC.
- M. Mączka, A. Gągor, M. Ptak, W. Paraguassu, T. A. da Silva, A. Sieradzki and A. Pikul, Chem. Mater., 2017, 29, 2264–2275 CrossRef.
- (a) A. Stroppa, P. Barone, P. Jain, J. M. Perez-Mato and S. Picozzi, Adv. Mater., 2013, 25, 2284–2290 CrossRef CAS PubMed; (b) D. Di Sante, A. Stroppa, P. Jain and S. Picozzi, J. Am. Chem. Soc., 2013, 135, 18126–18130 CrossRef CAS PubMed; (c) Y. Tian, A. Stroppa, Y. S. Chai, P. Barone, M. Perez-Mato, S. Picozzi and Y. Sun, Phys. Status Solidi RRL, 2015, 9, 62–67 CrossRef CAS.
- S. Ghosh, D. Di Sante and A. Stroppa, J. Phys. Chem. Lett., 2015, 6, 4553–4559 CrossRef CAS PubMed.
- (a) R. Shang, G.-C. Xu, Z. M. Wang and S. Gao, Chem. – Eur. J., 2014, 20, 1146–1158 CrossRef CAS PubMed; (b) I. E. Colins, J. A. Hill, A. B. Cairns, R. I. Cooper, A. L. Thompson, J. E. Parker, C. C. Tang and A. L. Goodwin, Dalton Trans., 2016, 45, 4169–4178 RSC.
- W. Li, M. R. Probert, M. Kosa, T. D. Bennett, A. Thirumurugan, R. P. Burwood, M. Parinello, J. A. K. Howard and A. K. Cheetham, J. Am. Chem. Soc., 2012, 134, 11940–11943 CrossRef CAS PubMed.
- M. Sánchez-Andújar, S. Presedo, S. Yáñez-Vilar, S. Castro-Garcia, J. Shamir and M. A. Señaris-Rodriguez, Inorg. Chem., 2010, 49, 1510–1516 CrossRef PubMed.
- Y. Tian, A. Stroppa, Y. Chai, L. Yan, S. Wang, P. Barone, S. Picozzi and Y. Sun, Sci. Rep., 2014, 4, 6062 CrossRef CAS PubMed.
- M. Mączka, A. Pietraszko, B. Macalik and K. Hermanowicz, Inorg. Chem., 2014, 53, 787–794 CrossRef PubMed.
- (a) M. Mączka, A. Gągor, B. Macalik, A. Pikul, M. Ptak and J. Hanuza, Inorg. Chem., 2014, 53, 457–467 CrossRef PubMed; (b) M. Mączka, A. Sieradzki, B. Bondzior, P. Dereń, J. Hanuza and K. Hermanowicz, J. Mater. Chem. C, 2015, 3, 9337–9345 RSC.
- W.-J. Xu, Z.-Y. Du, W.-X. Zhang and X.-M. Chen, CrystEngComm, 2016, 18, 7915–7928 RSC.
- K. Asadi and M. A. van der Veen, Eur. J. Inorg. Chem., 2016, 4332–4344 CrossRef CAS.
- B. Liu, R. Shang, K.-L. Hu, Z.-M. Wang and S. Gao, Inorg. Chem., 2012, 51, 13363–13372 CrossRef CAS PubMed.
- A. Rossin, M. R. Chierotti, G. Giambiastiani, R. Gobetto and M. Peruzzini, CrystEngComm, 2012, 14, 4454–4460 RSC.
- M. Mączka, A. Ciupa, A. Gągor, A. Sieradzki, A. Pikul, B. Macalik and M. Drozd, Inorg. Chem., 2014, 53, 5260–5268 CrossRef PubMed.
- (a) P. Pato-Doldán, L. C. Gómez-Aguirre, J. M. Bermúdez-Garcia, M. Sánchez-Andújar, A. Fondado, J. Mira, S. Castro-García and M. A. Señarís-Rodríguez, RSC Adv., 2013, 3, 22404–22411 RSC; (b) M. Mączka, N. L. M. Costa, A. Gągor, W. Paraguassu, A. Sieradzki and J. Hanuza, Phys. Chem. Chem. Phys., 2016, 18, 13993–14000 RSC.
- C.-Y. Han, M.-M. Liu and Q.-Q. Dang, Acta Crystallogr., Sect. E: Struct. Rep. Online, 2013, 69, m541 CAS.
- W. J. Xu, K. P. Xie, Z. F. Xiao, W. X. Zhang and X. M. Chen, Cryst. Growth Des., 2016, 76, 7212–7217 Search PubMed.
- W. Travis, E. N. K. Glover, H. Bronstein, D. O. Scanlon and N. G. Palgrave, Chem. Sci., 2016, 7, 4548–4556 RSC.
- (a) G. Kieslich, S. Sun and A. K. Cheetham, Chem. Sci., 2014, 5, 4712 RSC; (b) G. Kieslich, S. Sun and A. K. Cheetham, Chem. Sci., 2015, 6, 3430 RSC.
- CrysAlis CCD and CrysAlis Red, Version 1.171.38.41, Rigaku Oxford Diffraction, 2015 Search PubMed.
- G. M. Sheldrick, SHELXS97, Programs for Crystal Structures Solution and Refinement, University of Göttingen, Göttingen, Germany, 1997 Search PubMed.
- G. M. Sheldrick, Acta Crystallogr., Sect. C: Cryst. Struct. Commun., 2015, 71, 3–8 CrossRef PubMed.
- K. Brandenburg and H. Putz, DIAMOND Version 3.0, Crystal Impact GbR, Bonn, Germany, 2006 Search PubMed.
- M. Ptak, M. Mączka, A. Gągor, A. Sieradzki, A. Stroppa, D. Di Sante, J. M. Perez-Mato and L. Macalik, Dalton Trans., 2016, 45, 2574–2583 RSC.
- F. F. Wang, C. Chen, Y. Zhang, H. Y. Ye, Q. Ye and D. W. Fu, J. Mater. Chem. C, 2015, 3, 6350–6358 RSC.
- R. Samantaray, R. J. Clark, E. S. Choi and N. S. Dalal, J. Am. Chem. Soc., 2012, 134, 15953–15962 CrossRef CAS PubMed.
- A. Cornia, A. Caneschi, P. Dapporto, A. C. Faberetti, D. Gatteschi, W. Malevasi, C. Sangregorio and R. Sessoli, Angew. Chem., Int. Ed., 1999, 38, 1780–1781 CrossRef CAS.
- (a) S. R. Batten and R. Robson, Angew. Chem., Int. Ed. Engl., 1988, 37, 1460–1494 CrossRef; (b) O. M. Yaghi, M. O'Keefe, N. W. Ockwig, H. K. Chae, M. Eddaoudi and J. Kim, Nature, 2003, 423, 705–714 CrossRef CAS PubMed.
- A. L. Spek, PLATON, A Multipurpose Crystallographic Tool, Utrecht University, 2001 Search PubMed.
- W. Li, A. Thirumurugan, P. T. Barton, Z. Lin, S. Henke, H. H. M. Yeung, M. T. Wharmby, E. G. Bithell, C. J. Howard and A. K. Cheetham, J. Am. Chem. Soc., 2014, 136, 7801–7804 CrossRef CAS PubMed.
- A. Ciupa, M. Mączka, A. Gągor, A. Pikul, E. Kucharska, J. Hanuza and A. Sieradzki, Polyhedron, 2015, 85, 137–143 CrossRef CAS.
- J. M. Bermúdez-García, M. Sánchez-Andújar, S. Yáñez-Vilar, S. Castro-García, R. Artiaga, J. López-Beceiro, L. Botana, A. Alegria and M. A. Señarís-Rodríguez, J. Mater. Chem. C, 2016, 4, 4889–4898 RSC.
- Z.-Y. Du, Y.-Z. Sun, S.-L. Chen, B. Huang, Y.-J. Su, T. T. Xu, W.-X. Zhang and X.-M. Chen, Chem. Commun., 2015, 51, 15641–15644 RSC.
- Z.-Y. Du, T. T. Xu, B. Huang, Y.-J. Su, W. Xue, C.-T. He, W.-X. Zhang and X.-M. Chen, Angew. Chem., Int. Ed., 2015, 54, 914–918 CrossRef CAS PubMed.
- G.-Z. Zou, H. Gao, J.-L. Liu, S. P. Zhao, Z.-F. Tian and X.-M. Ren, RSC Adv., 2013, 3, 23596–23603 RSC.
- A. Sieradzki, S. Pawlus, S. N. Tripathy, A. Gągor, A. Ciupa, M. Mączka and M. Paluch, Phys. Chem. Chem. Phys., 2016, 18, 8462–8467 RSC.
- A. Sieradzki, S. Pawlus, S. N. Tripathy, A. Gągor, M. Ptak, M. Paluch and M. Mączka, Dalton Trans., 2017, 46, 3681–3687 RSC.
- T. Besara, P. Jain, N. S. Dalal, P. L. Kuhns, A. P. Reyes, H. W. Kroto and A. K. Cheetham, Proc. Natl. Acad. Sci. U. S. A., 2011, 108, 6828–6832 CrossRef.
- M. Šimėnas, S. Balčiūnas, M. Trzebiatowska, M. Ptak, M. Mączka, G. Völkel, A. Pöppl and J. Banys, J. Mater. Chem. C, 2017, 5, 4526–4536 RSC.
- I. Dzyaloshinsky, J. Phys. Chem. Solids, 1958, 4, 241–255 CrossRef CAS.
- T. Moriya, Phys. Rev., 1960, 120, 91–97 CrossRef CAS.
- W. Wang, L.-Q. Yan, J.-Z. Cong, Y.-L. Zhao, F. Wang, S.-P. Shen, T. Zou, D. Zhang, S.-G. Wang, X.-F. Han and Y. Sun, Sci. Rep., 2013, 3, 2024 CrossRef CAS PubMed.
- (a) M. Mączka, M. Ptak and L. Macalik, Vib. Spectrosc., 2014, 71, 98–104 CrossRef; (b) M. Mączka, W. Zierkiewicz, D. Michalska and J. Hanuza, Spectrochim. Acta, Part A, 2014, 128, 674–680 CrossRef PubMed; (c) M. Mączka, K. Szymborska-Małek, A. Ciupa and J. Hanuza, Vib. Spectrosc., 2015, 77, 17–24 CrossRef.
- (a) M. Davies and E. A. Parsons, Z. Phys. Chem., 1959, 20, 34–41 CrossRef CAS; (b) E. Leon, B. Amekraz, J. Tortajada, J. P. Morizur, A. I. González, O. Mó and M. Yáñez, J. Phys. Chem. A, 1997, 101, 2489–2495 CrossRef CAS.
- E. Kucharska, J. Hanuza, A. Ciupa, M. Mączka and L. Macalik, Vib. Spectrosc., 2014, 75, 45–50 CrossRef CAS.
Footnote |
| † Electronic supplementary information (ESI) available: Tables S1–S3: crystallographic data for AceMn, comparison of structural parameters for AceMn and related compounds, IR and Raman wavenumbers of AceMn and suggested assignments. Fig. S1–S7: XRD patterns, DSC traces, view of the structure, dielectric loss spectra, the IR and Raman spectra at different temperatures, temperature dependence of wavenumbers and FWHM values for selected Raman modes. CCDC 1530423 and 1530424. For ESI and crystallographic data in CIF or other electronic format see DOI: 10.1039/c7dt01251a |
| This journal is © The Royal Society of Chemistry 2017 |