 Open Access Article
Creative Commons Attribution 3.0 Unported Licence
Formation of mono- and binuclear neodymium(III)–gluconate complexes in aqueous solutions in the pH range of 2–8†
Bence
Kutus
*ae,
Norbert
Varga
ae,
Gábor
Peintler
be,
Alexandru
Lupan
c,
Amr A. A.
Attia
c,
István
Pálinkó
de and
Pál
Sipos
 *ae
*ae
aDepartment of Inorganic and Analytical Chemistry, University of Szeged, 7 Dóm tér, H-6720 Szeged, Hungary. E-mail: sipos@chem.u-szeged.hu; kutusb@chem.u-szeged.hu
bDepartment of Physical Chemistry and Material Science, University of Szeged, 1 Rerrich Béla tér, H-6720 Szeged, Hungary
cDepartment of Chemistry, Babes-Bolyai University, 11 Arany Janos Str., RO-400028, Cluj-Napoca, Romania
dDepartment of Organic Chemistry, University of Szeged, 8 Dóm tér, H-6720 Szeged, Hungary
eMaterial and Solution Structure Research Group, Institute of Chemistry, University of Szeged, H-6720 Szeged, Hungary
First published on 28th March 2017
Abstract
The complex formation between Nd(III) and D-gluconate (Gluc−) is of relevance in modelling the chemical equilibria of radioactive waste repositories. In the present work, the formation of NdpGlucqH−r complexes at 25 °C and pH = 2–8 was studied via spectrophotometry, potentiometry, freezing point depression, conductometry and NMR spectroscopy. In addition to the four mononuclear complexes (pq−r = 110, 120, 130 and 11−2), the formation of two binuclear, so far unknown complexes (pq−r = 23−2 and 24−2) was revealed. Between pH = 5.5 and 7, with the increasing metal ion and ligand concentrations, the Nd2Gluc3H−2+ species becomes progressively predominant. Under the conditions characteristic of waste repositories, however, the formation of these complexes can be neglected. Regarding the binding sites of Gluc−, C2–OH and C3–OH groups, in addition to the carboxylate ion, were identified from 1H and 13C spectroscopic measurements. Above pH = 6, the metal–ligand interactions became stronger implying the formation of deprotonated complexes involving the C2–OH group, while the displacement of the second proton at the C3–OH is also possible. The metal ion induced deprotonation of the ligand was confirmed by DFT calculations.
Introduction
In the case of deep geological sites, which are considered as possible nuclear waste repositories, salt-rock formations consisting of NaCl and MgCl2 are likely to be present. The interaction of strongly saline aqueous solutions (formed by an incidental intrusion of water) with the backfilling material of waste containers would promote the mobilization of actinides from the pores and thus significant contamination in the surroundings. Under reducing conditions (regulated by the eroding steel containers), Am and Cm are mainly in their trivalent oxidation states, while Pu is in the forms of Pu(III) and Pu(IV) in aqueous medium.1–10 In order to give chemical models predicting actinide(III) solubility under these conditions, detailed knowledge is required on the effects of (i) complexing ligands present in these repositories, (ii) ionic strength and (iii) temperature.10Nd(III) is a good model for studying the behaviour of trivalent actinides. This replacement is justified by its stable +3 oxidation state, availability and safe usage. On the other hand, similar properties for the coordination compounds of Nd(III), Pu(III), Am(III) and Cm(III) are expected, since the ionic radii change slightly.8,11 (For the eightfold aqua complexes, these data are as follows: 111, 112, 111 and 109 pm, respectively.12)
Considering particularly the Nd3+ ion, another advantage is the sensitivity of its visible spectrum to coordination. This characteristic property was applied successfully in numerous studies of coordination compounds, like for Nd(III)–EDTA and Nd(III)–EDTA–HDTA mixed complexes.13,14
In the presence of cementitious backfilling materials as well as MgCl2, the pH is expected to be buffered to about 8–9 (due to the formation of Mg(OH)2) for the first years in the time-scale of the cement degradation.15 The solubility of Nd(OH)3(s) (expressed as log([Nd(III)]T/M), where the subscript ‘T’ denotes the total concentration of the metal ion and M refers to 1 mol dm−3) is approximately −7 (crystalline hydroxide)16 and −5.5 (aged hydroxide)8 at T = 25 °C, I = 0.1 M NaCl and pH = 8. At 22 °C and 1 M NaClO4, a value of −4 was obtained for the amorphous precipitate.17 The deviations between these values come not only from the different ionic strengths but also from the different morphologies of the solid phases employed: the crystalline Nd(OH)3 has lower solubility than the amorphous ones.18
The Nd3+ aqua-ion is known to form various hydroxido complexes in the general reaction of
| pNd3+ + rH2O = Ndp(OH)r(3p−r)+ + rH+ | (1) |
In this equation, the Ndp(OH)r(3p−r)+ species are equivalent to the r-fold deprotonated Nd(III) aqua complexes (e.g., NdpH−r(3p−r)+). The corresponding dimensionless stability constants can be calculated from the equation:
 | (2) |
At I = 1 M ionic strength and 22 °C, the reported log![[thin space (1/6-em)]](https://www.rsc.org/images/entities/char_2009.gif) β11, log
β11, log![[thin space (1/6-em)]](https://www.rsc.org/images/entities/char_2009.gif) β12, log
β12, log![[thin space (1/6-em)]](https://www.rsc.org/images/entities/char_2009.gif) β13 and log
β13 and log![[thin space (1/6-em)]](https://www.rsc.org/images/entities/char_2009.gif) β22 values are −8.1, −16.2, −24.3 and −11.6, respectively.17
β22 values are −8.1, −16.2, −24.3 and −11.6, respectively.17
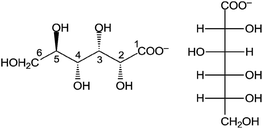
In order to model complex systems, the effect of complexing agents must be taken into consideration. D-Gluconate (Gluc−, Chart 1) is a frequently-studied ligand, since it is present in radioactive waste repositories as a cement additive.19,20
The complexation of Nd3+ with Gluc− can be expressed with similar equations such as eqn (1) and (2):
| pNd3+ + qGluc− = NdpGlucqH−r(3p−q−r)+ + rH+ | (3) |
 | (4) |
By the definition of the βpq−r, the complex is formed by the deprotonation of the ligand and not through the deprotonation of coordinated water molecules. The so-called metal-promoted deprotonation of the OH groups of Gluc− was revealed for the complexes of Pr(III)![[thin space (1/6-em)]](https://www.rsc.org/images/entities/char_2009.gif) 21 and Al(III),22 as well as for Cu(II)23 and Ca(II).24
21 and Al(III),22 as well as for Cu(II)23 and Ca(II).24
The neodymium(III)–gluconate interactions have been studied previously. In the acidic pH range, the NdGluc2+, NdGluc2+ and NdGluc30 species were detected25–30 implying that the metal ion has enough room to bind even three ligands. The formation constants (log![[thin space (1/6-em)]](https://www.rsc.org/images/entities/char_2009.gif) β110, log
β110, log![[thin space (1/6-em)]](https://www.rsc.org/images/entities/char_2009.gif) β120 and log
β120 and log![[thin space (1/6-em)]](https://www.rsc.org/images/entities/char_2009.gif) β130) were found to be 2.55 ± 0.05, 4.45 ± 0.05 and 5.60 ± 0.15 at T = 25 °C and I = 1 M in the acidic range.30 In order to obtain proper stability constants in this region, the protonation of Gluc− must be taken into account. The protonation constant, pKa, was determined to be 3.24 ± 0.01 (1 M NaCl)31 and 3.3 ± 0.1 (1 M NaClO4)32 at T = 25 °C.
β130) were found to be 2.55 ± 0.05, 4.45 ± 0.05 and 5.60 ± 0.15 at T = 25 °C and I = 1 M in the acidic range.30 In order to obtain proper stability constants in this region, the protonation of Gluc− must be taken into account. The protonation constant, pKa, was determined to be 3.24 ± 0.01 (1 M NaCl)31 and 3.3 ± 0.1 (1 M NaClO4)32 at T = 25 °C.
In a broader pH range, multiple deprotonated Nd3+–Gluc− complexes are also formed. Along with NdGlucH−1+, NdGlucH−20, NdGluc2H−10 and NdGluc2H−2−,25–29 NdGlucH−3− is formed at high pH.25
These previous measurements in the Nd(III)–Gluc− system were conducted under different experimental conditions (i.e., temperature, ionic strength, pH-range and ligand to metal ratio), thus, the results cannot be compared directly. It is also noteworthy that the metal ion dependence was omitted in spite of being important in detecting multinuclear complexes. Such species were found to be formed with copper(II)23 and calcium(II).24
Furthermore, spectroscopic information in respect of the binding sites of the ligand as well as the possible structure of the complexes is still missing. Nevertheless, the participation of the C2–OH group in the coordination based on the log![[thin space (1/6-em)]](https://www.rsc.org/images/entities/char_2009.gif) β110vs. pKa correlation was proposed earlier.30 According to the physicochemical similarities within the lanthanide series, the results for other Ln(III)–Gluc− systems21,33,34 may be used for the description of the Nd(III)–Gluc− species. In the case of Eu(III), the binding sites were assigned to be the C2–OH and C3–OH groups (besides carboxylate) at acidic pH.33 With respect to the Pr(III)-containing systems, it was proposed that Gluc− was bound to the metal ion through its carboxylate, C2–O− and C4–O− moieties in the PrGlucH−20 and PrGluc2H−10 complexes forming at higher pH.2113C NMR studies in similar systems corroborated the coordination of the COO− and C2–OH groups in various LnGluc2+ complexes.34 Moreover, the carboxylate acted as the monodentate binding site.
β110vs. pKa correlation was proposed earlier.30 According to the physicochemical similarities within the lanthanide series, the results for other Ln(III)–Gluc− systems21,33,34 may be used for the description of the Nd(III)–Gluc− species. In the case of Eu(III), the binding sites were assigned to be the C2–OH and C3–OH groups (besides carboxylate) at acidic pH.33 With respect to the Pr(III)-containing systems, it was proposed that Gluc− was bound to the metal ion through its carboxylate, C2–O− and C4–O− moieties in the PrGlucH−20 and PrGluc2H−10 complexes forming at higher pH.2113C NMR studies in similar systems corroborated the coordination of the COO− and C2–OH groups in various LnGluc2+ complexes.34 Moreover, the carboxylate acted as the monodentate binding site.
Thus, to reveal the stoichiometry of the complexes as well as the possible binding sites of the ligand, we decided to reinvestigate this system from the acidic to the slightly alkaline pH (2 < pH < 8). We also aimed at the determination of the stability of the various species to assess the impact of Gluc− on the Nd(III) distribution both under the conditions of the waste repositories and the more concentrated solutions. To obtain a comprehensive speciation picture of these systems, various experimental means were used simultaneously, as this approach often results in observations, which remain “hidden”, when only one technique is employed.21–24,34,35 Accordingly, in the present paper, we report our results obtained from spectrophotometric, potentiometric, freezing point depression, conductometric, 1H and 13C NMR spectroscopic measurements. These experimental methods were complemented with quantum chemical calculations also presented here.
Experimental section
Materials and solutions
Neodymium(III) chloride hexahydrate (Aldrich, 99.9%) and sodium-D-gluconate (Sigma, ≥99%) were used as received. An approximately 1 M stock solution of NaOH was prepared from a highly concentrated (ca. 50% w/w), carbonate-free NaOH solution via gravimetric dilution and it was standardized with HCl. An approximately 1 M stock solution of HCl was prepared by volumetric dilution of concentrated HCl (ca. 37% w/w) and its exact concentration was determined by acid–base titration (using dried KHCO3 as the primary standard). Both NaOH pellets (Analar Normapur) and HCl solution (Scharlau) were of analytical reagent grade. The NdCl3-content of the hygroscopic NdCl3·xH2O was determined by EDTA titration as was suggested previously.36 (Additionally, the results of these titrations were confirmed by annealing the salt at 250 °C for six hours in an oven.) The ionic strength was adjusted by using NaCl (a. r. grade, Analar Normapur). Deionized water (Merck Millipore Milli-Q) was used to prepare the samples in every case.Spectrophotometry
The spectra were recorded in the wavelength range of 400–700 nm on a Shimadzu 1650-PC UV-Vis double beam spectrophotometer. The optical path length of the quartz cuvette was 1 cm. All solutions were measured at room temperature (25 ± 2) °C, and the ionic strength was adjusted to 1 M.The Gluc−-containing samples were made by varying (a) [NaGluc]T, (b) [NaOH]T, (c) [HCl]T and (d) [NdCl3]T (hereafter [X]T or [X] refer to the total or equilibrium concentration of the component X). For series (a)–(c), [NdCl3]T was set to 0.075 M. For (a), [Gluc−]T was varied between 0.025–0.275 M. For the pH-dependent sets, [NaOH]T or [HCl]T were changed between 0 and 0.120 M at ligand to metal ratios of 1![[thin space (1/6-em)]](https://www.rsc.org/images/entities/char_2009.gif) :
:![[thin space (1/6-em)]](https://www.rsc.org/images/entities/char_2009.gif) 1, 1
1, 1![[thin space (1/6-em)]](https://www.rsc.org/images/entities/char_2009.gif) :
:![[thin space (1/6-em)]](https://www.rsc.org/images/entities/char_2009.gif) 2.5 and 1
2.5 and 1![[thin space (1/6-em)]](https://www.rsc.org/images/entities/char_2009.gif) :
:![[thin space (1/6-em)]](https://www.rsc.org/images/entities/char_2009.gif) 5. A mauve-coloured precipitate was formed at [Gluc−]T/[Nd3+]T = 1 and 2.5 when [NaOH]T was higher than 0.100 M. (The precipitation occurred several hours after the sample preparation.)
5. A mauve-coloured precipitate was formed at [Gluc−]T/[Nd3+]T = 1 and 2.5 when [NaOH]T was higher than 0.100 M. (The precipitation occurred several hours after the sample preparation.)
In the Nd(III)-dependent samples [NdCl3]T was changed from 0.025 to 0.075 M. [Gluc−]T was set to 0.050 M (containing no added NaOH or HCl), 0.100 M (three sets with [NaOH]T = 0–0.030 M and one set with [HCl]T = 0.030 M) and 0.300 M (three sets with [NaOH]T = 0–0.030 M). Precipitation was not observed in these solutions.
Another side-reaction is the lactonization of D-gluconic acid. In the acidic range (below pH ≈ 5), the slow formation of the D-gluconic acid γ- and δ-lactones can be observed (the latter is faster).37,38 This reaction is, however, expected to be slower in the Nd(III)-containing samples, since the ligand is bound to the metal ion. Nevertheless, to minimize the effect of lactonization, the samples were measured right after their preparation.
The spectra (in the 550–610 nm range) were evaluated with the potentiometric data simultaneously employing the PSEQUAD39 program. The spectrum of NdCl3 was fixed and was calculated from independent calibrations. (The molar absorption coefficient was found to be (6.70 ± 0.02) M−1 cm−1 at 575 nm.)
Potentiometry
Potentiometric titrations were performed by using a Jenway 3540 Bench Combined Conductivity/pH Meter. The combined glass electrode (type 924005) was calibrated by acid–base titration prior to the measurements. The calibration and the measurements were performed under the same conditions, thus, the cell potentials could be directly converted into −log([H+]/M) values. The samples were stirred continuously, and were thermostated to (25.0 ± 0.1) °C. For all experiments, the ionic strength was set to 1 M and an N2 atmosphere was employed to exclude CO2.Four titrations were carried out, and the following initial concentrations were used for [NdCl3]T, [NaGluc]T and [NaOH]T: (a) 0.025, 0.025 and 0.007 M; (b) 0.025, 0.300 and 0.031 M; (c) 0.050, 0.095 and 0.061 M; and (d) 0.050, 0.300 and 0.081 M. The initial volume was 70 cm3 in all cases.
To minimize the effect of lactonization, the measurements were started from pH = 7–8 instead of the acidic range23 and the titrant was 1.026 M HCl solution, except for (a), where 0.103 M was used.
Freezing point depression
This simple method using very simple means was found to be useful to support the results obtained via other methods.24 For relatively dilute solutions, the theoretical freezing point depression (ΔTf,theo) is proportional to the free concentration of the species X (Blagden's law):| ΔTf,theo = Tf,water − Tf,solution = Kf,water·[X] | (5) |
A Beckmann thermometer was applied for the measurements capable of measuring temperature changes of 0.01 °C accuracy. The reference point (Tf,water) was the observed freezing point of the deionized water, while the coolant was the mixture of water, ice and NaCl. Freezing points were determined when solid samples reached the pulpy state providing good heat transfer between the two phases.
The samples consisted of [NdCl3] = 0.075 M and/or [NaGluc]T = 0.188 M, as well as [NaOH]T = 0–0.100 M. Since NaCl also causes freezing point depression, the ionic strength was not adjusted.
Conductometry
Conductometric titrations were carried out using a Jenway 3540 Bench Combined Conductivity/pH Meter and a conductivity cell (type 027013, cell constant: 1.0 cm−1). The solutions were stirred continuously under an N2 atmosphere and the temperature was kept constant at (25.0 ± 0.1) °C.Samples (the initial volume was 60 cm3) containing [NdCl3]T = 0.075 M and/or [NaGluc]T = 0.183 M were titrated with 1.029 M NaOH. For studying the effect of dilution, several runs were carried out by ‘titrating’ the solution with deionized water (specific conductivity: 1.7 μS cm−1). Additional NaCl was not used to adjust the ionic strength.
The results are reported briefly herein. A detailed description together with the titration curves is given in the ESI.†
Nuclear magnetic resonance spectroscopy
1H and 13C NMR spectra were recorded on a Bruker Avance DRX 500 MHz NMR spectrometer equipped with a 5 mm inverse broadband probe head furnished with z oriented magnetic field gradient capability. The magnetic field was stabilized by locking it to the 2D signal of the solvent before the measurements. The sample temperature was set at (25 ± 1) °C during all data acquisitions. For the individual samples, 128 and 512 interferograms were collected to record the 1H NMR and 13C NMR spectra, respectively.NdCl3-dependent 1H and 13C NMR spectra were recorded in solutions containing [NaGluc]T = 0.100 M and [NdCl3]T = 0–0.020 M. The pH-dependent spectra (4 < pH < 8) were obtained for the samples with [NaGluc]T = 0.100 M, [NdCl3] = 0.005 M. (The ionic strength was not adjusted.)
The pH was set by the addition of HCl or NaOH solutions, while the pH of the solutions was determined with a SenTix 62 combined glass electrode (WTW). The calibration of the electrode was carried out with commercial buffers. The samples were placed into PTFE liners and then these liners were inserted into external quartz tubes containing D2O. Consequently, D2O was outside the solutions, therefore corrections to the measured potentials were not needed.
Quantum chemical calculations
Geometry optimizations were carried out with the ORCA software package (version 3.0.3).40 All calculations were performed by utilizing the PBE0 hybrid DFT functional coupled with the Stuttgart/Dresden (SDD) Effective Core Pseudopotential (ECP) [SD(60,MWB)] for Nd41 and the def2-SVP basis set42 for the lighter atoms as implemented in ORCA. The computations were performed in implicit water by applying the conductor-like screening model (COSMO)43 as well as by implementing explicit water molecules into the structures in order to obtain a more realistic coordination sphere for Nd3+. Thus, the metal ion in all initial structures had a coordination number of eight.Results and discussion
Spectrophotometric and potentiometric measurements in the presence of Gluc−
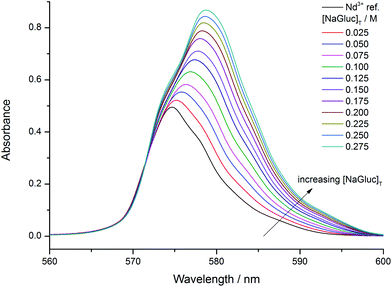
The gluconate-dependent visible spectra (series (a), Fig. 1) clearly show that with increasing ligand concentration the spectra shift toward higher wavelengths. Moreover, the maximum absorbance increases as well. Hence, complex formation is strongly indicated in this series agreeing with the previous results.30 Accordingly, the predominant species are expected to be the NdGluc2+, NdGluc2+ and the NdGluc30 ones.The spectra differ markedly upon addition of NaOH (series (b)). At a ligand to metal ratio of 1![[thin space (1/6-em)]](https://www.rsc.org/images/entities/char_2009.gif) :
:![[thin space (1/6-em)]](https://www.rsc.org/images/entities/char_2009.gif) 1, a significant red shift with increasing absorbance can be observed as for the ligand dependence. The absence of one single isosbestic point indicates the formation of more than two deprotonated Nd(III)–Gluc− complexes. These measurements are depicted in Fig. S1 in the ESI.†
1, a significant red shift with increasing absorbance can be observed as for the ligand dependence. The absence of one single isosbestic point indicates the formation of more than two deprotonated Nd(III)–Gluc− complexes. These measurements are depicted in Fig. S1 in the ESI.†
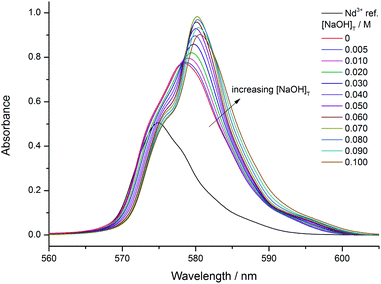
Upon increasing the ligand to metal ratio to 2.5![[thin space (1/6-em)]](https://www.rsc.org/images/entities/char_2009.gif) :
:![[thin space (1/6-em)]](https://www.rsc.org/images/entities/char_2009.gif) 1 (Fig. 2), a new isosbestic point shows up at 583 nm above [NaOH]T = 0.080 M referring to further deprotonation. The variations also indicate that this complex has smaller molar absorptivity. Similar changes were observed for the 5
1 (Fig. 2), a new isosbestic point shows up at 583 nm above [NaOH]T = 0.080 M referring to further deprotonation. The variations also indicate that this complex has smaller molar absorptivity. Similar changes were observed for the 5![[thin space (1/6-em)]](https://www.rsc.org/images/entities/char_2009.gif) :
:![[thin space (1/6-em)]](https://www.rsc.org/images/entities/char_2009.gif) 1 ratio.
1 ratio.
It has to be noted here that for the ratios of 1![[thin space (1/6-em)]](https://www.rsc.org/images/entities/char_2009.gif) :
:![[thin space (1/6-em)]](https://www.rsc.org/images/entities/char_2009.gif) 1 and 2.5
1 and 2.5![[thin space (1/6-em)]](https://www.rsc.org/images/entities/char_2009.gif) :
:![[thin space (1/6-em)]](https://www.rsc.org/images/entities/char_2009.gif) 1, a pale mauve-coloured precipitate was formed slowly above [NaOH]T > 0.100 M. At the 2.5
1, a pale mauve-coloured precipitate was formed slowly above [NaOH]T > 0.100 M. At the 2.5![[thin space (1/6-em)]](https://www.rsc.org/images/entities/char_2009.gif) :
:![[thin space (1/6-em)]](https://www.rsc.org/images/entities/char_2009.gif) 1 ratio with 0.1 M NaOH, the pH was calculated to be 7.33 by means of our model, see below. Without gluconate, the solubility of Nd(III) (in terms of log([Nd(III)]T/M)) at pH = 7.3 is about −3.5 (0.5 M NaCl)8 and −2.8 (1 M NaClO4).17 Our observations (log([Nd(III)]T/M) = −1.1) show that Gluc− enhances the solubility of Nd3+via complexation with at least one order of magnitude pointing out the significance of gluconate in the case of waste repositories. That is, the presence of the ligand can enhance the mobility of radioactive elements.
1 ratio with 0.1 M NaOH, the pH was calculated to be 7.33 by means of our model, see below. Without gluconate, the solubility of Nd(III) (in terms of log([Nd(III)]T/M)) at pH = 7.3 is about −3.5 (0.5 M NaCl)8 and −2.8 (1 M NaClO4).17 Our observations (log([Nd(III)]T/M) = −1.1) show that Gluc− enhances the solubility of Nd3+via complexation with at least one order of magnitude pointing out the significance of gluconate in the case of waste repositories. That is, the presence of the ligand can enhance the mobility of radioactive elements.
The HCl-dependent spectra (series (c)) at a 1![[thin space (1/6-em)]](https://www.rsc.org/images/entities/char_2009.gif) :
:![[thin space (1/6-em)]](https://www.rsc.org/images/entities/char_2009.gif) 1 ratio (Fig. S2†) obviously show that with increasing [HCl]T the ligand is gradually displaced from the complexes because of its protonation. Further isosbestic points do not appear excluding the formation of Nd(III)–HGluc complexes. At a higher ratio (2.5
1 ratio (Fig. S2†) obviously show that with increasing [HCl]T the ligand is gradually displaced from the complexes because of its protonation. Further isosbestic points do not appear excluding the formation of Nd(III)–HGluc complexes. At a higher ratio (2.5![[thin space (1/6-em)]](https://www.rsc.org/images/entities/char_2009.gif) :
:![[thin space (1/6-em)]](https://www.rsc.org/images/entities/char_2009.gif) 1, Fig. S3†), the extent of the displacement of the ligand is lower due to stronger complex formation. In Fig. S4,† an example for the NdCl3-dependence (series (d), [NaGluc]T = 0.100 M and [NaOH]T = 0.010 M) is given.
1, Fig. S3†), the extent of the displacement of the ligand is lower due to stronger complex formation. In Fig. S4,† an example for the NdCl3-dependence (series (d), [NaGluc]T = 0.100 M and [NaOH]T = 0.010 M) is given.
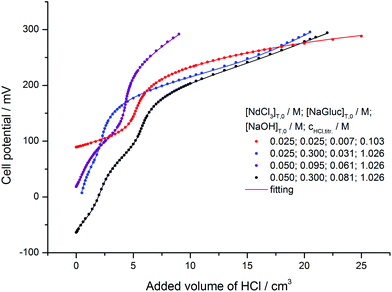
Remarkable potential effects were found in potentiometric titrations (Fig. 3). The presence of the inflection points, similarly to the isosbestic points, corroborates the formation of various deprotonated complexes. At 12![[thin space (1/6-em)]](https://www.rsc.org/images/entities/char_2009.gif) :
:![[thin space (1/6-em)]](https://www.rsc.org/images/entities/char_2009.gif) 1 and 6
1 and 6![[thin space (1/6-em)]](https://www.rsc.org/images/entities/char_2009.gif) :
:![[thin space (1/6-em)]](https://www.rsc.org/images/entities/char_2009.gif) 1 ligand to metal ratios (black and blue symbols), the protonation of Gluc− is seen, while for the red titration curve (1
1 ligand to metal ratios (black and blue symbols), the protonation of Gluc− is seen, while for the red titration curve (1![[thin space (1/6-em)]](https://www.rsc.org/images/entities/char_2009.gif) :
:![[thin space (1/6-em)]](https://www.rsc.org/images/entities/char_2009.gif) 1 ratio) this equilibrium cannot be clearly observed due to the stronger complex formation.
1 ratio) this equilibrium cannot be clearly observed due to the stronger complex formation.
Despite the sensitivity of the absorption spectra upon complexation, the observed shift is known to lower compared to that of the transition metals.44 Thus, the aim of the simultaneous fitting was to improve the accuracy of the determined stability constants and to obtain a chemical model which is supported by both methods.
Accordingly, the evaluation of the absorption spectra and the potentiometric titration curves revealed the formation of four mononuclear (NdGluc2+, NdGluc2+, NdGluc30 and the NdGlucH−20) and two highly stable binuclear complexes (Nd2Gluc3H−2+ and Nd2Gluc4H−20). The highest standard deviation for the titration curves was 1.4 mV (purple curve in Fig. 3). The formation constants determined by the two methods as well as the respective literature data are reported in Table 1. The calculated cell potentials and molar absorbance spectra are presented in Fig. 3 and 4, respectively.
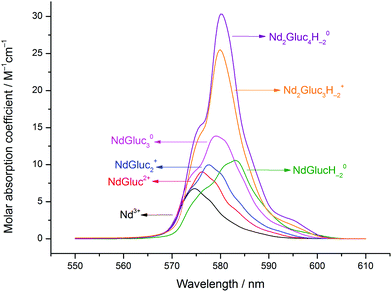 | ||
| Fig. 4 Molar absorbance spectra of the neodymium(III) aqua ion and its complexes formed in the Nd(III)–gluconate (Gluc−) system. Experimental conditions: T = 25 °C, I = 1 M (NaCl). | ||
![[thin space (1/6-em)]](https://www.rsc.org/images/entities/char_2009.gif) βpq−r) determined at 25 °C and I = 1 M (NaCl). The corresponding literature reports are also indicated
βpq−r) determined at 25 °C and I = 1 M (NaCl). The corresponding literature reports are also indicated
| Reaction | log![[thin space (1/6-em)]](https://www.rsc.org/images/entities/char_2009.gif) βpq−r ± 3 SD βpq−r ± 3 SD |
Ref. | Conditions | Methoda |
|---|---|---|---|---|
a POT, SPM and NMR are the abbreviations for spectrophotometry, potentiometry and nuclear magnetic resonance spectroscopy.
b The pKa values of Gluc− are given (pKa = log![[thin space (1/6-em)]](https://www.rsc.org/images/entities/char_2009.gif) β011). β011).
|
||||
| Gluc− + H+ = HGluc | 3.35 ± 0.01b | Present work | T = 25 °C, I = 1 M (NaCl) | POT |
| 3.24 ± 0.03b | 31 | T = 25 °C, I = 1 M (NaCl) | NMR | |
| 3.30 ± 0.10b | 32 | T = 25 °C, I = 1 M (NaClO4) | POT | |
| Nd3+ + Gluc− = NdGluc2+ | 2.44 ± 0.02 | Present work | T = 25 °C, I = 1 M (NaCl) | SPM + POT |
| 2.59 ± 0.05 | 30 | T = 25 °C, I = 1 M (NaClO4) | SPM | |
| 2.55 ± 0.05 | 30 | T = 25 °C, I = 1 M (NaClO4) | POT | |
| 2.66 ± 0.03 | 27 | T = 25 °C, I is not indicated | POT | |
| 2.72 | 26 | T = 25 °C, I is not indicated | POT | |
| 2.37 | 29 | T = 32 °C, I is not indicated | POT | |
| Nd3+ + 2Gluc− = NdGluc2+ | 4.32 ± 0.02 | Present work | T = 25 °C, I = 1 M (NaCl) | SPM + POT |
| 4.52 ± 0.07 | 30 | T = 25 °C, I = 1 M (NaClO4) | SPM | |
| 4.45 ± 0.05 | 30 | T = 25 °C, I = 1 M (NaClO4) | POT | |
| 4.70 ± 0.09 | 27 | T = 25 °C, I is not indicated | POT | |
| Nd3+ + 3Gluc− = NdGluc30 | 5.46 ± 0.02 | Present work | T = 25 °C, I = 1 M (NaCl) | SPM + POT |
| 5.53 ± 0.07 | 30 | T = 25 °C, I = 1 M (NaClO4) | SPM | |
| 5.60 ± 0.15 | 30 | T = 25 °C, I = 1 M (NaClO4) | POT | |
| Nd3+ + Gluc− = NdGlucH−1+ + H+ | −3.73 | 26 | T = 25 °C, I is not indicated | POT |
| −3.53 | 29 | T = 32 °C, I is not indicated | POT | |
| NdGluc2+ = NdGlucH−1+ + H+ | 6.45 | 26 | T = 25 °C, I is not indicated | POT |
| 5.90 | 29 | T = 32 °C, I is not indicated | POT | |
| Nd3+ + Gluc− = NdGlucH−20 + 2H+ | −9.51 ± 0.02 | Present work | T = 25 °C, I = 1 M (NaCl) | SPM + POT |
| −9.96 | 26 | T = 25 °C, I is not indicated | POT | |
| −10.17 | 29 | T = 32 °C, I is not indicated | POT | |
| NdGlucH−1+ = NdGlucH−20 + H+ | 6.23 | 26 | T = 25 °C, I is not indicated | POT |
| 6.64 | 29 | T = 32 °C, I is not indicated | POT | |
| NdGluc2+ = NdGluc2H−10 + H+ | 6.18 | 28 | T = 25 °C, I = 0.2 M (KCl) | SPM |
| 2Nd3+ + 2Gluc− = Nd2Gluc3H−2+ + 2 H+ | −1.97 ± 0.03 | Present work | T = 25 °C, I = 1 M (NaCl) | SPM + POT |
| 2Nd3+ + 4Gluc− = Nd2Gluc4H−20 + 2 H+ | −0.85 ± 0.05 | Present work | T = 25 °C, I = 1 M (NaCl) | SPM + POT |
It is important that both binuclear species were needed to provide proper interpretation of the experimental data below about 150 mV. (The fittings of the potentiometric curves by omitting these complexes are seen in Fig. S5.†) The formation of Nd2Gluc4H−20 seems also reasonable because of the higher ligand/metal ratios employed in the case of potentiometry. The existence of such complexes was not reported in the literature previously which might be due to the lower concentrations of Nd(III) used. It has to be noted here that the use of such high concentrations for Nd3+ and Gluc− is unusual in the context of previous solubility studies of trivalent actinides/lanthanides.7,8,10,16,17,20 However, our primary goal of the present study was to reach the concentration range where multinuclear complexes are incidentally formed.
The existence of Nd2Gluc3H−2+ and Nd2Gluc4H−20 reflects the affinity of Nd(III) to dimerize: without gluconate, the metal ion is known to form Nd2(OH)24+.17,45,46 With respect to the one-fold deprotonated complexes (NdGlucH−1+ and NdGluc2H−10),25–29 they were not detected under the conditions of these experiments. Their formation is probably suppressed by the more stable 1![[thin space (1/6-em)]](https://www.rsc.org/images/entities/char_2009.gif) :
:![[thin space (1/6-em)]](https://www.rsc.org/images/entities/char_2009.gif) 1
1![[thin space (1/6-em)]](https://www.rsc.org/images/entities/char_2009.gif) :
:![[thin space (1/6-em)]](https://www.rsc.org/images/entities/char_2009.gif) −2 one as well as the binuclear complexes (they form faster). This observation applies to the various hydroxido complexes of Nd(III),8,17,45,46 since the inclusion of these species in the model was not necessary.
−2 one as well as the binuclear complexes (they form faster). This observation applies to the various hydroxido complexes of Nd(III),8,17,45,46 since the inclusion of these species in the model was not necessary.
The protonation constant of Gluc−, as well as the stability products for the 1![[thin space (1/6-em)]](https://www.rsc.org/images/entities/char_2009.gif) :
:![[thin space (1/6-em)]](https://www.rsc.org/images/entities/char_2009.gif) 1, 1
1, 1![[thin space (1/6-em)]](https://www.rsc.org/images/entities/char_2009.gif) :
:![[thin space (1/6-em)]](https://www.rsc.org/images/entities/char_2009.gif) 2 and 1
2 and 1![[thin space (1/6-em)]](https://www.rsc.org/images/entities/char_2009.gif) :
:![[thin space (1/6-em)]](https://www.rsc.org/images/entities/char_2009.gif) 3 complexes (ref. 30 and 32) along with their molar absorbance spectra agree well with our values (Table 1). The highest discrepancy is observed for the NdGlucH−20 complex. According to ref. 26 and 29, the log
3 complexes (ref. 30 and 32) along with their molar absorbance spectra agree well with our values (Table 1). The highest discrepancy is observed for the NdGlucH−20 complex. According to ref. 26 and 29, the log![[thin space (1/6-em)]](https://www.rsc.org/images/entities/char_2009.gif) β11−2 is about a half order of magnitude lower (Table 1). If this difference is not caused only by the different ionic strengths, then it can be attributed to the binuclear species, whose formation affect considerably the actual value of log
β11−2 is about a half order of magnitude lower (Table 1). If this difference is not caused only by the different ionic strengths, then it can be attributed to the binuclear species, whose formation affect considerably the actual value of log![[thin space (1/6-em)]](https://www.rsc.org/images/entities/char_2009.gif) β11−2 (these complexes were not included in those models).
β11−2 (these complexes were not included in those models).
For the neighbouring Pr3+, the PrGluc2+, PrGluc2+, PrGlucH−1+, PrGlucH−20 and PrGluc2H−10 complexes were found in addition to the PrGluc2H−3− species.21 The formation of PrGluc30 was not reported, neither was that of the binuclear complexes. At the same time, the total concentration of Pr(III) was more than one order of magnitude lower. The authors identified, however, the 2![[thin space (1/6-em)]](https://www.rsc.org/images/entities/char_2009.gif) :
:![[thin space (1/6-em)]](https://www.rsc.org/images/entities/char_2009.gif) 2
2![[thin space (1/6-em)]](https://www.rsc.org/images/entities/char_2009.gif) :
:![[thin space (1/6-em)]](https://www.rsc.org/images/entities/char_2009.gif) −3 species with D-gulonate. The complex of the same stoichiometry was observed for Cu(II) and Gluc− as well. (Such a complex can be included in our model, resulting in less than 5% improvement in the fitting parameter which is too low to ascribe it to a new species.) In a later study, the M2Gluc2H−5− complex was found to be formed with La(III), Eu(III), Dy(III), Er(III) and Lu(III).34 Multinuclear complexes were identified in the presence of Ca2+ as well, namely the Ca2GlucH−30 and Ca3Gluc2H−40 ones.24
−3 species with D-gulonate. The complex of the same stoichiometry was observed for Cu(II) and Gluc− as well. (Such a complex can be included in our model, resulting in less than 5% improvement in the fitting parameter which is too low to ascribe it to a new species.) In a later study, the M2Gluc2H−5− complex was found to be formed with La(III), Eu(III), Dy(III), Er(III) and Lu(III).34 Multinuclear complexes were identified in the presence of Ca2+ as well, namely the Ca2GlucH−30 and Ca3Gluc2H−40 ones.24
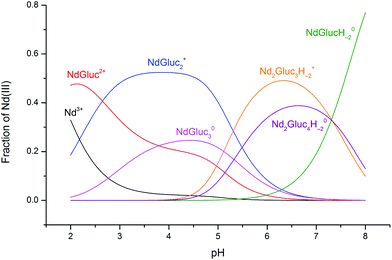
The speciation diagram calculated with the stability products obtained in the present study and using [NdCl3]T = 0.075 M and [NaGluc]T = 0.188 M is seen in Fig. 5. Between pH = 2–2.5, the NdGluc2+ complex is predominant, and then NdGluc2+ is the determining species up to pH ≈ 5. Above this pH, the deprotonated species appear with Nd2Gluc3H−2+ being predominant (the formation of the 2![[thin space (1/6-em)]](https://www.rsc.org/images/entities/char_2009.gif) :
:![[thin space (1/6-em)]](https://www.rsc.org/images/entities/char_2009.gif) 4
4![[thin space (1/6-em)]](https://www.rsc.org/images/entities/char_2009.gif) :
:![[thin space (1/6-em)]](https://www.rsc.org/images/entities/char_2009.gif) −2 species is also significant). Increasing the pH further, the neutral NdGlucH−20 becomes the prevailing complex.
−2 species is also significant). Increasing the pH further, the neutral NdGlucH−20 becomes the prevailing complex.
Another speciation diagram is depicted in Fig. 6 with total concentrations related to the conditions of radioactive waste repositories. By increasing the pH from 6 to 8, log([Nd(III)]T/M) decreases from −2.5 to −5.5 (3 × 10⁻⁶–3 × 10⁻³ M) in the presence of aged Nd(OH)3(s) and 0.5 M NaCl.8 At the same time, [NaGluc]T = 0.010 M is the upper limit considered in numerous solubility studies.20 To extend our results to lower concentration ranges, the 1![[thin space (1/6-em)]](https://www.rsc.org/images/entities/char_2009.gif) :
:![[thin space (1/6-em)]](https://www.rsc.org/images/entities/char_2009.gif) 1
1![[thin space (1/6-em)]](https://www.rsc.org/images/entities/char_2009.gif) :
:![[thin space (1/6-em)]](https://www.rsc.org/images/entities/char_2009.gif) −1 and 1
−1 and 1![[thin space (1/6-em)]](https://www.rsc.org/images/entities/char_2009.gif) :
:![[thin space (1/6-em)]](https://www.rsc.org/images/entities/char_2009.gif) 2
2![[thin space (1/6-em)]](https://www.rsc.org/images/entities/char_2009.gif) :
:![[thin space (1/6-em)]](https://www.rsc.org/images/entities/char_2009.gif) −1 complexes have to be taken into account. Assuming that pK11 < pK11-1 is valid for the NdGluc2+ and NdGlucH−1+ complexes, the pK of ref. 29 (5.90) seems reasonable despite the slightly different temperature. For the 1
−1 complexes have to be taken into account. Assuming that pK11 < pK11-1 is valid for the NdGluc2+ and NdGlucH−1+ complexes, the pK of ref. 29 (5.90) seems reasonable despite the slightly different temperature. For the 1![[thin space (1/6-em)]](https://www.rsc.org/images/entities/char_2009.gif) :
:![[thin space (1/6-em)]](https://www.rsc.org/images/entities/char_2009.gif) 2 species, the pK = 6.18 was chosen from ref. 28. Thus, log
2 species, the pK = 6.18 was chosen from ref. 28. Thus, log![[thin space (1/6-em)]](https://www.rsc.org/images/entities/char_2009.gif) β11−1 = −3.46 and log
β11−1 = −3.46 and log![[thin space (1/6-em)]](https://www.rsc.org/images/entities/char_2009.gif) β12−1 = −1.86 were obtained.
β12−1 = −1.86 were obtained.
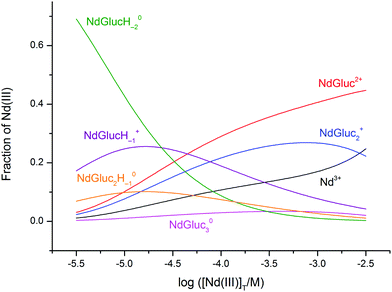 | ||
Fig. 6 The distribution diagram of neodymium(III) in the Nd(III)–gluconate (Gluc−) system. Experimental conditions: T = 25 °C; analytical concentrations: [NaGluc]T = 0.010 M, while log([NdCl3]T/M) = −5.5 varies from −5.5 to −2.5. The calculation was based on the formation constants determined in the present work, except log![[thin space (1/6-em)]](https://www.rsc.org/images/entities/char_2009.gif) β11−1 and log β11−1 and log![[thin space (1/6-em)]](https://www.rsc.org/images/entities/char_2009.gif) β12−1. These were calculated from our constants with the help of the pK values of ref. 28 and 29. β12−1. These were calculated from our constants with the help of the pK values of ref. 28 and 29. | ||
It is seen in Fig. 6 that the 1![[thin space (1/6-em)]](https://www.rsc.org/images/entities/char_2009.gif) :
:![[thin space (1/6-em)]](https://www.rsc.org/images/entities/char_2009.gif) 1
1![[thin space (1/6-em)]](https://www.rsc.org/images/entities/char_2009.gif) :
:![[thin space (1/6-em)]](https://www.rsc.org/images/entities/char_2009.gif) −2 complex is formed to the highest extent up to log([Nd(III)]T/M) ≈ −4.8 (the NdGlucH−1+ and NdGluc2H−10 species are also present in considerable amounts). Above this concentration, only the 1
−2 complex is formed to the highest extent up to log([Nd(III)]T/M) ≈ −4.8 (the NdGlucH−1+ and NdGluc2H−10 species are also present in considerable amounts). Above this concentration, only the 1![[thin space (1/6-em)]](https://www.rsc.org/images/entities/char_2009.gif) :
:![[thin space (1/6-em)]](https://www.rsc.org/images/entities/char_2009.gif) 1, 1
1, 1![[thin space (1/6-em)]](https://www.rsc.org/images/entities/char_2009.gif) :
:![[thin space (1/6-em)]](https://www.rsc.org/images/entities/char_2009.gif) 2 and 1
2 and 1![[thin space (1/6-em)]](https://www.rsc.org/images/entities/char_2009.gif) :
:![[thin space (1/6-em)]](https://www.rsc.org/images/entities/char_2009.gif) 3 species are formed. Accordingly, the binuclear species do not affect the equilibria taking place under the conditions of waste repositories. (In Fig. S6,† a speciation diagram is depicted when log([Nd(III)]T/M) is held at −5.5 (≈3 × 10⁻⁶ M) and the pH range is 2–8. Similarly, the multinuclear complexes are not significant.) By observing a similar chemical behaviour of the Ln(III) and An(III) metal ions, only the mononuclear complexes have to be considered to model the speciation of the An(III)–Gluc− systems under the conditions of repositories at 25 °C.
3 species are formed. Accordingly, the binuclear species do not affect the equilibria taking place under the conditions of waste repositories. (In Fig. S6,† a speciation diagram is depicted when log([Nd(III)]T/M) is held at −5.5 (≈3 × 10⁻⁶ M) and the pH range is 2–8. Similarly, the multinuclear complexes are not significant.) By observing a similar chemical behaviour of the Ln(III) and An(III) metal ions, only the mononuclear complexes have to be considered to model the speciation of the An(III)–Gluc− systems under the conditions of repositories at 25 °C.
Effect of complexation on the freezing point depression and conductance
In order to obtain additional experimental proof for the complexation, solutions containing various concentrations of NdCl3, NaGluc and/or NaOH were studied via freezing point depression and conductometry.In the presence of l components and assuming that there is no physical or chemical association between them, the freezing point depression is proportional to the sum of the total concentrations:
 | (6) |
| [Nd3+]T/M | [Gluc−]T/M | [OH−]T/M | ΔTf,theo/°C | ΔTf,meas/°C | ΔΔTf/°C |
|---|---|---|---|---|---|
| 0.075 | 0 | 0 | 0.56 | 0.54 | 0.02 |
| 0 | 0.188 | 0 | 0.70 | 0.68 | 0.02 |
| 0 | 0 | 0.025 | 0.09 | 0.11 | 0.02 |
| 0 | 0 | 0.050 | 0.19 | 0.17 | 0.02 |
| 0 | 0 | 0.074 | 0.28 | 0.26 | 0.02 |
| 0 | 0 | 0.100 | 0.37 | 0.38 | 0.01 |
| 0.075 | 0.188 | 0 | 1.26 | 0.91 | 0.35 |
| 0.075 | 0.188 | 0.025 | 1.35 | 0.96 | 0.39 |
| 0.075 | 0.188 | 0.050 | 1.44 | 1.01 | 0.43 |
| 0.075 | 0.188 | 0.074 | 1.53 | 1.08 | 0.45 |
| 0.075 | 0.188 | 0.100 | 1.63 | 1.12 | 0.51 |
The ΔΔTf parameter is only 0.01–0.02 °C for the solutions containing either NdCl3, NaGluc or NaOH. Since these components are fully dissociated, the value of 0.02 °C represents the uncertainty of the measurements. In the seventh sample, this measured depression is much lower than the theoretical one implying the formation of the mono- and binuclear complexes. This difference is also high in the following solutions showing that the added OH− is consumed via formation of deprotonated complexes. (The increase in the ΔTf,meas value is caused only by the added Na+ ions.)
The conductometric titrations are depicted in Fig. S7.† The most surprising observation is that when a solution containing [NdCl3]T,0 = 0.075 M and [NaGluc]T,0 = 0.183 M is titrated with 1.029 M NaOH, the conductance increases only by 7.1 mS from the starting point until the appearance of some precipitate (this is at 7.8 cm3 added volume). When water is ‘titrated’ with NaOH, at the same added volume, this increase is much bigger (27.9 mS). Considering the significant contribution of OH− to the overall conductance (being the second highest after that of the H+) the former minor increase indicates a process that consumes NaOH, i.e., the formation of deprotonated complexes.
Effect of Nd3+ on the 1H and 13C NMR spectra of gluconate
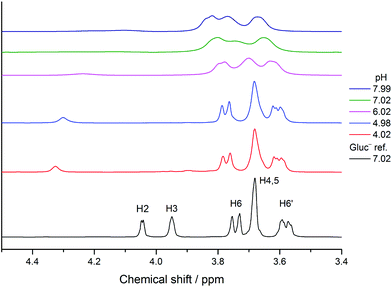
Lanthanides induce a large paramagnetic shift and significant peak broadening arising from the interaction between the unpaired electrons and the NMR active nucleus studied. This effect was scrutinized extensively including neodymium(III).47 In the case of strong interactions, some signals are significantly more shifted and/or broadened than the others, which indicates the binding sites of the ligand. This effect was used to study the Pr(III)– as well as the Eu(III)–Gluc− complexes.21,33Increasing the concentration of NdCl3 from 0.005 to 0.020 M in solutions containing constant, 0.1 M NaGluc causes a general peak shift and broadening even at the highest ligand to metal ratio (Fig. S8†). Remarkable signal widening appears in the spectra for the H2 and H3 nuclei. (The 1H and 13C peak assignations were reported in the literature previously.31,38) The pH decreases from ≈7 to ≈5 at the same time.
Regardless of the higher pH range, speciation calculations (Fig. S9†) show that the ligand is in the form of free ions (55%), and NdGluc2+ and NdGluc30 complexes (19% and 21%). Accordingly, the observed changes are attributed to these species for which the main coordination sites are the OH groups attached to the C2 and C3 carbon atoms (Chart 1). (This assumption holds probably for the 1![[thin space (1/6-em)]](https://www.rsc.org/images/entities/char_2009.gif) :
:![[thin space (1/6-em)]](https://www.rsc.org/images/entities/char_2009.gif) 1 complex as well.) This coordination moiety is supported by the 13C NMR spectrum of 0.1 M NaGluc and 0.005 M NdCl3 (Fig. S10†). In addition to the peaks of C2 and C3, the signal of C1 also disappears in the presence of Nd3+ (it is probably shifted to higher chemical shifts). Consequently, the COO− ion also takes place in the coordination, which is common for ligands having this functionality.
1 complex as well.) This coordination moiety is supported by the 13C NMR spectrum of 0.1 M NaGluc and 0.005 M NdCl3 (Fig. S10†). In addition to the peaks of C2 and C3, the signal of C1 also disappears in the presence of Nd3+ (it is probably shifted to higher chemical shifts). Consequently, the COO− ion also takes place in the coordination, which is common for ligands having this functionality.
The participation of the C2–OH moiety in metal binding was proposed earlier for the NdGluc2+, PrGluc2+ and PrGluc2+ complexes.21,30 Moreover, C3–OH was also identified as a coordination site for the EuGluc2+ and CaGluc2+ species.24,33
The pH-dependence provided further insight into the solution structure of these complexes. In the 1H NMR spectra, the signals of H2 and H3 nuclei are shifted and broadened again markedly (Fig. 7). This coordination moiety is supported by the 13C NMR spectra (Fig. S11†), since the intensities of C2 and C3 decrease significantly.
From pH = 6, further signal broadening can be detected implying a stronger interaction between the paramagnetic metal center and the ligand. The formation of deprotonated complexes can explain these variations, since the forming alcoholate ions are very effective binding sites (the Nd3+–O− bond lengths are possibly shorter than the Nd3+–OH ones). As seen in the distribution diagram, the two binuclear complexes as well as NdGlucH−20 appear to form in a considerable amount compared to [NaGluc]T if pH > 6 (Fig. S12†). The peaks of H2, H3, C2 and C3 are the most significantly affected ones, thus, their chemical environment varies the most. Consequently, either the C2–OH or both the C2–OH and the C3–OH groups are deprotonated.
Considering NdGlucH−20, it is possible that the first deprotonation occurs on the C2–OH group while the second on a coordinated water molecule. At the same time, this coordination moiety seems reasonable for the C3–OH group as well. The third structure assumes that both groups are deprotonated. Probably, a mixture of such isomers is seen in the NMR spectra. It is possible that a mixture of isomers is seen, however, they cannot be distinguished (since each of them causes signal broadening).
In the literature, the deprotonation of both C2–OH and C3–OH groups was suggested for the Ca3Gluc2H−40 species.24 In the case of Cu2+, the deprotonation of C2–OH was reported.23 Additionally, the displacement of protons from the C4–OH group was proposed for the PrGlucH−20 species.21
Quantum chemical calculations on the structure of the NdGlucH−20 complex
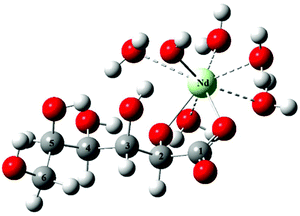
Based on the speciation diagram depicted in Fig. 5, the predominant complex at pH = 8 is the NdGlucH−20. In the present study, this species was chosen to perform structure optimizations. The initial structures were designed to obtain different coordination modes with the C2–OH and C3–OH groups being deprotonated (based on the NMR spectra). The calculations were carried out adding implicit and explicit water molecules to reach the coordination number eight around Nd3+.The structure of the lowest energy for NdGlucH−20 can be seen in Fig. 8. The metal ion is attached to the carboxylate (acting as a monodentate binding site) and the C2–O− ion. Surprisingly, instead of the deprotonation of the C3–OH group, the proton displacement occurs on a water molecule establishing an Nd–OH bond. The respective bond lengths for Nd–O(C1), Nd–O(C2) and Nd–OH are 2.33, 2.28 and 2.28 Å. In the tetrakis(pyridinioacetate)neodymium(III)tetrahydrate perchlorate crystal the metal–carboxylate bond lengths were found to be 2.36–2.44 Å.48 The coordination number around the metal is eight since there are five coordinated water molecules for which the bond lengths range from 2.54 to 2.62 Å. For aqueous NdCl3 solutions, an average Nd3+–H2O distance of 2.51 Å was deduced,49 while 2.46–2.51 Å was reported for the tetrakis(pyridinioacetate) complex.48
In the other two structures, the metal ion is bound to the C3–O− group and a hydroxide ion (Fig. S13†) or to C2–O− and C3–O− groups (Fig. S14†). These structures are 30.8 and 33.0 kJ mol−1 higher in energy implying that the first coordination moiety is the most preferred.
Conclusions
Gluc− affects significantly the electronic spectrum of the Nd3+ aqua ion, as well as the pH implying pH-dependent complex formation. Fitting the spectrophotometric and potentiometric experimental data simultaneously, the formation of seven complexes was revealed. In addition to the four mononuclear species (NdGluc2+, NdGluc2+, NdGluc30 and NdGlucH−20), two binuclear species (Nd2Gluc3H−2+ and Nd2Gluc4H−20) are also likely to be formed. Their formation is facilitated by the higher concentrations of NdCl3. This phenomenon was not observed previously for Nd3+, but the formation of multinuclear complexes of Gluc− has been established for other metal ions.23,24,34In the pH range of 5.5–7.0 and at [Nd3+]T = 3 × 10⁻⁶–3 × 10⁻³ M and at [Gluc−]T = 0.01 M, the formation of these binuclear complexes can be neglected. This is of particular importance for modelling the chemical equilibria of radioactive waste repositories, as trivalent lanthanides are often considered to be structural analogues of trivalent actinides and Gluc− is also present in these systems as a cement additive.
Remarkable signal broadening occurs in the 1H NMR spectra in the presence of NdCl3. The most affected peaks are those of H2 and H3 implying the participation of the C2–OH and C3–OH groups (in addition to the carboxylate) in the coordination of Nd3+. The pH-dependence of the 1H NMR spectra showed further signal broadening above pH = 6 inferring stronger metal–ligand interactions due to the formation of deprotonated complexes. The proton displacement occurs probably on the C2–OH and/or C3–OH groups. Parallel 13C NMR measurements corroborated these findings.
Structure optimizations of the NdGlucH−20 complex showed that the carboxylate binds Nd3+ in a monodentate mode. The metal ion is also bound to the deprotonated alcoholic OH group of the C2 atom. In addition to these binding sites, the metal ion is attached to a coordinated water molecule. Deprotonation could also occur on the C3–OH group, but those structures are less preferred. In aqueous solutions a mixture of these isomers is likely to be present, but these species are not distinguishable by NMR.
With these results one may infer the possible formation of multinuclear gluconate complexes with other Ln(III) and An(III) ions, too.
Acknowledgements
This research was financed by the GINOP-2.3.2-15-2016-00013 and by the NKFIH K 124265 Grants. Computational resources were provided by the high performance computational facility MADECIP, POSCCE, COD SMIS 48801/1862 co-financed by the European Regional Development Fund of the European Union.Notes and references
- R. J. Silva, G. Bidoglio, M. H. Rand, P. B. Robouch, H. Wanner and I. Puigdomènech, Chemical Thermodynamics Series Vol. 2. Chemical Thermodynamics of Americium, Elsevier, North-Holland, Amsterdam, 1995 Search PubMed.
- R. J. Silva and H. Nitsche, Radiochim. Acta, 1995, 70–71, 377–396 Search PubMed.
- W. Runde, Los Alamos Sci., 2000, 26, 392–411 CAS.
- R. J. Lemire, J. Fuger, H. Nitsche, P. Potter, M. H. Rand, J. Rydberg, K. Spahiu, J. C. Sullivan, W. Ullman, P. Vitorge and H. Wanner, Chemical Thermodynamics Series Vol. 4. Chemical Thermodynamics of Neptunium and Plutonium, Elsevier, North-Holland, Amsterdam, 2001 Search PubMed.
- R. Guillaumont, Th. Fanghänel, J. Fuger, I. Grenthe, V. Neck, D. A. Palmer and M. H. Rand, Chemical Thermodynamics Series Vol. 5. Update on the Chemical Thermodynamics of Uranium, Neptunium, Plutonium, Americium and Technetium, Elsevier, North-Holland, Amsterdam, 2003 Search PubMed.
- G. R. Choppin, Radiochim. Acta, 2003, 91, 645–649 CrossRef CAS.
- V. Neck, M. Altmaier and Th. Fanghänel, C. R. Chim., 2007, 10, 959–977 CrossRef CAS.
- V. Neck, M. Altmaier, Th. Rabung, J. Lützenkirchen and Th. Fanghänel, Pure Appl. Chem., 2009, 81, 1555–1568 CrossRef CAS.
- K. Maher, J. R. Bargar and G. E. Brown Jr., Inorg. Chem., 2013, 52, 3510–3532 CrossRef CAS PubMed.
- M. Altmaier, X. Gaona and Th. Fanghänel, Chem. Rev., 2013, 113, 901–943 CrossRef CAS PubMed.
- Th. Fanghänel and V. Neck, Pure Appl. Chem., 2002, 74, 1895–1907 CrossRef.
- G. R. Choppin and E. N. Rizkalla, in Handbook on Physics and Chemistry of Rare Earths. Vol. 18: Lanthanides/Actinides: Chemistry, ed. K. A. Gschneidner Jr., L. Eyring, G. R. Choppin and G. H. Lander, Elsevier, North Holland, Amsterdam, 1994, ch. 128, pp. 559–590 Search PubMed.
- K. Bukietynska and A. Mondry, Inorg. Chim. Acta, 1985, 110, 1–5 CrossRef CAS.
- E. Brücher, R. Király and I. Tóth, Inorg. Nucl. Chem. Lett., 1976, 12, 167–171 CrossRef.
- C. Bube, V. Metz, E. Bohnert, K. Garbev, D. Schild and B. Kienzler, Phys. Chem. Earth, 2013, 64, 87–94 CrossRef.
- L. Rao, D. Rai and A. R. Felmy, Radiochim. Acta, 1996, 72, 151–155 CrossRef CAS.
- J. Kragten and L. G. Decnop-Weever, Talanta, 1984, 31, 731–733 CrossRef CAS PubMed.
- I. I. Diakonov, B. R. Tagirov and K. V. Ragnarsdottir, Radiochim. Acta, 1998, 81, 107–116 CrossRef CAS.
- S. Ramachandran, P. Fontanille, A. Pandey and C. Larroche, Food Technol. Biotechnol., 2006, 44, 185–195 CAS.
- X. Gaona, V. Montoya, E. Colàs, M. Grivé and L. Duro, J. Contam. Hydrol., 2008, 102, 217–227 CrossRef CAS PubMed.
- S. Giroux, P. Rubini, B. Henry and S. Aury, Polyhedron, 2000, 19, 1567–1574 CrossRef CAS.
- A. Lakatos, T. Kiss, R. Bertani, A. Venzo and V. B. Di Marco, Polyhedron, 2008, 27, 118–124 CrossRef CAS.
- T. Gajda, B. Gyurcsik, T. Jakusch, K. Burger, B. Henry and J.-J. Delpuech, Inorg. Chim. Acta, 1998, 275–276, 130–140 CrossRef CAS.
- A. Pallagi, É. G. Bajnóczi, S. E. Canton, T. Bolin, G. Peintler, B. Kutus, Z. Kele, I. Pálinkó and P. Sipos, Environ. Sci. Technol., 2014, 48, 6604–6611 CrossRef CAS PubMed.
- N. A. Kostromina, Zh. Neorg. Khim., 1960, 5, 95–101 CAS.
- N. A. Kostromina, Ukr. Khim. Zh., 1960, 26, 299–304 CAS.
- N. A. Kostromina, Zh. Neorg. Khim., 1963, 8, 1900–1905 CAS.
- N. A. Kostromina, Zh. Neorg. Khim., 1966, 11, 381–385 CAS.
- C. Panda and R. K. Patnaik, J. Indian Chem. Soc., 1976, 53, 1079–1083 CAS.
- Z. Zhang, B. Bottenus, S. B. Clark, G. Tian, P. L. Zanonato and L. Rao, J. Alloys Compd., 2007, 444–445, 470–476 CrossRef CAS.
- A. Pallagi, P. Sebők, P. Forgó, T. Jakusch, I. Pálinkó and P. Sipos, Carbohydr. Res., 2010, 345, 1856–1864 CrossRef CAS PubMed.
- Z. Zhang, S. B. Clark, G. Tian, P. L. Zanonato and L. Rao, Radiochim. Acta, 2006, 94, 531–536 CAS.
- T. Taga, Y. Kuroda and M. Ohashi, Bull. Chem. Soc. Jpn., 1978, 51, 2278–2282 CrossRef CAS.
- S. Giroux, S. Aury, B. Henry and P. Rubini, Eur. J. Inorg. Chem., 2002, 1162–1168 CrossRef CAS.
- I. Szilágyi, E. Konigsberger and P. M. May, Dalton Trans., 2009, 7717–7724 RSC.
- S. J. Lyle and Md. M. Rahman, Talanta, 1963, 10, 1177–1182 CrossRef CAS.
- P. A. Levene and H. S. Simms, J. Biol. Chem., 1926, 68, 737–749 CAS.
- Z. Zhang, P. Gibson, S. B. Clark, G. Tian, P. L. Zanonato and L. Rao, J. Solution Chem., 2007, 36, 1187–1200 CrossRef CAS.
- L. Zékány, I. Nagypál and G. Peintler, PSEQUAD for Chemical Equilibria, Update 5–5.10, Hungary, 2000–2008 Search PubMed.
- F. Neese, Wiley Interdiscip. Rev.: Comput. Mol. Sci., 2012, 2, 73–78 CrossRef CAS.
- X. Cao, M. Dolg and H. Stoll, J. Chem. Phys., 2003, 118, 487–946 CrossRef CAS.
- A. Schäfer, H. Horn and R. Ahlrichs, J. Chem. Phys., 1992, 97, 2571–2577 CrossRef.
- A. Klamt and G. Schüürmann, J. Chem. Soc., Perkin Trans. 2, 1993, 799–805 RSC.
- S. Cotton, Lanthanides and Actinides, McMillan Education, London, 1991 Search PubMed.
- K. A. Burkov, L. S. Lilich, H. D. Ngo and A. Y. Smirnov, Zh. Neorg. Khim., 1973, 18, 1513–1518 CAS.
- E. Furia and R. Porto, J. Chem. Eng. Data, 2008, 53, 2739–2745 CrossRef CAS.
- D. F. Mullica, G. A. Wilson and C. K. C. Lok, Inorg. Chim. Acta, 1989, 156, 159–161 CrossRef CAS.
- Y. M. Song, X. Q. Yao, T. Deng and J. X. Wu, Chem. Pap., 2006, 60, 302–305 CAS.
- A. Habenschuss and F. H. Spedding, J. Chem. Phys., 1979, 70, 3758–3763 CrossRef CAS.
Footnote |
| † Electronic supplementary information (ESI) available: Additional NaOH-, HCl- and NdCl3-dependent visible spectra, conductometric titrations and their discussion, speciation diagram related to the NMR measurements, NdCl3-dependent 1H and 13C spectra, pH-dependent 13C spectra and alternative optimized structures (with brief discussion) for the NdGlucH−20 complex. See DOI: 10.1039/c7dt00909g |
| This journal is © The Royal Society of Chemistry 2017 |

