 Open Access Article
Creative Commons Attribution 3.0 Unported Licence
Redox trends in cyclometalated palladium(II) complexes†
Yulia B.
Dudkina
a,
Kirill V.
Kholin
a,
Tatyana V.
Gryaznova
a,
Daut R.
Islamov
ab,
Olga N.
Kataeva
ab,
Ildar Kh.
Rizvanov
a,
Alina I.
Levitskaya
a,
Olga D.
Fominykh
a,
Marina Yu.
Balakina
a,
Oleg G.
Sinyashin
a and
Yulia H.
Budnikova
*ab
aA.E. Arbuzov Institute of Organic and Physical Chemistry, Kazan Scientific Center, Russian Academy of Sciences, 8 Arbuzov str., Kazan 420088, Russian Federation. E-mail: yulia@iopc.ru
bKazan (Volga Region) Federal University, A.M. Butlerov Chemical Institute, 18 Kremlevskaya str., Kazan, 420008, Russian Federation
First published on 18th November 2016
Abstract
A series of diverse binuclear and mononuclear cyclometalated palladium(II) complexes of different structure was investigated by electrochemical techniques combined with density functional theory (DFT) calculations. The studies including cyclic and differential pulse voltammetry, X-ray structure analysis and quantum chemical calculations revealed a regularity of the complexes oxidation potential on the metal–metal distance in the complexes: the larger Pd–Pd distance, the higher oxidation potentials. The reduction potentials feature unusually high negative values while no correlation depending on the structure could be observed. These results are in a good agreement with the electron density distribution in the complexes. Additionally, ESR data obtained for the complexes upon oxidation is reported.
Introduction
Palladium compounds are known as the most attractive catalysts for many important organic transformations.1–7 As these reactions involve organometallic intermediates in different oxidation states (which are generally redox active), the catalytic cycles can be elucidated by electrochemical methods. To date this strategy was successfully used to study Pd(II)/Pd(0) cross-couplings.3 Contrariwise, electrochemical data for Pd(II)/Pd(III) and Pd(II)/Pd(IV) redox couples and for reactions based on these shuttles is extremely poor.Cyclometalated palladium(II), (III), (IV) complexes are proposed to be key intermediates in oxidative ligand-directed aromatic C–H functionalizations.4,5 Although this approach is adapted to introduce diverse functional groups into aromatic substrates in C(sp2)–H halogenation, acetoxylation, arylation and some other reactions,6,7 examples of effective formation of carbon–phosphorus and carbon–fluoroalkyl bonds are still rare8–10 although compounds with these structure units are important and relevant as pharmaceuticals.11–14
Electrochemical properties of cyclopalladated complexes are described only in few works15–19 and no generalization has been made for them, whereas, the redox properties are expected to specify reactivity of the complexes in C–H functionalization processes. The most explicit information can be provided by electrochemical techniques amplifying with DFT calculations which were found very advantageous in mechanistic studies of palladacycles transformations during C–H functionalizations.20–24 In the recent work,19 the joint use of spectroscopic (including cyclic voltammetry (CV)) methods and quantum chemical calculations revealed features of electron density distribution within mono- and binuclear palladacycles with 2-phenylpyridine ligand where palladium oxidation states were (II), (III) and (IV). Recently, Musaev and co-workers explored the factors impacting the stability and reactivity of dimeric Pd(II) complexes in C–H functionalization catalysis.25 In this theoretical study, it was assumed that binuclear complexes require a higher C–H activation barrier than mononuclear ones, but no experimental factors and data were analyzed.
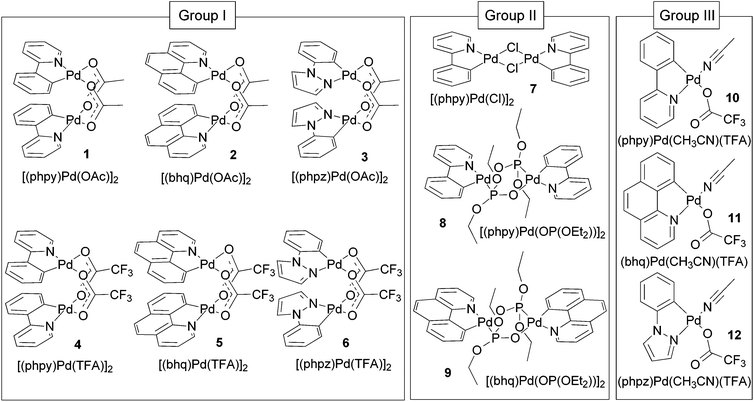
The purpose of this paper is to reveal structure-electrochemical properties correlation for cyclometalated palladium(II) complexes. We performed analysis of electrochemical properties in a series of binuclear and mononuclear palladacycles with diverse bridging groups (acetate, trifluoroacetate, chloride, phosphonate) and C^N ligands (2-phenylpyridine (phpy), benzo[h]quinolone (bhq) and 1-phenylpyrazole (phpz)) presented in Fig. 1. The complexes were investigated by voltammetry techniques and DFT calculations aiming to find out regularities of their oxidation and reduction, stability and electron density distribution in different oxidation states Pd(II)/Pd(III)/Pd(IV), influence of ligand, bridging group and solvent nature on the redox properties. Because the oxidized forms of the complexes might be ESR-active Pd(III) species, all compounds were also examined in ESR experiments.
Results and discussion
In this work a wide scope of palladacycles are investigated, among which complexes 5, 6, 11, 12 have not been described earlier. Depending on the structure type, nuclearity and (for binuclear compounds) position of the cyclometalated fragments relative to each other the complexes were divided into three groups which are expected to show different redox behavior. The groups are: binuclear complexes of clamshell (I group) and unfolded (group II) geometries, mononuclear complexes (group III) (Fig. 1).Synthesis and X-ray crystal structure study
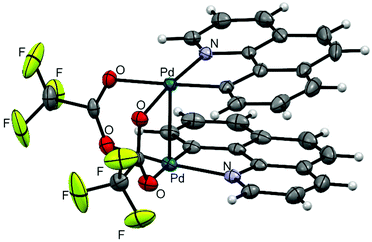
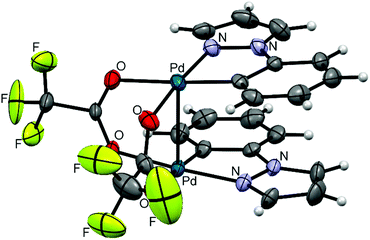
Clamshell carboxylate bimetallic palladacycles 1–6 were obtained by literature procedures from palladium acetate or trifluoroacetate precursors and corresponding C^N ligands (Fig. 2a and b).15,18,26,27 Structure and reactivity are well-studied for acetate derivatives 1–3 and trifluoroacetate 4.18,27–29 The single-crystal X-ray structures of the new binuclear trifluoroacetates 5, 6 shown in Fig. 3 and 4 confirm their clamshell geometry similar to that of 1–4, where two cyclopalladated motifs are located one over another. The Pd–Pd distance (ranging 2.842–2.892 Å) is less than the sum of their van der Waals radii (3.26 Å); in trifluoroacetates 4–6 it is slightly larger compared to the acetates 1–3 (∼0.03 Å) due to electron-withdrawing effect of the CF3-group. The interfacial angle between two cyclometalated units is almost the same in 1–6 and ranges between 15.2–18.5°. The Group I palladacycles feature metal–metal interactions and bond order of 0.10–0.15 between two palladium atoms.27,30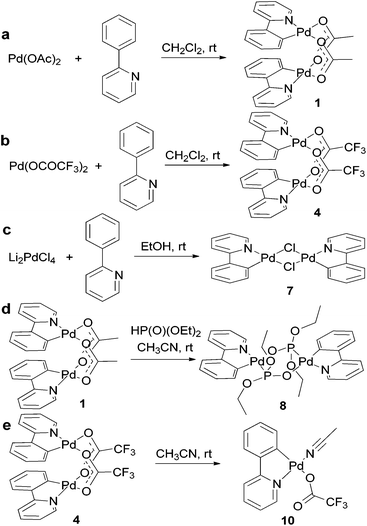 | ||
| Fig. 2 Syntheses of palladacycles with different bridging groups illustrated by complexes with 2-phenylpyridine ligand. | ||
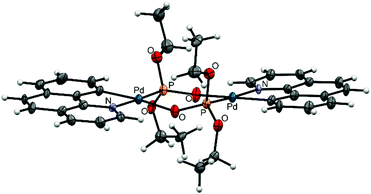
Complexes 7, 8, and 9 belong to the Group II as unfolded palladacycles where no direct metal–metal interactions can be observed but the palladium atoms can influence one another in redox processes. Palladacycle 7 was synthesized from Li2[PdCl4] treated with phpy ligand27 (Fig. 2c); our structural and electrochemical data for 7 agree with the previously reported.27 Interestingly, the complex reveals almost flat geometry with 1.2° interfacial angle and 3.494 Å Pd–Pd distance. Treatment of acetates 1, 2 with diethyl-H-phosphonate in CH3CN affords 8 and 9, respectively (Fig. 2d). Recrystallization of both complexes from CH3CN or CH2Cl2 solutions produces the same dimeric structures. The synthetic procedure, detailed electrochemical study of 8 and 9 (in solid state and in CH3CN solution) and the X-ray structure of 8 have been already discussed earlier in our works.31,32 The X-ray structure of complex 9 is depicted in Fig. 5. The Pd–Pd distances in 8 and 9 are 4.332 and 4.328 Å, the interfacial angles are 9.1 and 6.3°, respectively.
Recently, we demonstrated that trifluoroacetate dimer 4 forms mononuclear 10 being dissolved in/recrystallized from acetonitrile (Fig. 2e); and the redox properties of the mono- and binuclear forms differ significantly.18 Likewise, trifluoroacetates 5, 6 turn into mononuclear 11 and 12 in CH3CN solutions, although no crystals suitable for X-ray analysis could be obtained. Interestingly, the solubility of phpy and phpz derivatives 4 and 6 in CH3CN is very high (∼0.2 M) while complex 5 with bhq ligand is significantly less soluble (∼0.05 M). Complexes 10–12 constitute the Group III palladacycles with one metal atom per complex molecule.
Electrochemical study
Electrochemical properties of palladacycles 1–12 were investigated in CH3CN and CH2Cl2 solvents due to their broad potential range capable with oxidative and reductive measurements and the ability to examine the reversible transformation of binuclear and mononuclear forms of the trifluoroacetate complexes and its effect on the redox potentials. It should be mentioned, complex 7 does not undergo monomerization in CH3CN.33 Acetate- and phosphonate-bridged complexes also remain the dimeric structure in both solvents that is proved by the similarity of cyclic voltammograms in CH3CN and CH2Cl2 solutions and in solid state (carbon paste electrode) (ref. 32 and herein).Cyclic voltammetry studies are known for 1 and 4 in CH2Cl2 and CH3CN,17 for 2 in THF15,16 and for 7 in CH3CN.17 Earlier we already reported electrochemical properties of 1, 4, 10 (in CH2Cl2 and CH3CN)18 and 8, 9 (solid state, CH3CN).31,32 Notably only oxidation processes are of interest in these works. Therefore, the goal of this work is to obtain and analyze redox behavior of a wide scope of palladacycles both in oxidative and reductive conditions.
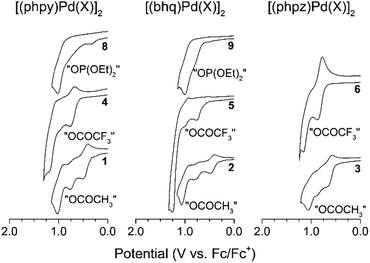
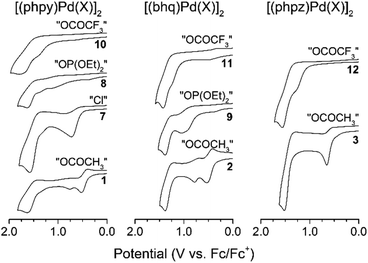
For all palladacycles 1–12 oxidation occurs in multiple steps as illustrated in Fig. 6 and 7. The curves are very similar (number of oxidation steps, reversibility) for the compounds with the same bridging groups in the same solvent. The first oxidation step is a one-electron process for monomeric complexes and a two-electron one for all dimeric palladacycles.18,19 For 9 the first oxidation peak consists of two overlooped peaks at close potentials. Free ligands oxidize at significantly higher potentials (V vs. Fc+/Fc): 1.70 (phpy), 1.73 (bhq), 1.80 (phpz).
Reversibility of the first oxidations pertains to the carboxylic complexes (I group), while other complexes show fully irreversible oxidation in CV experiments with scan rate from 50 mV s−1 to 10 V s−1. This possibly refers to fast following reductive elimination reactions which afford C–H phosphorylation and perfluoroacetoxylation products as it was conformed previously18,31,32 in a series of bulk electrolysis reactions. Owing the oxidations irreversibility, differential pulse voltammetry (DPV) was used to elucidate the standard potentials (E0, E1/2, EDPV). Data obtained in CV and DPV experiments is summarized in Tables 1 and 2 and is in a good agreement with known literature reports.15–19 Although, the first oxidation step consumes two electrons per binuclear palladacycle molecule, the two electron transfers cannot be resolved in neither cyclic or differential pulse voltammograms, that means, the standard electron potential of the two consequent oxidations are very close to each other.
| Complex | E ox, V | E red, V | |||||
|---|---|---|---|---|---|---|---|
| E pa | E pc | ΔEp | E DPV | i c/ia | E pc | E DPV | |
| 1 | 0.52 | 0.40 | 0.12 | 0.44 | 0.3 | −2.19 | −2.12 |
| 2 | 0.53 | 0.40 | 0.13 | 0.44 | 0.4 | −2.09 | −2.03 |
| 3 | 0.65 | 0.49 | 0.16 | 0.58 | 0.3 | −2.54 | −2.37 |
| 7 | 0.73 | — | — | 0.63 | — | −1.91 | −1.85 |
| 8 | 1.12 | — | — | 1.00 | — | −2.40 | −2.35 |
| 9 | 0.92 | — | — | 0.82 | — | −2.26 | −2.19 |
| 10 | 1.40 | — | — | 1.32 | — | −1.77 | −1.69 |
| 11 | 1.26 | — | — | 1.19 | — | −1.69 | −1.61 |
| 12 | 1.28 | — | — | 1.20 | — | −1.90 | −1.71 |
| Complexa | E ox, V | E red, V | |||||
|---|---|---|---|---|---|---|---|
| E pa | E pc | ΔEp | E DPV | i c/ia | E pc | E DPV | |
| a Data for complex 7 is unavailable due to its extremely low solubility in CH2Cl2. | |||||||
| 1 | 0.51 | 0.39 | 0.12 | 0.42 | 0.7 | −2.33 | −2.26 |
| 2 | 0.49 | 0.38 | 0.11 | 0.40 | 0.8 | −2.20 | −2.14 |
| 3 | 0.68 | 0.56 | 0.13 | 0.58 | 0.3 | −2.60 | −2.47 |
| 4 | 0.77 | 0.66 | 0.11 | 0.68 | 0.2 | −2.08 | −1.92 |
| 5 | 0.76 | — | — | 0.69 | — | −1.95 | −1.84 |
| 6 | 0.83 | 0.73 | 0.10 | 0.75 | 0.5 | −2.02 | −1.81 |
| 8 | 0.78 | — | — | 0.73 | — | −2.51 | −2.43 |
| 9 | 0.80 | — | — | 0.74 | — | — | −2.29 |
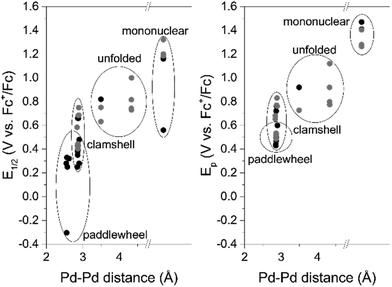
As can be seen, in CH2Cl2 the first oxidation potential increase in the sequence: acetates (Group I), trifluoroacetates (Group I) and phosphonates (Group II). In CH3CN the sequence is different: acetates (Group I) (earliest to oxidize), chlorides (Group II), phosphonates (Group II), trifluoroacetates (Group III) (hardest to oxidize). The oxidation sequence is strongly affected by the palladacycles geometry, particularly the distance between the palladium atoms. The Pd–Pd distance increases in the complexes in passing from clamshell geometry 1–6 to unfolded 7–9 and mononuclear 10–12 structures; consequently, the oxidation potential increases either. The most striking instance is the potential difference ΔEpa between acetates and trifluoroacetates palladacycles in both solvents: in CH2Cl2 ΔEpa = 0.15–0.27 V (due to trifluoroacetate electron-withdrawing effect); in CH3CN ΔEpa = 0.63–0.88 V (due to additivity of the structure change and trifluoroacetate electron-withdrawing effect).
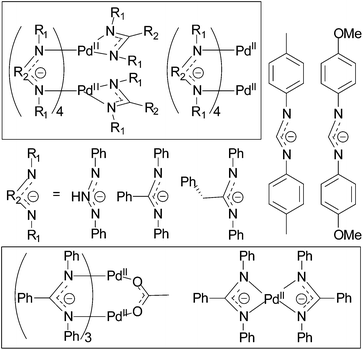
To show the revealed trend is a general principle we broaden the scope of palladium complexes with closely related to the palladacycles of Group I Pd2-systems with N^C^N bridging ligands34–39 (Fig. 8). These complexes feature metal–metal interaction and exist as two structure isomers: paddlewheel (four bridging ligands) and clamshell (two bridging and two chelating ligands). The former is characterized with shorter Pd–Pd distances and, therefore lower oxidation potential values. Owing the dissimilarity of the literature data (the complexes are characterized either by oxidation peak potential Ep (CV) or half-wave potential E1/2 (DPV)), both parameters were used to illustrate the trend in Fig. 9.
The electrochemical reduction of cyclopalladated complexes is firstly considered in this work. All of them werefound to reduce at unusually high negative potentials (from −1.7 to −2.6 V) (Tables 1 and 2; ESI Fig. S1–S4†). No regularities could be observed in these processes depending on the Pd–Pd distances or any other parameters (ESI, Fig. S7†), except an apparent relative ease of reduction of trifluoroacetate dimers compared to the acetate complexes (ΔE = 0.3–0.6 V) that occurs due to trifluoroacetate electron-withdrawing effect.
The revealed regularity in oxidation chemistry of cyclopalladated complexes might be useful to determine conditions in ligand-directed C–H functionalization reactions. For example, as phosphonate-bridged palladacycles are oxidized significantly more difficult than acetate-bridged ones (Tables 1 and 2), the reactivity of both complexes (key intermediates) should be considered in C–H phosphorylation reaction; for example, phosphorylation of 2-phenylpyridine with H-phophonates catalyzed by palladium acetate (Fig. 10).8,9,31 Selective C–H phosphonation requires the correct choice of an oxidant (or electrolysis potential) to promote oxidation of complex 8. In the case of “weak” oxidant (low electrolysis potential) oxidation of 1 is the dominant process resulting in formation of acetoxylated phenylpyridine byproduct. The problem to find an appropriate chemical oxidant likely explains the low yields and very few C–H phosphonation reactions in the literature.
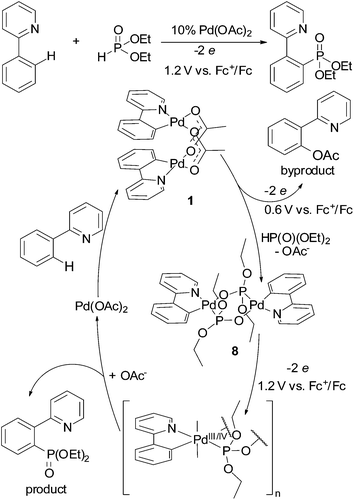 | ||
| Fig. 10 Catalytic cycle of 2-phenylpyridine phosphorylation illustrating importance of electrolysis potential. | ||
ESR study
Aiming to get more information about possible high-valent intermediates formed upon oxidation of cyclometalated palladium(II) complexes, a set of ESR experiments with different substrate concentrations, solvents (CH2Cl2/CH3CN) and varying temperatures was carried out. The palladacycles were tested to give an ESR signal being oxidized in a potentiostatic mode (at the first oxidation peak potential) at platinum working electrode at 275 K; as the signal reached the maximum value during the electrolysis the temperature-dependent measurements were performed. ESR signals were obtained only for Group I complexes in CH2Cl2 (Fig. 11; ESI Fig. S10–S21†) that corresponds with their reversible oxidations in voltammograms. The fact that no ESR signals were registered for the complexes of Group II and III is likely explained by higher rates of reductive elimination reaction of high-valent palladacycles forming products of C–H substitution. Instability of high-valent cyclopalladated intermediates formed from these complexes is also confirmed by irreversibility of their oxidations (Fig. 5, 6 and Tables 1, 2).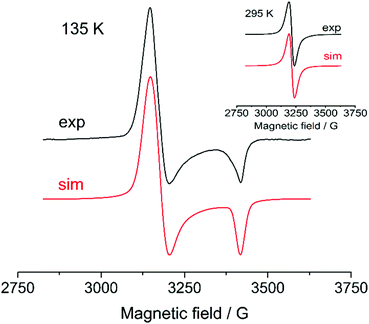 | ||
| Fig. 11 ESR spectra obtained upon oxidation of 0.1 M 1 in CH2Cl2 at 135 K and 295 K (inset). The simulation parameters are provided in Table 3. | ||
At room temperature and concentration 0.005 M complexes 1–6 give similar isotropic metal-centered ESR signal. Although the ESR line is single its simulation is a sum of an unresolved hyperfine structure from 105Pd (22.3% abundance) and a singlet from zero nuclear spin Pd atoms (ESI Fig. S8†). At that, anisotropy of HFI linewidth should be regarded that leads to poor precision in estimating of linewidth and HFI constants. Solutions of trifluoroacetates 4–6 show slightly larger g-factors and lower constants of hyperfine interaction with palladium nuclears compared to acetates 1–3 (Table 3). The increase of the g-factor values occurs due to decrease in covalence of metal–ligand bonding and corresponds to electron-withdrawing trifluoroacetate group.
| Complex | Magnetic resonance parameters | ||
|---|---|---|---|
| a Low-temperature ESR of 0.1 M solutions are simulated as a sum of two spectra (sim1 and sim2). b g ├ (sim1) cannot be determined in the low-temperature spectrum. c Low-temperature spectrum was recorded at 155 K. | |||
| 1 | 0.005 M, 295 K | 0.1 M, 295 K | 0.1 M, 135 K |
| g iso = 2.148 | g iso = 2.148 | g ├ = 2.19, ΔH = 70 | |
| ΔH = 30 | ΔH = 29 | g ‖ = 2.02, ΔH = 28 | |
| a 105Pd = 15, ΔH = 27 | a 105Pd = 15, ΔH = 24 | ||
| 2 | g iso = 2.147, ΔH = 28 | g iso = 2.147, ΔH = 37 | g 1 = 2.20, ΔH = 40 |
| a 105Pd = 13, ΔH = 24 | a 105Pd = 13, ΔH = 32 | g 2 = 2.18, ΔH = 40 | |
| g 3 = 2.02, ΔH = 25 | |||
| 3 | g iso = 2.152, ΔH = 30 | g iso = 2.152, ΔH = 36 | g 1 = 2.20, ΔH = 50 |
| a 105Pd = 12, ΔH = 27 | a 105Pd = 12, ΔH = 31 | g 2 = 2.18, ΔH = 60 | |
| g 3 = 2.02, ΔH = 25 | |||
| 4 , | g iso = 2.153, ΔH = 34 | g ├ = 2.16, ΔH = 45 | sim1: g‖ = 2.03, ΔH = 30 |
| a 105Pd = 12, ΔH = 30 | g ‖ = 2.13, ΔH = 100 | sim2: g├ = 2.17, ΔH = 110 | |
| g ‖ = 2.06, ΔH = 150 | |||
| 5 , | g iso = 2.150, ΔH = 31 | g ├ = 2.16, ΔH = 45 | sim1: g├ = 2.20, ΔH = 70 |
| a 105Pd = 12, ΔH = 26 | g ‖ = 2.13, ΔH = 100 | g ‖ = 2.03, ΔH = 40 | |
| sim2: g1 = 2.17, ΔH = 50 | |||
| g 2 = 2.13, ΔH = 60 | |||
| g 3 = 2.09, ΔH = 60 | |||
| 6 | g = 2.159, ΔH = 36 | g ├ = 2.17, ΔH = 50 | sim1: g1 = 2.21, ΔH = 40 |
| a 105Pd = 10, ΔH = 31 | g ‖ = 2.15, ΔH = 60 | g 2 = 2.19, ΔH = 50 | |
| g 3 = 2.03, ΔH = 35 | |||
| sim2: g = 2.14, ΔH = 40 | |||
Decreasing the temperature, integral intensity of the critically diminishes down to the noise level. Only for 1 and 2 we were able to observe ESR signals of the frozen solutions at 0.005 M concentration. To obtain low-temperature spectra which intensity is enough for reliable simulations the concentration was significantly increased up to 0.1 M (Fig. 11). The resulted frozen solution spectra show axial symmetry of the metal center; the magnetic resonance constants are given in Table 3. Unexpectedly, the high-concentrated solutions exhibit parallel and perpendicular components in ESR spectra even at 295 K and lowering the temperature affects in increasing the anisotropy (ESI, Fig. S9† illustrates the feature by comparing normalized ESR spectra of 4 with concentrations 0.005 and 0.1 M at 295 K).
Anisotropic ESR spectra at temperatures more than 100 K higher the freezing point is uncommon. Considering the spectral characteristics of paramagnetic species, it is assumed the system is either in solid or liquid state. g-Factors and HFI constants of solid state ESR spectra usually depend strongly on the orientation. Anisotropic interactions in low-viscosity solutions are averaged to zero. However, there can be a system state with intermediate viscosity values known as slow axial rotation. The observed phenomenon indicates the ESR-active molecules rotation is “slow” and the increase of rotational diffusion correlation time refers to formation of “large” molecules.
These “large” molecules might be certainly high-valent polynuclear palladium complexes described in recent works16,40 since the conditions of voltammetry and ESR experiments, particularly non-coordinating solvent (CH2Cl2) and supporting electrolyte (Bu4NBF4), are similar to those promoting high-valent palladium wires formation (Scheme 1). Although the reports include ESR spectra, no magnetic resonance parameters are described there.16 Based upon the signals shape the polynuclear complexes are characterized by the same ESR parameters as mono- and binuclear palladacycles.41 According the quantum calculations, the bond between two binuclear palladacycled(III) units forms through hybridization of HOMO and 5p orbital with no unpaired electrons. While authors give ESR spectra of formally polymetallic Pd(III) structures, they mention the EPR spectra of Pd(2.5) and Pd(III) wires are very similar at 77 K and propose a rapid electronic equilibrium between Pd(2.5), Pd(III), and Pd(II) species. Thus, the registered spectra belong to Pd(2.5) wires as polynuclear Pd(III) and Pd(II) complexes are not detectable in ESR. Therefore, polynuclear Pd(2.5) wires are the species giving the spectra we observe.
Furthermore, if the cooling time in our experiments is significantly reduced from gradual cooling during several hours to a sharp freezing in a few seconds, the spectral intensity of frozen solution ESR remains at the same low level. This fact except any influence of chemical processes like possible comproportionation or other reactions and chemical equilibriums. It means the decrease in amount of the paramagnetic centers (the decrease in intensity) with reducing the temperature is supposed to stem from redistribution of paramagnetic centers within polynuclear chains containing both Pd(II) and Pd(III) atoms. At higher temperatures there are many Pd(II)–Pd(III) units in a chain giving an intensive ESR signal, while at lower temperature –Pd(II)n– and –Pd(III)n– clusters are formed within the chain and only –Pd(II)–Pd(III)– “joints” produce the signal. The larger clusters, the fewer joints and the lesser intensity. Such phenomena are known in the literature.42,43
DFT study
Study of the palladium(II) complexes by quantum chemistry methods provides more detailed understanding of their redox properties; calculations allow to estimate the frontier orbitals energy which is directly linked to the standard reduction and oxidation potentials.44–50 The obtained wave function was used to study the electronic charge density distribution in the molecule space.Calculations of energy characteristics for the complexes were carried out by the DFT method at B3LYP/TZP-DKH. The applied computational approach allows to adequately solve the problem (with sufficient precision); TZ level basis set provides high accuracy of calculation, in particular, for the ionization potentials the mean absolute deviation (MAD) from the results of precise calculations at DKH-CASSCF/CASPT2 level (the multi-configuration wave function, taking into account the dynamic correlation by the second-order perturbation theory) with very large relativistic bases of natural orbitals ANO does not exceed 0.275 eV for the fourth series elements.51 The use of TZP-DKH basis significantly reduces the error, conditioned by the basis set incompleteness compared to the corresponding double-exponential basis DZP-DKH52 for which this deviation is 0.876 eV (ref. 51). For the first series elements comprising the complexes MAD does not exceed 0.112 eV.53 Calculations were performed using the geometry obtained from X-ray diffraction data for complexes 1–10 representing the three structural types. Account of solvent can play a significant role in determining the redox potentials, so the calculation of characteristics of the complexes under study was performed in two solvents – CH3CN and CH2Cl2; the account of the solvent effect was carried out in the framework of polarizable continuum model PCM.54
Early research carried out on organic compounds showed a correlation between the standard reduction and oxidation potentials, and the LUMO and HOMO energies.44–50,55–58 It was assumed the molecular orbital energies could be calculated directly from cyclic voltammetry results calibrated with ferrocene with a value of 4.8 eV:44
| EHOMO = −(E[1/2,ox vs. Fc+/Fc] + 4.8) (eV), |
| ELUMO = −(E[1/2,red vs. Fc+/Fc] + 4.8) (eV), |
Irreversibility of redox processes does not allow to use these formulae directly for the studied palladium complexes, so the standard oxidation and reduction potentials values obtained by the DPV method were plugged into the formulae to calculate the frontier orbitals energy:
| EHOMO = −(E[DPV,ox vs. Fc+/Fc] + 4.8) (eV), |
| ELUMO = −(E[DPV,red vs. Fc+/Fc] + 4.8) (eV). |
The calculated and experimental HOMO and LUMO energy values are presented in Table 4. The theoretical values of the HOMO energies correlate well with those estimated in voltammetry experiment.
| Type | Complex | E HOMO, eV (DPV exp.) | E LUMO, eV (DPV exp.) | ΔE(HOMO–LUMO), eV (DPV exp.) | E HOMO, eV (DFT cal.) | E LUMO, eV (DFT cal.) | ΔE(HOMO–LUMO), eV (DFT cal.) |
|---|---|---|---|---|---|---|---|
| Acetonitrile | |||||||
| I | 1 | −5.24 | −2.68 | −2.56 | −5.34 | −2.07 | −3.27 |
| 2 | −5.24 | −2.77 | −2.47 | −5.39 | −2.17 | −3.22 | |
| 3 | −5.38 | −2.43 | −2.95 | −5.39 | −1.52 | −3.87 | |
| II | 7 | −5.43 | −2.95 | −2.48 | −6.22 | −2.08 | −4.14 |
| 8 | −5.80 | −2.45 | −3.35 | −6.08 | −1.77 | −4.31 | |
| 9 | −5.62 | −2.61 | −3.00 | −5.93 | −2.01 | −3.92 | |
| III | 10 | −6.12 | −3.11 | −3.01 | −6.34 | −2.13 | −4.21 |
| 11 | −5.99 | −3.19 | −2.79 | — | — | — | |
| 12 | −6.00 | −3.09 | −3.91 | — | — | — | |
| Dichloromethane | |||||||
| I | 1 | −5.22 | −2.54 | −2.68 | −5.29 | −2.06 | −3.23 |
| 2 | −5.20 | −2.66 | −2.54 | −5.31 | −2.14 | −3.17 | |
| 3 | −5.38 | −2.33 | −3.05 | −5.34 | −1.52 | −3.82 | |
| 4 | −5.48 | −2.88 | −2.61 | −5.63 | −2.32 | −3.31 | |
| 5 | −5.49 | −2.97 | −2.52 | −5.66 | −2.25 | −3.41 | |
| 6 | −5.55 | −2.99 | −2.56 | −5.73 | −1.61 | −4.12 | |
| II | 8 | −5.53 | −2.37 | −3.16 | −6.03 | −1.75 | −4.28 |
| 9 | −5.54 | −2.51 | −3.04 | −5.86 | −1.97 | −3.89 | |
Analysis of calculation results presented in Table 4 shows several tendencies. The HOMO energy values for the Group I complexes are slightly higher than for the Group II complexes. The ΔE(HOMO–LUMO) values tend to increase in series of complexes 1–9; the marked trend being more pronounced in the case of complexes in acetonitrile. The energy difference ΔE for the Group I complexes comprises from 3.17 to 3.45 eV, while for 3 this value is slightly larger. When changing acetonitrile to dichloromethane the ΔE value decreases slightly (by ∼0.05 eV for 1 and 2; by ∼0.32 eV for 3). ΔE values for complexes of the IInd group is considerably greater than for the complexes of the Ist group. The ΔE value for monomer 10, which represents the Group III, is comparable with the value for the II type complexes; the difference amounts 0.01 eV.
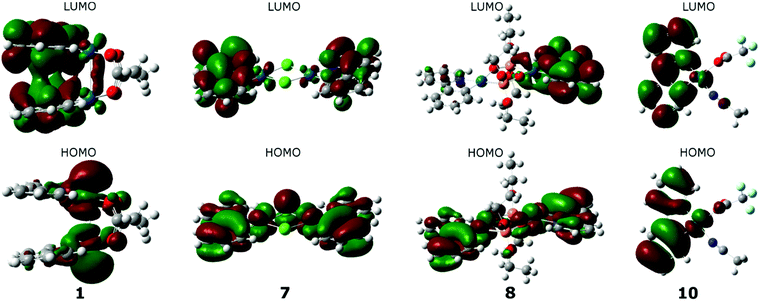
Isodensity plots of the frontier orbitals were built on the basis of the calculated wave functions for complexes 1–10. It was found that for each group of palladium complexes similar electron density distribution on the HOMO orbitals is typical. Whereas the LUMOs for all the complexes are localized mainly on the aromatic ligand, which explains the high values of the reduction potentials of palladacycles. As can be seen in Fig. 12 by example of complex 3, for the I Group complexes the HOMO maximum density is focused on palladium atoms and captures their neighboring ligand atoms, as for the LUMO, on the contrary, the density is shifted to heterocycles, and there is some coupling between them. Regarding the acetate “tails”, they are not involved in binding at all. Analysis of the form of the frontier orbitals of complex 2 suggests there is no overlap of electron clouds in heterocyclic ligands in the case of LUMO, where the conjugated system of ligands is more extended, despite the fact that the distance between the palladium atoms corresponds to estimations made for the other complexes of the Group I.
A characteristic feature of the complexes of the IInd group is the distribution of HOMO electronic density over the entire plane of both cyclopalladated fragments, HOMO captures both the palladium atoms and heterocyclic ligands (it is illustrated by complex 7 in Fig. 12). In the case of LUMO the electron density is shifted predominantly to the periphery of the complex, i.e. to the heterocyclic ligands, some asymmetry in electronic distribution being observed at that. In the case of phosphonate complexes (Fig. 10, complex 8) there is complete asymmetry in the distribution of electron density in LUMO, that is density on one ligand is much higher than on the other. Thus, for the Group II complexes each component of dimeric complex behaves independently, so that the total electron density of the complex is an additive one. As for the complex 10, belonging to the Group III, LUMO electron density is shifted towards the periphery of the heterocycle, while trifluoroacetate and acetonitrile ligands being very weakly involved (Fig. 12).
Thuswise, a correlation between the energy gap value ΔE, the value of oxidation potential and the complex geometry is observed. When passing from the I Group systems (clamshell type) to the II and III Groups (dimers with unfolded structure and mononuclear complexes, respectively) the electron density is shifted from palladium atoms to the aromatic ligand, which is reflected in the shift of the complex oxidation potential toward more positive potentials.
The assumption of the binding between the ligands heterocycles arising due to non-covalent interactions, is supported by the results of the topological analysis of the peculiarities of distribution of electron charge density in the framework of Atoms in Molecules topological analysis QTAIM60 (ESI, Fig. S22 and S23†): in the molecular region between the heterocyclic ligands a set of critical points was detected, the values of the electron density and the Laplacian of the charge density in which falling into the range of values typical for the non-covalent binding.61,62 Analysis of topological characteristics, obtained by QTAIM method for 3 and 4 in both solvents, has demonstrated that the electron density and Laplacian of charge density values at the critical points of binding between the ligands are insignificantly larger in case of complex 3 compared to those for complex 4, since the distance between the cycles planes in complex 3 is a little bit smaller than that in complex 4. It is interesting to note that in the case of complex 4 ellipticities of critical points are considerably greater than those for 3 independently on the solvent, this fact together with the proximity of the critical points of (3, −1) type and the points in the rings of (3, +1) type indicates tendency to breaking the ligands binding, which apparently can lead to complex monomerization.
Experimental
General considerations
Reactions were carried out under ambient atmosphere. All solvents employed were purified and dried according to standard methods prior to use. All chemicals were purchased from commercial suppliers and used as received. NMR experiments were carried out with Bruker spectrometers AVANCE-400 and AVANCE-500. Chemical shifts are reported in the δ (ppm) scale relative to the residual solvent signals for 1H and 13C, to external C6F6 (−164.9 ppm) for 19F NMR spectra. Multiplicities are reported as follows: singlet (s), doublet (d), triplet (t), quartet (q), quintet (quin), sextet (sext), multiplet (m), broad resonance (br); coupling constants in Hz; integration. Mass spectra MALDI were recorded on a UltraFlex III TOF/TOF spectrometer (Bruker Daltonik GmbH, Germany) in a linear negative mode with a solution of molecular sulfur in toluene as a matrix using a metallic target. Laser Nd:YAG, λ = 266 nm. FlexAnalysis 3.0 program (Bruker Daltonik GmbH, Germany) was used to process the data. Mass spectra ESI were recorded on a AmazonX spectrometer (Bruker Daltonik GmbH, Germany) in negative and positive mode with capillary voltage −4500 V. The drying gas was nitrogen of 250 °C and flow of 8 l min−1. Samples of 10−6 g ml−1 concentration in THF or CH3CN were used for analysis.Electrochemistry and ESR
Voltammograms were recorded with a BASi Epsilon potentiostat/galvanostat (USA) at room temperature dichloromethane or acetonitrile solutions under dry argon atmosphere. All measurements were carried out with 0.1 M Bu4NBF4 as the supporting electrolyte, platinum working electrode (0.02 cm2), platinum auxiliary electrode, and Ag/AgNO3 reference electrode. All potentials were referred against the ferrocenium/ferrocene redox couple.The ESR spectra were recorded in degassed dichloromethane or acetonitrile solutions (0.1 M Bu4NBF4) on an apparatus program complex63 including an ELEXSYS E500 ESR spectrometer of the X-range and a three-electrode (Pt) cell. The spectra were simulated using the WinSim 0.96 program (developed by NIEHS).
Computational details
Calculations of palladium complexes under study density functional method (DFT) was used. According to the literature data, the B3LYP hybrid functional allows one to obtain the value of the redox potential in good agreement with the experimental data.64–66 Regarding the choice of the basis set, two-exponential or three-exponential bases augmented by polarization and diffuse functions are sufficient for the description of the redox processes.67,68 As it is noted in the literature, the choice of basis sets for calculations of the fourth series elements is rather poor.51 It is known that for the fourth series elements the relativistic effects can play a significant role. Simplified (convenient) way of accounting for relativistic corrections is to use the relativistic effective core potentials or pseudopotentials (PP), the accuracy of their introduction depends on the method of constructing the core (or the number of electrons, which are regarded as the core ones). Correlation-consistent basis sets for the Y–Pd69,70 and In–Xe have been developed71,72 together with relativistic potentials of “small” cores, which explicitly take into account (consider) not only the outer valence shells (nspd), but also “external” core shells (n − 1)spd. It is believed that the pseudopotential method is a good approximation to the scalar relativistic calculations,73,74 which takes into account all of the electrons, but in special cases, such as the topological analysis of the electron density distribution in the molecular system, the use of all-electron basis sets is preferable.51 For such cases, one should use basic sets that allow to account the scalar relativistic corrections, thus leading to the change in the description of the relativistic contraction of core orbitals and the corresponding relativistic expansion of the valence orbitals.75 In this paper, for the calculation of palladium complexes TZP-DKH basis set51 was used, which is a contracted set [9s6p4d2f1g], derived from (20s15p9d2f1g) set of primitive Gaussian functions;76–79 the used contraction allows to take into account the scalar relativistic corrections with the Douglas–Kroll–Hess approach.77–79 The calculations were performed with GAUSSIAN 09 program package.80To study the characteristic features of charge density distribution in the complexes under study Quantum Theory of Atoms in molecules (QTAIM) topological analysis60 was performed. The topological properties of the molecular charge distribution are characterized by the number and type of charge density ρ(rc) critical points, where the gradient of charge density, ∇ρ(rc), vanishes. The critical points, classified according to their rank and signature, can be of four types: (3; −3), (3; −1), (3; +1), (3; +3), corresponding to the nuclei positions, the bonds between atoms (both covalent and non-covalent ones), cyclic or cage elements in the molecule, respectively. Rank of a critical point is equal to the number of Hessian eigenvalues; signature of a critical point is equal to the difference between the number of the Hessian positive and negative eigenvalues (λ1 < λ2 < λ3 is assumed), having the meaning of charge density curvatures in the directions of Hessian eigenvectors; two derived quantities are the Laplacian of the charge density at bond critical point,  , and the ellipticity ε = λ1/λ2 − 1. The ellipticity measures the deviation of the charge distribution along the bond path from axial symmetry. The topology of Laplacian of ρ(r) is more complicated than that of ρ(r) itself; it determines where the field is locally concentrated (Δρb(rc) < 0) or depleted (Δρb(rc) > 0). For closed-shell interactions, as found in ionic bonds, hydrogen bonds, and van der Waals molecules, Δρb(rc) should be positive and ρb(rc) low.60 The topological analysis was carried out using AIMALL program packages.81
Preparation of palladium complexes
Complexes 1–8 were synthesized utilizing the well-known procedures.15,18,25,27,31,32 Complexes 10–12 obtained by dissolving of the corresponding palladacycles 4–6 in acetonitrile. Complexes 11, 12 were investigated only in solutions.![[double bond, length as m-dash]](https://www.rsc.org/images/entities/char_e001.gif) O peak could not be resolved; isomer 2 δ = 141.50; 139.34; 132.04; 129.01; 125.18; 124.97; 124.83; 110.49; 106.51; CF3 and C
O peak could not be resolved; isomer 2 δ = 141.50; 139.34; 132.04; 129.01; 125.18; 124.97; 124.83; 110.49; 106.51; CF3 and C![[double bond, length as m-dash]](https://www.rsc.org/images/entities/char_e001.gif) O peaks could not be resolved. 19F NMR (470.6 MHz; CDCl3): isomer 1 (75%) δ = −72.65; isomer 2 (25%) δ = −72.17, −72.83. Calcd (%) for C22H14F6N4O4Pd2 C: 36.44, H: 1.95, N: 7.73. Found C: 36.40, H: 1.97, N: 7.69. ESI-MS: [M + CF3COOH]− 839; MALDI-MS: [M]− 725.
O peaks could not be resolved. 19F NMR (470.6 MHz; CDCl3): isomer 1 (75%) δ = −72.65; isomer 2 (25%) δ = −72.17, −72.83. Calcd (%) for C22H14F6N4O4Pd2 C: 36.44, H: 1.95, N: 7.73. Found C: 36.40, H: 1.97, N: 7.69. ESI-MS: [M + CF3COOH]− 839; MALDI-MS: [M]− 725.
![[double bond, length as m-dash]](https://www.rsc.org/images/entities/char_e001.gif) O peaks could not be resolved. 19F NMR (470.6 MHz; CD3CN): δ = −73.71. ESI-MS: [M − CF3COO]+ 325.
O peaks could not be resolved. 19F NMR (470.6 MHz; CD3CN): δ = −73.71. ESI-MS: [M − CF3COO]+ 325.
![[double bond, length as m-dash]](https://www.rsc.org/images/entities/char_e001.gif) O peaks could not be resolved. 19F NMR (470.6 MHz; CD3CN): δ = −75.14. ESI-MS: [M − CF3COO]+ 290.
O peaks could not be resolved. 19F NMR (470.6 MHz; CD3CN): δ = −75.14. ESI-MS: [M − CF3COO]+ 290.
X-ray structure determination
Data set for single crystals 5, 6 and 9 were collected on a Bruker AXS Kappa APEX Duo diffractometer with graphite-monochromated Mo Kα radiation (λ = 0.71073 Å). Programs used: data collection APEX2,82 data reduction SAINT,83 absorption correction SADABS version 2.10,84 structure solution SHELXS,85 structure refinement by full-matrix least-squares against F2 using SHELXL.85 Hydrogen atoms were placed into calculated positions and refined as riding atoms. The figures were generated using Mercury 3.1 program.86Three CF3 groups in structure 6 were disordered over two positions and were refined with an occupancy ratio of 0.83![[thin space (1/6-em)]](https://www.rsc.org/images/entities/char_2009.gif) :
:![[thin space (1/6-em)]](https://www.rsc.org/images/entities/char_2009.gif) 0.17, 0.83
0.17, 0.83![[thin space (1/6-em)]](https://www.rsc.org/images/entities/char_2009.gif) :
:![[thin space (1/6-em)]](https://www.rsc.org/images/entities/char_2009.gif) 0.17 and 0.88
0.17 and 0.88![[thin space (1/6-em)]](https://www.rsc.org/images/entities/char_2009.gif) :
:![[thin space (1/6-em)]](https://www.rsc.org/images/entities/char_2009.gif) 0.12.
0.12.
![[thin space (1/6-em)]](https://www.rsc.org/images/entities/char_2009.gif) 098; independent: 13
098; independent: 13![[thin space (1/6-em)]](https://www.rsc.org/images/entities/char_2009.gif) 392 (Rint = 0.0699) and 10
392 (Rint = 0.0699) and 10![[thin space (1/6-em)]](https://www.rsc.org/images/entities/char_2009.gif) 914 observed reflections [I > 2(I)], 793 refined parameters, R1 = 0.0275, wR2 = 0.0599 [I > 2σ(I)]; maximal residual electron density: 0.61/−0.88 e Å−3.
914 observed reflections [I > 2(I)], 793 refined parameters, R1 = 0.0275, wR2 = 0.0599 [I > 2σ(I)]; maximal residual electron density: 0.61/−0.88 e Å−3.
![[thin space (1/6-em)]](https://www.rsc.org/images/entities/char_2009.gif) 517; independent: 15
517; independent: 15![[thin space (1/6-em)]](https://www.rsc.org/images/entities/char_2009.gif) 176 (Rint = 0.0473) and 12
176 (Rint = 0.0473) and 12![[thin space (1/6-em)]](https://www.rsc.org/images/entities/char_2009.gif) 479 observed reflections [I > 2(I)], 1063 refined parameters, R1 = 0.0296, wR2 = 0.0678 [I > 2σ(I)]; maximal residual electron density: 1.01/−0.72 e Å−3.
479 observed reflections [I > 2(I)], 1063 refined parameters, R1 = 0.0296, wR2 = 0.0678 [I > 2σ(I)]; maximal residual electron density: 1.01/−0.72 e Å−3.
![[1 with combining macron]](https://www.rsc.org/images/entities/char_0031_0304.gif) , a = 10.197(1), b = 13.081(1), c = 13.311(2) Å, α = 107.243(3)°, β = 93.614(3)°, γ = 110.812(3)°, V = 1556.6(3) Å3, Z = 2, ρc = 1.799 g cm−3, μ = 1.309 mm−1, T = 100(2) K, θ range = 1.631° to 26.372°, reflections collected 39
, a = 10.197(1), b = 13.081(1), c = 13.311(2) Å, α = 107.243(3)°, β = 93.614(3)°, γ = 110.812(3)°, V = 1556.6(3) Å3, Z = 2, ρc = 1.799 g cm−3, μ = 1.309 mm−1, T = 100(2) K, θ range = 1.631° to 26.372°, reflections collected 39![[thin space (1/6-em)]](https://www.rsc.org/images/entities/char_2009.gif) 612; independent: 6365 (Rint = 0.0399) and 5463 observed reflections [I > 2(I)], 419 refined parameters, R1 = 0.0439, wR2 = 0.0963 [I > 2σ(I)]; maximal residual electron density: 1.87/−1.44 e Å−3.
612; independent: 6365 (Rint = 0.0399) and 5463 observed reflections [I > 2(I)], 419 refined parameters, R1 = 0.0439, wR2 = 0.0963 [I > 2σ(I)]; maximal residual electron density: 1.87/−1.44 e Å−3.
Crystallographic data for the structural analysis of compounds 5, 6, 9 has been deposited at the Cambridge Crystallographic Data Center (CCDC numbers 1488860–1488862).
Conclusions
Thus, in this work a combination of electrochemical techniques, ESR spectroscopy and quantum chemical calculations in the study of a series of cyclometalated Pd(II) complexes was used to reveal the dependence of their electrochemical properties on their structures. Namely, the longer distance and weaker interaction between two palladium centers in a molecule, the higher oxidation potential value. Monomeric palladacycles are oxidized more difficult than dimeric ones; phosphonate palladacycles are oxidized more difficult than acetate ones, and etc.The regularity is an important step in understanding the reactivity of cyclometalated palladium(II) complexes in catalytic reactions, particularly ligand-directed oxidative organic functionalizations. An important problem that has to be solved to organize a successful catalytic cycle for Pd(II)-catalyzed C–H functionalizations of arenic substrates is the selection of an appropriate oxidizing agent. The oxidant has to be effective in oxidation of Pd(II) into Pd(III)/Pd(IV) intermediates which turn into the final products in reduction elimination step. Knowledge of oxidation potentials of these important intermediates and comparison study of redox trends of cyclopalladated complexes depending on ligand environment of the metal simplify the control over the catalytic reaction, that is very important in processes where several possible intermediates with different oxidation potentials are present. The adequate choice of the oxidation potential (or a chemical oxidant) minimize or even prevents formation of byproducts in these reactions.
The more positive oxidation potential of a palladacycle, the slower its oxidation into Pd(III)/(IV) intermediates under the action of an adopted chemical oxidant, considering all other conditions being equal. However, as the CV and ESR experiments shown the higher oxidation potentials, the less stable the high-valent intermediates and the faster reductive elimination rates. Certainly, the observed regularity is not a rule but a trend revealing the change in palladacycles redox properties with their structure.
Acknowledgements
This work was supported by the Russian Science Foundation (grant no. 14-23-00016).References
- E. Negishi and A. de Meijere, Handbook of Organopalladium Chemistry for Organic Synthesis, 2 Vol. Set, Wiley-VCH, Hoboken, 2002 Search PubMed.
- X. Chen, K. M. Engle, D.-H. Wang and J.-Q. Yu, Angew. Chem., Int. Ed., 2009, 48, 5094–5115 CrossRef CAS PubMed.
- A. Jutand, Chem. Rev., 2008, 108, 2300–2347 CrossRef CAS PubMed.
- D. C. Powers and T. Ritter, Top. Organomet. Chem., 2011, 35, 129–156 CrossRef CAS.
- J. M. Racowski and M. S. Sanford, Top. Organomet. Chem., 2011, 35, 61–84 CrossRef CAS.
- S. R. Neufeldt and M. S. Sanford, Acc. Chem. Res., 2012, 45, 936–946 CrossRef CAS PubMed.
- T. W. Lyons and M. S. Sanford, Chem. Rev., 2010, 110, 1147–1169 CrossRef CAS PubMed.
- C. Li, T. Yano, N. Ishida and M. Murakami, Angew. Chem., Int. Ed., 2013, 52, 9801–9804 CrossRef CAS PubMed.
- Ch.-G. Feng, M. Ye, K.-J. Xiao, S. Li and J.-Q. Yu, J. Am. Chem. Soc., 2013, 135, 9322–9325 CrossRef CAS PubMed.
- Y. Ye, N. D. Ball, J. W. Kampf and M. S. Sanford, J. Am. Chem. Soc., 2010, 133, 14682–14687 CrossRef PubMed.
- Q. Dang, Y. Liu, D. K. Cashion, S. R. Kasibhatla, T. Jiang, F. Taplin, J. D. Jacintho, H. Li, Z. Sun, Y. Fan, J. DaRe, F. Tian, W. Li, T. Gibson, R. Lemus, P. D. van Poelje, S. C. Potter and M. D. Erion, J. Med. Chem., 2011, 54, 153–165 CrossRef CAS PubMed.
- X. Chen, D. J. Kopecky, J. Mihalic, S. Jeffries, X. Min, J. Heath, J. Deignan, S. Lai, Z. Fu, C. Guimaraes, S. Shen, S. Li, S. Johnstone, S. Thibault, H. Xu, M. Cardozo, W. Shen, N. Walker, F. Kayser and Z. Wang, J. Med. Chem., 2012, 55, 3837–3851 CrossRef CAS PubMed.
- P. Kirsch, Modern Fluoroorganic Chemistry: Synthesis, Reactivity, Applications, Wiley-VCH, Weinheim, 2004 Search PubMed.
- K. Müller, C. Faeh and F. Diederich, Science, 2007, 317, 1881–1886 CrossRef PubMed.
- D. C. Powers, M. A. L. Geibel, J. E. M. N. Klein and T. Ritter, J. Am. Chem. Soc., 2009, 131, 17050–17051 CrossRef CAS PubMed.
- M. G. Campbell, D. C. Powers, J. Raynaud, M. J. Graham, P. Xie, E. Lee and T. Ritter, Nat. Chem., 2011, 3, 949–953 CrossRef CAS PubMed.
- J. E. Bercaw, A. C. Durrell, H. B. Gray, J. C. Green, N. Hazari, J. A. Labinger and J. R. Winkler, Inorg. Chem., 2010, 49, 1801–1810 CrossRef CAS PubMed.
- Y. B. Dudkina, D. Y. Mikhaylov, T. V. Gryaznova, A. I. Tufatullin, O. N. Kataeva, D. A. Vicic and Y. H. Budnikova, Organometallics, 2013, 32, 4785–4792 CrossRef CAS.
- B. N. Nguyen, L. A. Adrio, T. Albrecht, A. J. P. White, M. A. Newton, M. Nachtegaal, S. J. A. Figueroa and K. K. Hii, Dalton Trans., 2015, 44, 16586–16591 RSC.
- A. Ariafard, C. J. T. Hyland, A. J. Canty, M. Sharma and B. F. Yates, Inorg. Chem., 2011, 50, 6449–6457 CrossRef CAS PubMed.
- R. Giri, Y. Lan, P. Liu, K. N. Houk and J.-Q. Yu, J. Am. Chem. Soc., 2012, 134, 14118–14126 CrossRef CAS PubMed.
- A. J. Canty, A. Ariafard, M. S. Sanford and B. F. Yates, Organometallics, 2013, 32, 544–555 CrossRef CAS.
- M. C. Nielsen, E. Lyngvi and F. Schoenebeck, J. Am. Chem. Soc., 2013, 135, 1978–1985 CrossRef CAS PubMed.
- D. C. Powers, E. Lee, A. Ariafard, M. S. Sanford, B. F. Yates, A. J. Canty and T. Ritter, J. Am. Chem. Soc., 2012, 134, 12002–12009 CrossRef CAS PubMed.
- B. E. Haines, J. F. Berry, J.-Q. Yu and D. G. Musaev, ACS Catal., 2016, 6, 829–839 CrossRef CAS.
- A. R. Dick, K. L. Hull and M. S. Sanford, J. Am. Chem. Soc., 2004, 126, 2300–2301 CrossRef CAS PubMed.
- J. E. Bercaw, A. C. Durrell, H. B. Gray, J. C. Green, N. Hazari, J. A. Labinger and J. R. Winkler, Inorg. Chem., 2010, 49, 1801–1810 CrossRef CAS PubMed.
- D. C. Powers and T. Ritter, Nat. Chem., 2009, 1, 302–309 CrossRef CAS PubMed.
- J. L. Serrano, L. García, J. Pérez, E. Pérez, J. M. Galiana, J. García, M. Martínez, G. Sánchez and I. da Silva, Dalton Trans., 2011, 40, 156–168 RSC.
- N. Marino, C. H. Fazen, J. D. Blakemore, C. D. Incarvito, N. Hazari and R. P. Doyle, Inorg. Chem., 2011, 50, 2507–2520 CrossRef CAS PubMed.
- T. V. Grayaznova, Yu. B. Dudkina, D. R. Islamov, O. N. Kataeva, O. G. Sinyashin, D. A. Vicic and Yu. H. Budnikova, J. Organomet. Chem., 2015, 785, 68–71 CrossRef CAS.
- T. Gryaznova, Yu. Dudkina, M. Khrizanforov, O. Sinyashin, O. Kataeva and Yu. Budnikova, J. Solid State Electrochem., 2015, 19, 2665–2672 CrossRef CAS.
- T. Pawlak, D. Niedzielska, J. Vícha, R. Marek and L. Pazderski, J. Organomet. Chem., 2014, 759, 58–66 CrossRef CAS.
- G. J. Chuang, W. Wang, E. Lee and T. Ritter, J. Am. Chem. Soc., 2011, 133, 1760–1762 CrossRef CAS PubMed.
- F. A. Cotton, J. Gu, C. A. Murillo and D. J. Timmons, J. Am. Chem. Soc., 1998, 120, 13280–13281 CrossRef CAS.
- F. A. Cotton, M. Matusz, R. Poli and X. Feng, J. Am. Chem. Soc., 1988, 110, 1144–1154 CrossRef CAS.
- J. F. Berry, F. A. Cotton, S. A. Ibragimov, C. A. Murillo and X. Wang, Inorg. Chem., 2005, 44, 6129–6137 CrossRef CAS PubMed.
- J. F. Berry, E. Bill, E. Bothe, F. A. Cotton, N. S. Dalal, S. A. Ibragimov, N. Kaur, C. Y. Liu, C. A. Murillo, S. Nellutla, J. M. North and D. Villagrán, J. Am. Chem. Soc., 2007, 129, 1393–1401 CrossRef CAS PubMed.
- C. L. Yao, L. P. He, J. D. Korp and J. L. Bear, Inorg. Chem., 1988, 27, 4389–4395 CrossRef CAS.
- M. G. Campbell, S.-L. Zheng and T. Ritter, Inorg. Chem., 2013, 52, 13295–13297 CrossRef CAS PubMed.
- L. M. Mirica and J. R. Khusnutdinova, Coord. Chem. Rev., 2013, 257, 299–314 CrossRef CAS.
- B. R. Patyal, B. L. Scott and R. D. Willett, Phys. Rev. B: Condens. Matter, 1990, 41, 1657–1663 CrossRef CAS.
- V. I. Krinichnyi, Appl. Phys. Rev., 2014, 1, 021305 Search PubMed.
- C. M. Cardona, W. Li, A. E. Kaifer, D. Stockdale and G. C. Bazan, Adv. Mater., 2011, 23, 2367–2371 CrossRef CAS PubMed.
- A. Dadvand, F. Cicoira, K. Yu. Chernichenko, E. S. Balenkova, R. M. Osuna, F. Rosei, V. G. Nenajdenko and D. F. Perepichka, Chem. Commun., 2008, 5354–5356 RSC.
- Y. Liang, Z. Xu, J. Xia, S. T. Tsai, Y. Wu, G. Li, C. Ray and L. Yu, Adv. Mater., 2010, 22, E135–E138 CrossRef CAS PubMed.
- L. J. Huo, J. H. Hou, S. Q. Zhang, H. Y. Chen and Y. Yang, Angew. Chem., Int. Ed., 2010, 49, 1500–1503 CrossRef CAS PubMed.
- C. Hsiang-Yu, H. Jianhui, Z. Shaoqing, L. Yongye, Y. Guanwen, Y. Yang, Y. Luping, W. Yue and L. Gang, Nat. Photonics, 2009, 3, 649–653 CrossRef.
- Y. Liang, D. Feng, Y. Wu, S.-T. Tsai, G. Li, C. Ray and L. Yu, J. Am. Chem. Soc., 2009, 131, 7792–7799 CrossRef CAS PubMed.
- Y. Liang, Y. Wu, D. Feng, S.-T. Tsai, H.-J. Son, G. Li and L. Yu, J. Am. Chem. Soc., 2009, 131, 56–57 CrossRef CAS PubMed.
- C. T. Campos and F. E. Jorge, Mol. Phys., 2013, 111, 167–173 CrossRef CAS.
- C. L. Barros, P. J. P. de Oliveira, F. E. Jorge, A. Canal Neto and M. Campos, Mol. Phys., 2010, 108, 1965–1972 CrossRef CAS.
- F. E. Jorge, A. Canal Neto, G. G. Camilett and S. F. Machado, J. Chem. Phys., 2009, 130, 064108 CrossRef CAS PubMed.
- J. Tomasi, B. Mennucci and R. Cammi, Chem. Rev., 2005, 105, 2999–3093 CrossRef CAS PubMed.
- W. Ramsay and R. Foster, Nature, 1949, 163, 178–179 CrossRef.
- R. E. Ballard, Chem. Phys. Lett., 1976, 42, 97–98 CrossRef CAS.
- L. L. Miller, G. D. Nordblom and E. A. Mayeda, J. Org. Chem., 1972, 37, 916–918 CrossRef CAS.
- W. C. Neikam, G. R. Dimeler and M. M. Desmond, J. Electrochem. Soc., 1964, 111, 1190–1192 CrossRef CAS.
- A. J. Bard and L. R. Faulkner, Electrochemical Methods: Fundamentals and Applications, Wiley, New York, 2001 Search PubMed.
- R. F. W. Bader, Atoms in Molecules: A Quantum theory, Oxford University Press, New York, 1990 Search PubMed.
- L. Estévez, N. Otero and R. A. Mosquera, J. Phys. Chem. A, 2009, 113, 11051–11058 CrossRef PubMed.
- W. Nakanishi, S. Hayashi and K. Narahara, J. Phys. Chem. A, 2008, 112, 13593–13599 CrossRef CAS PubMed.
- K. Kholin, M. Valitov, V. Burilov, E. Tselischeva, S. Strekalova, A. Mustafina, Yu. Budnikova and M. Kadirov, Electrochim. Acta, 2015, 182, 212–216 CrossRef CAS.
- S. Šoralova, M. Breza and M. Grof, Polyhedron, 2011, 30, 307–314 CrossRef.
- E. Derat and G. Maestri, Wiley Interdiscip. Rev.: Comput. Mol. Sci.., 2013, 3, 529–541 CrossRef CAS.
- K. Arumugam and U. Becker, Minerals, 2014, 4, 345–387 CrossRef CAS.
- P. Jaque, A. V. Marenich, C. J. Cramer and D. G. Truhlar, J. Phys. Chem. C, 2007, 111, 5783–5799 CAS.
- M.-H. Baik; and R. A. Friesner, J. Phys. Chem. A, 2002, 106, 7407–7412 CrossRef.
- K. A. Peterson, D. Figgen, M. Dolg and H. Stoll, J. Chem. Phys., 2007, 126, 124101 CrossRef PubMed.
- D. Figgen, K. A. Peterson and H. Stoll, J. Chem. Phys., 2008, 128, 034110 CrossRef PubMed.
- K. A. Peterson, J. Chem. Phys., 2003, 119, 11099–11112 CrossRef CAS.
- K. A. Peterson, D. Figgen, E. Goll, H. Stoll and M. Dolg, J. Chem. Phys., 2003, 119, 11113–11123 CrossRef CAS.
- A. V. Zaitsevskii, C. van Wüllen and A. V. Titov, Russ. Chem. Rev., 2009, 78, 1173–1181 CrossRef CAS.
- M. Iliaš, V. Kellö and M. Urban, Acta Phys. Slovaca, 2010, 60, 259–391 Search PubMed.
- S. Wilson, Electron correlation in Molecules, Oxford University Press, Oxford, 1984 Search PubMed.
- EMSL Basis set Exchange, https://bse.pnl.gov/bse/portal.
- M. Douglas and N. M. Kroll, Ann. Phys., 1974, 82, 89–155 CAS.
- B. A. Hess, Phys. Rev. A, 1985, 32, 756–763 CrossRef CAS.
- B. A. Hess, Phys. Rev. A, 1986, 33, 3742–3748 CrossRef CAS.
- M. J. Frisch, G. W. Trucks, H. B. Schlegel, G. E. Scuseria, M. A. Robb, J. R. Cheeseman, G. Scalmani, V. Barone, B. Mennucci, G. A. Petersson, H. Nakatsuji, M. Caricato, X. Li, H. P. Hratchian, A. F. Izmaylov, J. Bloino, G. Zheng, J. L. Sonnenberg, M. Hada, M. Ehara, K. Toyota, R. Fukuda, J. Hasegawa, M. Ishida, T. Nakajima, Y. Honda, O. Kitao, H. Nakai, T. Vreven, J. A. Montgomery Jr., J. E. Peralta, F. Ogliaro, M. Bearpark, J. J. Heyd, E. Brothers, K. N. Kudin, V. N. Staroverov, R. Kobayashi, J. Normand, K. Raghavachari, A. Rendell, J. C. Burant, S. S. Iyengar, J. Tomasi, M. Cossi, N. Rega, J. M. Millam, M. Klene, J. E. Knox, J. B. Cross, V. Bakken, C. Adamo, J. Jaramillo, R. Gomperts, R. E. Stratmann, O. Yazyev, A. J. Austin, R. Cammi, C. Pomelli, J. W. Ochterski, R. L. Martin, K. Morokuma, V. G. Zakrzewski, G. A. Voth, P. Salvador, J. J. Dannenberg, S. Dapprich, A. D. Daniels, Ö. Farkas, J. B. Foresman, J. V. Ortiz, J. Cioslowski and D. J. Fox, Gaussian, Inc., Wallingford, CT, 2009.
- T. A. Keith, AIMALL, version 09.04.23, TK Gristmill Software, 2009 Search PubMed.
- Bruker, APEX2 Software Suite for Crystallographic Programs, Bruker AXS, Inc., Madison, WI, USA, 2009 Search PubMed.
- Bruker, Area detector control and integration software, Version 5.1, In SMART and SAINT, Bruker Analytical X-ray Instruments Inc., Madison, Wisconsin, USA, 1996 Search PubMed.
- M. Sheldrick, SADABS. Program for absorption correction, University of Goettingen, Germany, 1996 Search PubMed.
- G. M. Sheldrick, Acta Crystallogr., Sect. A: Fundam. Crystallogr., 2008, 64, 112–122 CrossRef CAS PubMed.
- C. F. Macrae, P. R. Edgington, P. McCabe, E. Pidcock, G. P. Shields, R. Taylor, M. Towler and J. van de Streek, J. Appl. Crystallogr., 2006, 39, 453–457 CrossRef CAS.
Footnote |
| † Electronic supplementary information (ESI) available: Cyclic and differential pulse voltammograms of palladacycles reductions and oxidations, experimental and simulated ESR spectra, results of topological analysis based on QTAIM, NMR spectra of new compounds. CCDC 1488860–1488862. For ESI and crystallographic data in CIF or other electronic format see DOI: 10.1039/c6dt03786k |
| This journal is © The Royal Society of Chemistry 2017 |

