Highly active and selective binary MgO–SiO2 catalysts for the production of 1,3-butadiene from ethanol
Xiaoxiong
Huang
,
Yong
Men
*,
Jinguo
Wang
,
Wei
An
and
Yuanqiang
Wang
College of Chemistry and Chemical Engineering, Shanghai University of Engineering Science, Shanghai 201620, P. R. China. E-mail: men@sues.edu.cn; Fax: +86 21 67791214
First published on 21st November 2016
Abstract
A series of magnesia–silica binary composite catalysts with different molar ratios were prepared using various preparation methods and evaluated for the one-step production of 1,3-butadiene (BD) from bio-ethanol. The MgO–SiO2 catalyst prepared by wet-kneading is distinguished from the samples prepared by other methods by its superior activity. An exceptionally high productivity of butadiene with the high ethanol conversion of 95% and BD selectivity of 77% was obtained over wet-kneaded hierarchical flower-like MgO nanostructures with the catalytic material made up of SiO2 spheres (with a MgO![[thin space (1/6-em)]](https://www.rsc.org/images/entities/char_2009.gif) :
:![[thin space (1/6-em)]](https://www.rsc.org/images/entities/char_2009.gif) SiO2 molar ratio of 65
SiO2 molar ratio of 65![[thin space (1/6-em)]](https://www.rsc.org/images/entities/char_2009.gif) :
:![[thin space (1/6-em)]](https://www.rsc.org/images/entities/char_2009.gif) 35 at 450 °C and an WHSV of 4.1 h−1), which translates into an unprecedented BD yield of 0.025 mol gcat−1 h−1. The as-prepared catalysts were characterized by XRD, FESEM, BET, FT-IR, UV/vis, CO2-TPD and NH3-TPD. The Mg precursor used and the preparation method are found to influence the extent of MgO and SiO2 interactions during preparation, as estimated by various techniques, which, in turn, was found to correlate with the catalytic performance. A subtle balance of surface acidity/basicity was found to be necessary to achieve a high butadiene yield which can be obtained by variation of MgO
35 at 450 °C and an WHSV of 4.1 h−1), which translates into an unprecedented BD yield of 0.025 mol gcat−1 h−1. The as-prepared catalysts were characterized by XRD, FESEM, BET, FT-IR, UV/vis, CO2-TPD and NH3-TPD. The Mg precursor used and the preparation method are found to influence the extent of MgO and SiO2 interactions during preparation, as estimated by various techniques, which, in turn, was found to correlate with the catalytic performance. A subtle balance of surface acidity/basicity was found to be necessary to achieve a high butadiene yield which can be obtained by variation of MgO![[thin space (1/6-em)]](https://www.rsc.org/images/entities/char_2009.gif) :
:![[thin space (1/6-em)]](https://www.rsc.org/images/entities/char_2009.gif) SiO2 ratios in wet-kneaded samples. In view of the difference in catalytic activity and the physicochemical properties of the MgO–SiO2 composite catalysts, the Si–O–Mg chemical bond formed by the strong MgO and SiO2 interaction is suggested to be essential for the balanced surface acid/base sites in relation to the strong interaction between MgO and SiO2 and the consequent high catalytic performance.
SiO2 ratios in wet-kneaded samples. In view of the difference in catalytic activity and the physicochemical properties of the MgO–SiO2 composite catalysts, the Si–O–Mg chemical bond formed by the strong MgO and SiO2 interaction is suggested to be essential for the balanced surface acid/base sites in relation to the strong interaction between MgO and SiO2 and the consequent high catalytic performance.
1. Introduction
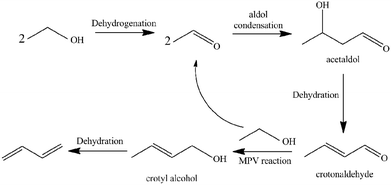
1,3-Butadiene (BD) is one of the most important lighter olefins being used as an intermediate in the production of a variety of polymers such as styrene–butadiene rubber, acrylonitrile–butadiene–styrene polymer, acrylonitrile–butadiene–styrene (ABS) resins and polybutadiene.1–5 Currently, BD is predominantly obtained as a by-product from the C4 fraction from naphtha steam crackers where ethylene is the main product.6 However, recent trends in shifting to lighter feedstocks for the steam crackers will decrease BD yields while the increasing demand for BD on the market may lead to a serious shortage in BD production. To develop alternative technologies for BD production, a renewable and non-petroleum rooted route is highly desirable. As one of the most prospective sources for butadiene production,7,8 bio-ethanol can be obtained via fermentation of carbohydrates (sugar and corn, etc.) or cellulosic materials.9–11The direct production of BD from ethanol is an old, industrially-proven process, which was used from the 1920s to the early 1960s. This process was completely scrapped with increasing oil production. However, research interest on direct catalytic conversion of ethanol into BD has been recently renewed as a potential alternative renewable route due to the high crude oil prices and world-wide abundant supply of bio-ethanol. A one-step process was developed by Lebedev12 using a variety of mixed metal oxide as catalysts. Several reports in the literature had reported a consensus on a number of key steps for the cascade transformation of ethanol into BD (see Scheme 1):13–18 (1) ethanol dehydrogenates to acetaldehyde; (2) the aldol condensation of acetaldehyde to acetaldol; (3) dehydration of acetaldol to crotonaldehyde; (4) a Meerwein–Ponndorf–Verley-type reduction between crotonaldehyde and ethanol to obtain crotyl alcohol and acetaldehyde; and (5) a final dehydration of crotyl alcohol to BD.
According to different literature sources,19–33 various catalysts have been proposed to perform this reaction involving different transition metal combinations. Magnesia–silica catalysts were intensively investigated by many research groups,13,34 and demonstrated to be very efficient for the one-pot conversion of ethanol to BD, whose performance was also affected greatly by the preparation method.34,35 It was reported that the wet-kneaded material, containing Mg(OH)2 (prepared from hydrolysis of Mg(NO3)2 with NH3) and SiO2 (prepared from hydrolysis of Si(OEt)4 with HNO3, EtOH and NH3), has the best catalytic activity.3 The term “wet-kneading”, coined by Natta et al.,36 was first used in the preparation of a MgO–SiO2 catalyst from magnesium hydroxide and colloidal silica for the ethanol-to-butadiene process. The effect of the preparation method was further studied by Kvisle et al., who showed that the MgO–SiO2 catalyst prepared by wet-kneading performed better than that prepared by the mechanical mixture of the components, highlighting the synergetic effect of the solids during the preparation.34 Angelici et al. also observed that a MgO–SiO2 catalyst prepared by wet-kneading with 1 wt% of CuO as the promoter exhibited higher butadiene yields and selectivities than the physical mixture of the components or catalysts prepared by co-precipitation.35 Very recently, Chung and co-workers37 investigated that the variation of the Mg precursor and of the MgO content determines the extent of magnesium silicate formation during wet-kneading, pointing out that the amounts of layered magnesium silicates were found to correlate with the catalyst performance in the Lebedev process. Weckhuysen and co-workers38 showed that the equimolar MgO–SiO2 catalysts prepared by wet-kneading were performing better and concluded that the best performing catalysts are due to the appropriate balance of a small amount of strong basic sites, combined with an intermediate amount of acidic sites and weak basic ones. On the other hand, the optimal Mg/Si ratio is also known to be an important parameter strongly influencing catalyst performance. For instance, Makshina et al.5 reported an optimal content of 0.66MgO to achieve 55% BD selectivity with complete ethanol conversion. Additionally, many catalytic systems devoted to the synthesis of BD from ethanol involved amphoteric oxides with different transition metal combinations, including Hf–Zn/SiO2,28 ZrBEA zeolite,26 Ag/ZrBEA,29 and ZnZr/MgO–SiO230 catalysts. Furthermore, considerable improvements were realized by supporting Cu35 or Ag39 to facilitate the dehydrogenation, showing almost complete ethanol conversion, and butadiene yields higher than 50%. Despite these advances, the MgO–SiO2 catalysts still showed butadiene yields ranging from 9 to 42% and selectivities between 30 and 84%.13,34,35 Therefore, the attainment of a high selectivity to 1,3-BD together with a high conversion of ethanol in a one-step process still remains to be a challenging task, primarily because the parameters of the preparation method, structural properties and Mg/Si ratio and so on would influence the catalytic performance of MgO–SiO2 catalysts.
The direct conversion of ethanol to BD constitutes a very complex reaction network, and many undesired reactions may occur competitively with the main reaction pathway by forming a plethora of by-products, including butanol, butene, diethyl ether, ethyl acetate and ethane and so forth. Despite the efforts conducted over MgO–SiO2 catalysts for the ethanol conversion to BD, the detailed mechanism has not yet been fully elucidated and still under debate. Based upon the literature reports, a subtle balance of different surface active sites (acidic, basic, and redox) resulting from the morphological and structural differences observed for the various catalysts is essential for the Lebedev process. For key biomass-related reactions such as ethanol to BD, studies of MgO–SiO2 binary catalysts with properly-tuned surface composition and properties may provide an important insight into the structure–property relationship, allowing us to better understand the key factors necessary to make better catalysts.
In the present work, the hierarchical structured flowerlike MgO precursor was synthesized by an ethylene-glycol-mediated (EG) self-assembly process in the presence of poly(vinylpyrrolidone) (PVP) and used for the wet-kneading with SiO2 for direct conversion of ethanol to yield BD. Subsequently, the different preparation methods and MgO![[thin space (1/6-em)]](https://www.rsc.org/images/entities/char_2009.gif) :
:![[thin space (1/6-em)]](https://www.rsc.org/images/entities/char_2009.gif) SiO2 molar ratios were employed with the purpose of developing high performance MgO–SiO2 binary catalysts for direct conversion of ethanol into BD. The physicochemical properties of these catalysts were examined by means of X-ray diffraction (XRD), physisorption (the BET method), Fourier transform infrared spectroscopy (FT-IR), UV/vis diffuse absorption spectroscopy, CO2-temperature-programmed desorption (CO2-TPD), NH3-temperature-programmed desorption (NH3-TPD) and field emission-scanning electron microscopy (FESEM), and correlated with their catalytic performance.
SiO2 molar ratios were employed with the purpose of developing high performance MgO–SiO2 binary catalysts for direct conversion of ethanol into BD. The physicochemical properties of these catalysts were examined by means of X-ray diffraction (XRD), physisorption (the BET method), Fourier transform infrared spectroscopy (FT-IR), UV/vis diffuse absorption spectroscopy, CO2-temperature-programmed desorption (CO2-TPD), NH3-temperature-programmed desorption (NH3-TPD) and field emission-scanning electron microscopy (FESEM), and correlated with their catalytic performance.
2. Experimental section
2.1. Materials
Ethylene glycol (EG), Mg(CH3COO)2·4H2O, ethanol, polyvinylpyrrolidone (PVP, K30), NH3·H2O (25 wt%), tetraethyl orthosilicate (TEOS) and (MgCO3)4Mg(OH)2·5H2O were purchased from Aladdin Chemistry Co., Ltd. (Shanghai, China). All of the chemicals were used as received without further purification.2.2. Catalyst preparation
MgO was prepared following the procedure reported by Cui et al.40 Typically, 1.712 g of magnesium acetate (Mg(CH3COO)2·4H2O) and 1.328 g of PVP were dissolved in 40 mL of EG. After stirring with a magnetic stir rotor for 30 min, a clear solution was obtained. The clear solution was then transferred into a 100 mL Teflon-lined stainless-steel autoclave, which was then kept in an oven at 180 °C for 5 h. After natural cooling to room temperature, the solid products were collected by centrifugation, thoroughly washed with ethanol several times, and then dried in an oven at 100 °C for 12 h to obtain the magnesium oxide precursor. Finally, the MgO precursor was calcined at 500 °C for 2 h to obtain the crystalline MgO. To compare the catalytic performance of our obtained materials, commercial MgO (MgO-C) (synthesized by calcining commercial (MgCO3)4Mg(OH)2·5H2O in air at 450 °C for 16 h) was also used.Bare spherical silica was prepared by the Stöber route41 as follows: TEOS was hydrolyzed using an ethanol–water–ammonia solution (25![[thin space (1/6-em)]](https://www.rsc.org/images/entities/char_2009.gif) :
:![[thin space (1/6-em)]](https://www.rsc.org/images/entities/char_2009.gif) 15
15![[thin space (1/6-em)]](https://www.rsc.org/images/entities/char_2009.gif) :
:![[thin space (1/6-em)]](https://www.rsc.org/images/entities/char_2009.gif) 3.14 vol./vol./vol.) in a closed vessel by stirring at room temperature for 4 h, followed by centrifugation and thorough washing with ethanol. Then the solid products were dried at 100 °C for 12 h.
3.14 vol./vol./vol.) in a closed vessel by stirring at room temperature for 4 h, followed by centrifugation and thorough washing with ethanol. Then the solid products were dried at 100 °C for 12 h.
Four MgO–SiO2 catalysts were prepared with a 65![[thin space (1/6-em)]](https://www.rsc.org/images/entities/char_2009.gif) :
:![[thin space (1/6-em)]](https://www.rsc.org/images/entities/char_2009.gif) 35 molar ratio (based on the above results) of the two components to investigate the effect of the different preparation methods on the catalytic performance. The physical mixture MgO–SiO2 (I) was made by mixing (5 min) the two calcined individual components, prepared as detailed above, in a mortar. Finally, the dried solid was calcined at 500 °C for 5 h in air. MgO–SiO2 (II) was prepared by a sol–gel method.42 In a typical procedure, 0.6 mL of NH3·H2O (25 wt%) was first added to an 8 mL mixture of ethanol and water (25
35 molar ratio (based on the above results) of the two components to investigate the effect of the different preparation methods on the catalytic performance. The physical mixture MgO–SiO2 (I) was made by mixing (5 min) the two calcined individual components, prepared as detailed above, in a mortar. Finally, the dried solid was calcined at 500 °C for 5 h in air. MgO–SiO2 (II) was prepared by a sol–gel method.42 In a typical procedure, 0.6 mL of NH3·H2O (25 wt%) was first added to an 8 mL mixture of ethanol and water (25![[thin space (1/6-em)]](https://www.rsc.org/images/entities/char_2009.gif) :
:![[thin space (1/6-em)]](https://www.rsc.org/images/entities/char_2009.gif) 15 vol./vol.). After stirring for 0.5 h, 1.4 g of the Mg(CH3COO)2·4H2O precursor was dispersed in the solution, followed by the addition of 0.7 mL of TEOS. Then the mixture was stirred for a few hours until dryness, then dried at 120 °C overnight and calcined at 500 °C for 5 h in air. MgO–SiO2 (III) was prepared by incipient wetness impregnation: 0.1 mL of a 4.03 M solution of Mg(CH3COO)2·4H2O in water was added to the support material (SiO2) and then the sample was left for 24 h to equilibrate, then dried at 100 °C for 12 h. Finally, the dried solid was calcined at 500 °C for 5 h in air. The sample MgO–SiO2 (IV) was synthesized by wet-kneading. MgO–SiO2 (IV) was prepared by a wet-kneading procedure similar to the previous reports by Kvisle et al. by using the appropriate molar ratio of MgO to SiO2.34 A mixture containing the MgO and SiO2 was mixed at 50 °C for 5 h in water. Then the suspension was stirred constantly and heated at about 100 °C to evaporate water until dryness. Finally, the dried solid catalyst was calcined at 500 °C for 5 h in air. Materials with various MgO–SiO2 molar ratios equal to 50
15 vol./vol.). After stirring for 0.5 h, 1.4 g of the Mg(CH3COO)2·4H2O precursor was dispersed in the solution, followed by the addition of 0.7 mL of TEOS. Then the mixture was stirred for a few hours until dryness, then dried at 120 °C overnight and calcined at 500 °C for 5 h in air. MgO–SiO2 (III) was prepared by incipient wetness impregnation: 0.1 mL of a 4.03 M solution of Mg(CH3COO)2·4H2O in water was added to the support material (SiO2) and then the sample was left for 24 h to equilibrate, then dried at 100 °C for 12 h. Finally, the dried solid was calcined at 500 °C for 5 h in air. The sample MgO–SiO2 (IV) was synthesized by wet-kneading. MgO–SiO2 (IV) was prepared by a wet-kneading procedure similar to the previous reports by Kvisle et al. by using the appropriate molar ratio of MgO to SiO2.34 A mixture containing the MgO and SiO2 was mixed at 50 °C for 5 h in water. Then the suspension was stirred constantly and heated at about 100 °C to evaporate water until dryness. Finally, the dried solid catalyst was calcined at 500 °C for 5 h in air. Materials with various MgO–SiO2 molar ratios equal to 50![[thin space (1/6-em)]](https://www.rsc.org/images/entities/char_2009.gif) :
:![[thin space (1/6-em)]](https://www.rsc.org/images/entities/char_2009.gif) 50, 65
50, 65![[thin space (1/6-em)]](https://www.rsc.org/images/entities/char_2009.gif) :
:![[thin space (1/6-em)]](https://www.rsc.org/images/entities/char_2009.gif) 35, 75
35, 75![[thin space (1/6-em)]](https://www.rsc.org/images/entities/char_2009.gif) :
:![[thin space (1/6-em)]](https://www.rsc.org/images/entities/char_2009.gif) 25, 85
25, 85![[thin space (1/6-em)]](https://www.rsc.org/images/entities/char_2009.gif) :
:![[thin space (1/6-em)]](https://www.rsc.org/images/entities/char_2009.gif) 15 and 95
15 and 95![[thin space (1/6-em)]](https://www.rsc.org/images/entities/char_2009.gif) :
:![[thin space (1/6-em)]](https://www.rsc.org/images/entities/char_2009.gif) 5 were prepared by a wet-kneading procedure described above. Samples were labelled MgO–SiO2 (x), where x denotes the preparation method.
5 were prepared by a wet-kneading procedure described above. Samples were labelled MgO–SiO2 (x), where x denotes the preparation method.
2.3. Catalyst characterization
The crystalline phases of the samples were identified by X-ray powder diffraction (XRD) using a diffractometer (D/Max-r B) with Cu-Kα radiation (λ = 1.54056 Å) at room temperature. The wide angle data were obtained by the step of scanning with a rate of 4° min−1 from 2θ = 10° to 2θ = 80°. Nitrogen adsorption–desorption isotherms were measured at −196 °C on a Micromeritics ASAP 2460 apparatus by applying the Brunauer–Emmett–Teller (BET) and Barrett–Joyner–Halenda (BJH) models on the desorption branches. Before the analysis was conducted, the sample was outgassed at 200 °C for 6 h in a degassing station.The acidic and basic properties of catalysts were investigated by NH3- and CO2-temperature-programmed desorption (NH3-TPD and CO2-TPD) on a Micromeritics Autochem II 2920 apparatus, equipped with a TCD. With regard to the acidity by NH3-TPD, 50 mg of the catalyst in a U-shaped fixed-bed quartz microreactor was treated at 500 °C (ramping rate = 10 °C min−1) for 0.5 h under flowing He (30 mL (STP) min−1), then subsequently the sample was cooled to 100 °C. After that, a 5% NH3/He (30 mL (STP) min−1) gas mixture was applied, followed by flowing in He (30 mL (STP) min−1) until the baseline was stabilized. Then the sample was heated to 900 °C with a ramping rate of 10 °C min−1 to induce desorption of NH3. In the case of CO2-TPD, a procedure similar to the one described above for NH3-TPD was employed.
The Fourier-transform infrared (FT-IR) spectra at room temperature were recorded on a Nicolet 380 spectrometer (USA) infrared spectrometer. The sample was pressed into a thin self-supported wafer and placed in the IR cell. The IR spectra of the catalysts were recorded in air under the conditions without evacuation. Diffuse reflectance (DR) spectra in the UV-vis region were recorded in the absorbance function mode at room temperature using BaSO4 as a background on a UV-2450 spectrophotometer (Shimadzu, Japan). The morphology of the catalysts was probed by a field emission-scanning electron microscope (FESEM, Hitachi S4800).
2.4. Catalyst testing
The conversions of ethanol to 1,3-butadiene were conducted in a fixed bed quartz tube reactor with an internal diameter of 5 mm at atmospheric pressure. In a typical experiment, the catalyst (100 mg) was loaded in the middle of quartz beds. A K-type thermocouple was placed in the middle of the catalyst bed to monitor the reaction temperature. Ethanol was supplied by the carrier gas (50 mL (STP) min−1) through an evaporator kept at constant temperature (20 °C). Prior to the reaction, catalysts were firstly pre-treated in N2/ethanol (50 ml (STP) min−1) at 300 °C for 0.5 h. The reaction temperature was within 300–550 °C. The effluent gas products being heated above 200 °C to avoid the condensation of condensable species were measured by an online Shimadzu 2014 gas chromatograph (GC) with molecular sieves C13X, an Al2O3 column (50 m, 0.53 mm, 10 μm), a Rt-Q-BOND PLOT column (30 m, 0.32 mm ID, 10 μm) and equipped with a thermal conductivity detector (TCD) and two flame ionization detectors (FID). Nitrogen was used as the internal standard for calibration and calculation of GC results. Furthermore, for comparison, the pure oxides SiO2 and MgO were also tested.In the present work, the ethanol conversion and product selectivity were calculated on a per carbon basis and defined by the following three equations:
 | (1) |
 | (2) |
| Yield = Conversion × Selectivity × 100% | (3) |
3. Results and discussion
3.1. Properties of the as-prepared catalysts
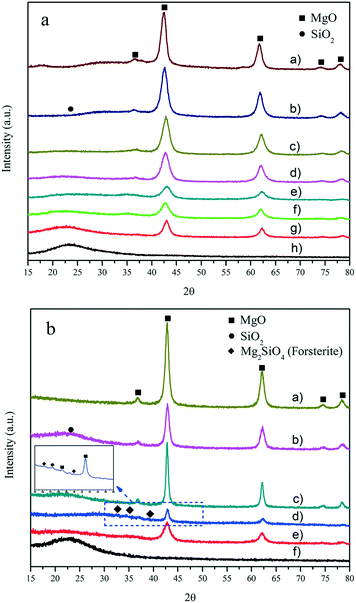
In the X-ray diffraction (XRD) patterns of the MgO–SiO2 catalysts with varying molar ratios (Fig. 1(a)) and prepared by different preparation methods (Fig. 1(b)) in Fig. 1, the presence of the crystalline MgO phase in all MgO–SiO2 composite catalysts can be identified. The diffraction peaks at 2θ of 36.9°, 42.9°, 62.3°, 74.7° and 78.6° were indexed to the (111), (200), (220), (311) and (222) diffraction planes of the periclase phase of cubic MgO (JCPDS 45-946), respectively.5 A halo was observed on all catalysts in the region at 2θ from 20° to 40° due to the presence of amorphous SiO2. The XRD analyses also show that MgO and SiO2 still maintain their native morphology in the MgO–SiO2. Clearly, the MgO–SiO2 catalysts with a higher Si content were mainly amorphous with only weak reflections corresponding to MgO. Notably, in the case of the MgO–SiO2 (the molar ratio was 65![[thin space (1/6-em)]](https://www.rsc.org/images/entities/char_2009.gif) :
:![[thin space (1/6-em)]](https://www.rsc.org/images/entities/char_2009.gif) 35), the XRD patterns contain diffraction peaks corresponding to the crystalline MgO phase, and their intensity is significantly lower than those for the other molar ratios (including MgO-C–SiO2), which suggests significant chemical changes in the MgO component and more abundant crystal defects creating more corners, edges, and steps on the MgO surface formed by the well dispersed phase over the SiO2 surface.
35), the XRD patterns contain diffraction peaks corresponding to the crystalline MgO phase, and their intensity is significantly lower than those for the other molar ratios (including MgO-C–SiO2), which suggests significant chemical changes in the MgO component and more abundant crystal defects creating more corners, edges, and steps on the MgO surface formed by the well dispersed phase over the SiO2 surface.
As shown in Fig. 1(b), the order of crystallinity estimated by the intensity of the periclase reflections (MgO–SiO2 (III) > MgO–SiO2 (I) > MgO–SiO2 (IV) > MgO–SiO2 (II)) does not correlate with catalytic performance (as shown below). MgO–SiO2 (II) exhibited the lowest crystallinity likely due to the increased surface imperfection of the magnesium oxide crystals, indicating the decrease in the size of the MgO crystals and an increase in the crystal defects, both affected by the enhanced interaction of MgO with SiO2.39 For MgO–SiO2 (III) and MgO–SiO2 (I), the high crystallinity of the periclase is evidently retained. On the other hand, some minor phases other than MgO and SiO2 were identified over the MgO–SiO2 sample prepared by the sol–gel method, which was assignable to the forsterite-like phase (Mg2SiO4) in Fig. 1(b). Similar XRD peaks have been observed in previous reports.42
The morphology of MgO, SiO2 and MgO–SiO2 (IV) catalysts was examined by SEM, as shown in the images in Fig. 2(a–d). Fig. 2(a) and (b) show that MgO synthesized by using an EG-mediated self-assembly process gives uniform flower-like structures with an average diameter of approximately 600 nm after calcination at 500 °C for 2 h. As seen in Fig. 1(b), the dense core of each flower-like MgO structure consists of well-separated spherical particles, which indicates that the building blocks are connected to each other at the center and not aggregated at the outside realm of the sphere. Such a unique morphology may endow the MgO materials with some distinct features, such as strong mechanical strength and facile mass transport on its surface. Fig. 2(c) shows that the as-formed SiO2 sample consists of well-separated spherical particles with an average size of 300 nm and a narrow size distribution. As displayed in Fig. 2(d), the MgO–SiO2 (IV) wet-kneaded composite has a relatively rugged surface, while the overall morphology of the MgO in the binary wet-kneaded catalyst remains the same original flower-like nanostructure as the sole MgO.
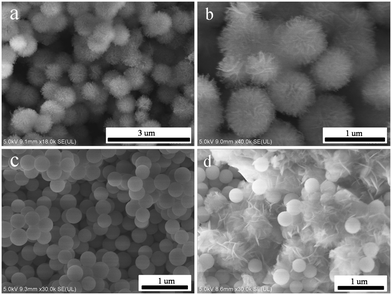 | ||
| Fig. 2 FESEM images of (a and b) hierarchical flower-like MgO, (c) SiO2 spheres, and (d) MgO–SiO2 (IV). | ||
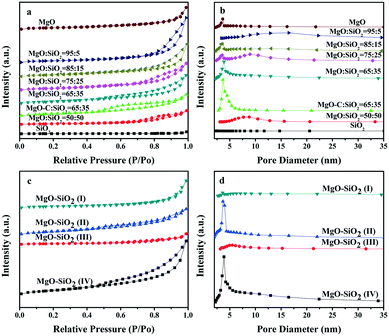
The isotherms and pore size distribution curves of the as-prepared MgO–SiO2 binary oxide catalysts are illustrated in Fig. 3. As can be seen in Fig. 3(a), the nitrogen physisorption isotherms for the five different molar ratios of the MgO![[thin space (1/6-em)]](https://www.rsc.org/images/entities/char_2009.gif) :
:![[thin space (1/6-em)]](https://www.rsc.org/images/entities/char_2009.gif) SiO2, MgO-C
SiO2, MgO-C![[thin space (1/6-em)]](https://www.rsc.org/images/entities/char_2009.gif) :
:![[thin space (1/6-em)]](https://www.rsc.org/images/entities/char_2009.gif) SiO2 and MgO samples show a type IV isotherm with an H3 hysteresis loop in the relative pressure (P/P0) range from 0.4 to 1.0,43 which could be caused by a capillary condensation step according to BDDT classification, indicating the mesoporous pore structure of the catalysts. In contrast, the bare silica prepared by the Stöber route displays a type II isotherm, which is characteristic of non-porous or macroporous materials.44 Meanwhile, their corresponding pore size distribution curves in Fig. 3(b) demonstrated the wide mesopore size distribution, which further confirmed the above conclusion.
SiO2 and MgO samples show a type IV isotherm with an H3 hysteresis loop in the relative pressure (P/P0) range from 0.4 to 1.0,43 which could be caused by a capillary condensation step according to BDDT classification, indicating the mesoporous pore structure of the catalysts. In contrast, the bare silica prepared by the Stöber route displays a type II isotherm, which is characteristic of non-porous or macroporous materials.44 Meanwhile, their corresponding pore size distribution curves in Fig. 3(b) demonstrated the wide mesopore size distribution, which further confirmed the above conclusion.
Fig. 3(c and d) show the nitrogen isotherm and pore size distribution curve of the catalysts prepared by four different preparation methods. The isotherm of the four MgO–SiO2 catalysts displays a type IV isotherm with a capillary condensation step. In contrast to MgO–SiO2 (I) and MgO–SiO2 (III), the isotherms of MgO–SiO2 (II) and MgO–SiO2 (IV) show pronounced type IV characteristics with an H3 hysteresis loop, which reveals the high ordering of the mesopore structure, as depicted in Fig. 3(d). The enhanced volume adsorbed by the MgO–SiO2 (II) and MgO–SiO2 (IV) catalysts clearly indicates an increase of the BET surface area.
Table 1 lists the most important textural parameters calculated from the isotherms and XRD patterns of the as-prepared nanomaterials. In Table 1, magnesia–silica mixed oxides have surface areas (BET area) in the range of 29–204 m2 g−1. However, the MgO–SiO2 mixed oxides have higher surface areas than bare silica. The specific surface area of pure MgO (111 m2 g−1) is also larger than the commercial MgO (95 m2 g−1). From Table 1, one can see that the different preparation methods and compositions have a remarkable effect on the specific surface area in binary MgO–SiO2 and the samples prepared by the wet-kneading method generally possess higher surface area. The observed volcano-like behavior in surface area may be associated with the varying extent of the interactions between the SiO2 and MgO phases. Notably, the catalysts with various molar ratios prepared by the wet-kneading method displayed a volcano trend, giving the highest specific surface area at MgO![[thin space (1/6-em)]](https://www.rsc.org/images/entities/char_2009.gif) :
:![[thin space (1/6-em)]](https://www.rsc.org/images/entities/char_2009.gif) SiO2 = 65
SiO2 = 65![[thin space (1/6-em)]](https://www.rsc.org/images/entities/char_2009.gif) :
:![[thin space (1/6-em)]](https://www.rsc.org/images/entities/char_2009.gif) 35. The decrease in the surface area and pore volume is also explained by a partial covering of the external MgO surface by SiO2 particles resulting in a partial pore blockage. It is important to note that the average crystallite sizes of the MgO calculated by Scherrer's equation based on the peak of (200) followed a similar but reversed volcano-like behavior by variation of the magnesia/silica content in the magnesia–silica materials, agreeing well with the BET area results. As can also be seen in Table 1, the wet-kneading synthesized catalyst shows the highest surface area and pore volume. Overall, the enhanced large specific surface area and unique mesoporous structure would be more favorable for adsorption and mass transport, which are beneficial for high catalytic performance.
35. The decrease in the surface area and pore volume is also explained by a partial covering of the external MgO surface by SiO2 particles resulting in a partial pore blockage. It is important to note that the average crystallite sizes of the MgO calculated by Scherrer's equation based on the peak of (200) followed a similar but reversed volcano-like behavior by variation of the magnesia/silica content in the magnesia–silica materials, agreeing well with the BET area results. As can also be seen in Table 1, the wet-kneading synthesized catalyst shows the highest surface area and pore volume. Overall, the enhanced large specific surface area and unique mesoporous structure would be more favorable for adsorption and mass transport, which are beneficial for high catalytic performance.
| Samplesa | S BET (m2 g−1) | V p (cm3 g−1) | D p (nm) | Crystallite sizec (nm) |
|---|---|---|---|---|
a MgO–SiO2 catalysts with various MgO![[thin space (1/6-em)]](https://www.rsc.org/images/entities/char_2009.gif) : :![[thin space (1/6-em)]](https://www.rsc.org/images/entities/char_2009.gif) SiO2 molar ratios prepared by different methods.
b Prepared by wet-kneading.
c MgO crystallite size. SiO2 molar ratios prepared by different methods.
b Prepared by wet-kneading.
c MgO crystallite size.
|
||||
| MgO | 111 | 0.44 | 14.0 | 24 |
MgO![[thin space (1/6-em)]](https://www.rsc.org/images/entities/char_2009.gif) : :![[thin space (1/6-em)]](https://www.rsc.org/images/entities/char_2009.gif) SiO2 = 95 SiO2 = 95![[thin space (1/6-em)]](https://www.rsc.org/images/entities/char_2009.gif) : :![[thin space (1/6-em)]](https://www.rsc.org/images/entities/char_2009.gif) 5b 5b |
142 | 0.89 | 18.1 | 23 |
MgO![[thin space (1/6-em)]](https://www.rsc.org/images/entities/char_2009.gif) : :![[thin space (1/6-em)]](https://www.rsc.org/images/entities/char_2009.gif) SiO2 = 85 SiO2 = 85![[thin space (1/6-em)]](https://www.rsc.org/images/entities/char_2009.gif) : :![[thin space (1/6-em)]](https://www.rsc.org/images/entities/char_2009.gif) 15b 15b |
171 | 0.56 | 11.0 | 22 |
MgO![[thin space (1/6-em)]](https://www.rsc.org/images/entities/char_2009.gif) : :![[thin space (1/6-em)]](https://www.rsc.org/images/entities/char_2009.gif) SiO2 = 75 SiO2 = 75![[thin space (1/6-em)]](https://www.rsc.org/images/entities/char_2009.gif) : :![[thin space (1/6-em)]](https://www.rsc.org/images/entities/char_2009.gif) 25b 25b |
165 | 0.55 | 10.9 | 22 |
MgO![[thin space (1/6-em)]](https://www.rsc.org/images/entities/char_2009.gif) : :![[thin space (1/6-em)]](https://www.rsc.org/images/entities/char_2009.gif) SiO2 = 65 SiO2 = 65![[thin space (1/6-em)]](https://www.rsc.org/images/entities/char_2009.gif) : :![[thin space (1/6-em)]](https://www.rsc.org/images/entities/char_2009.gif) 35b 35b |
204 | 0.60 | 9.4 | 21 |
MgO-C![[thin space (1/6-em)]](https://www.rsc.org/images/entities/char_2009.gif) : :![[thin space (1/6-em)]](https://www.rsc.org/images/entities/char_2009.gif) SiO2 = 65 SiO2 = 65![[thin space (1/6-em)]](https://www.rsc.org/images/entities/char_2009.gif) : :![[thin space (1/6-em)]](https://www.rsc.org/images/entities/char_2009.gif) 35b 35b |
185 | 0.46 | 6.6 | 21 |
MgO![[thin space (1/6-em)]](https://www.rsc.org/images/entities/char_2009.gif) : :![[thin space (1/6-em)]](https://www.rsc.org/images/entities/char_2009.gif) SiO2 = 50 SiO2 = 50![[thin space (1/6-em)]](https://www.rsc.org/images/entities/char_2009.gif) : :![[thin space (1/6-em)]](https://www.rsc.org/images/entities/char_2009.gif) 50b 50b |
70 | 0.28 | 11.2 | 24 |
| SiO2 | 11 | 0.04 | 20.4 | — |
| MgO–SiO2 (I) | 56 | 0.29 | 19 | 30 |
| MgO–SiO2 (II) | 147 | 0.30 | 7.2 | 36 |
| MgO–SiO2 (III) | 29 | 0.11 | 12.0 | 42 |
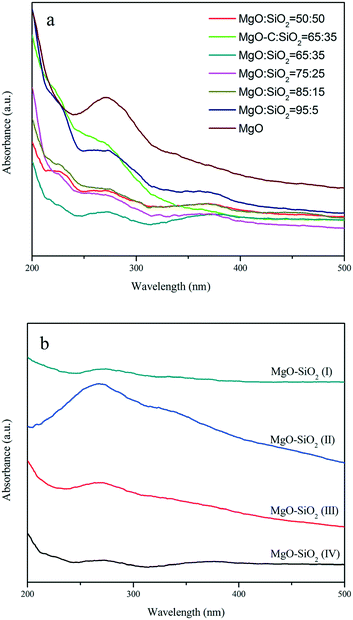
The UV-vis diffuse reflectance spectra of MgO, the MgO–SiO2 samples with different molar ratios and the MgO–SiO2 catalysts prepared by different methods are shown in Fig. 4. As shown in Fig. 4(a), the spectra of MgO–SiO2 catalysts reveal two characteristic bands at 230 and 280 nm. According to Coluccia et al.,45 the observed absorption bands at 230 and 274 nm of MgO were assignable to the ligand-to-metal charge transfer from four-coordinated (edge) and three-coordinated (corner) O2− ions to Mg2+ based on the study of several MgO samples. The change in the relative intensity of the two bands at 230 and 280 nm are so pronounced, indicating that the formation of a Si–O–Mg species assignable at 260 nm has to be taken into account via MgO and SiO2 interactions.34,39
The FT-IR transmission spectra of the various samples were investigated in order to collect information on the structural features of the magnesia–silica samples and to assess the nature of the interactions of SiO2 with MgO. Fig. 5 presents the FT-IR spectra of magnesia–silica samples in the region of 4000–400 cm−1. Fig. 5(a) depicts the FT-IR transmission spectra of bare MgO, SiO2, the samples with different MgO–SiO2 molar ratios and MgO-C–SiO2. The FT-IR spectra of bare MgO and SiO2 samples were similar to that reported in the literature.46 The band at 1636 cm−1 can be assigned to the bending vibration of the water molecules. The broad band at 3400 cm−1 belongs to the stretching vibrations of the hydroxyl groups of water physically adsorbed on the surface.47,48,51 The bulk MgO has an IR band at 3700 cm−1 that is attributed to vibration of Mg(OH)2, which was formed by MgO and water vapour reacting in air.46 The small feature at around 3745 cm−1 can be assigned to the surface silanol groups, which appear to interact weakly with adsorbed water over the silica surface, according to the literature.49–51 Three obvious sharp absorption bands at 1100 cm−1, 1010 cm−1 and 796 cm−1 can be assigned to the asymmetric Si–O–Si stretching mode,44 and the Mg–O stretching vibration at 680 cm−1,52 respectively. Kneading MgO with SiO2 broadens the band at ∼1100 cm−1 and 1010 cm−1 due to the decrease of the silica content in MgO–SiO2 compared to the parent silica, accompanied with the down-shift of Si–O–Si bands to a lower wave number, indicative of the strengthened interaction between MgO and SiO2, preferentially generating a Si–O–Mg linkage.53 It is worthwhile to note that the absorption band located at 470 cm−1 characteristic for the stretching vibration of Si–O–Mg bonds54–57 was found over the wet-kneaded composite samples. From Fig. 5(a), one can also see that the increase of the magnesium oxide content of the magnesia–silica composite catalysts results in a decreased intensity of the surface silanol groups, compared to the parent silica.
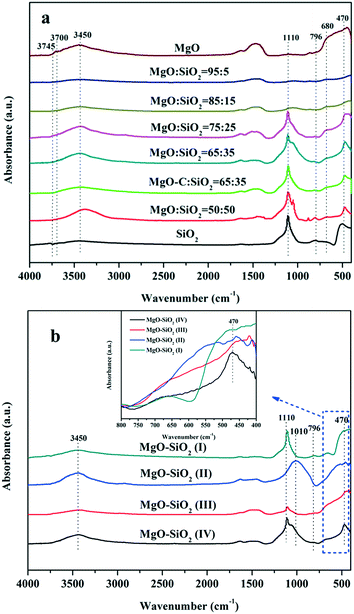 | ||
Fig. 5 FTIR spectra of the as-obtained MgO–SiO2 samples (a) with various molar ratios, and (b) the various MgO![[thin space (1/6-em)]](https://www.rsc.org/images/entities/char_2009.gif) : :![[thin space (1/6-em)]](https://www.rsc.org/images/entities/char_2009.gif) SiO2 catalysts (all with molar ratio 65 SiO2 catalysts (all with molar ratio 65![[thin space (1/6-em)]](https://www.rsc.org/images/entities/char_2009.gif) : :![[thin space (1/6-em)]](https://www.rsc.org/images/entities/char_2009.gif) 35) by different preparation methods. 35) by different preparation methods. | ||
All catalysts prepared via different methods show the similar bands as discussed above, albeit with different relative intensities (Fig. 5(b)). The presence of the band at 470 cm−1 was observed on the spectra of sol–gel and wet-kneaded materials, whereas the catalysts prepared by the physical mixture and incipient wetness impregnation exhibited the absence of this fingerprint of Si–O–Mg vibrations. Using magnesium acetate as the precursor for MgO–SiO2 catalysts leads to the preferential formation of the Si–O–Mg chemical bond during the heating process (compared with the MgO-C–SiO2) and thereby reinforces the interaction of MgO and SiO2.53
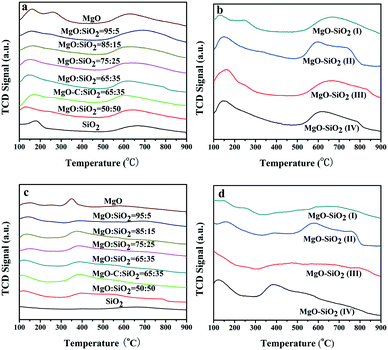
To better understand the intrinsic acid–base functionalities and correlate the catalysts with their interesting catalytic behavior, NH3- and CO2-TPD measurements were performed to quantitatively determine the distribution of surface acidity and basicity and the number of acidic and basic sites of MgO–SiO2 catalysts. All the results are summarised in Tables 2 and 3. As shown in Fig. 6(a), bare MgO displayed three desorption peaks of NH3 centered at 130, 250, and 630 °C, corresponding to weak, moderate, and strong acidic sites, respectively, while the acidic site with medium strength was diminished by SiO2 addition. The NH3-TPD profiles of MgO–SiO2 composites with different molar ratios show two broad peaks of NH3 desorption at a maximum desorption temperature below 200 °C and above 600 °C for all catalysts. The maximum desorption temperature of NH3 over MgO–SiO2 at low temperatures shifted from 132 to 147, 153, 168, and 158 °C with increasing MgO content, indicating that weak acidities vary with MgO addition. Similar results have been observed in the previous reports.42
| Samplesa | Number of acidic sites (cm3 g−1) | |||
|---|---|---|---|---|
| Total sites (Ta) | Weak sites | Moderate sites | Strong sites | |
a MgO–SiO2 catalysts with various MgO![[thin space (1/6-em)]](https://www.rsc.org/images/entities/char_2009.gif) : :![[thin space (1/6-em)]](https://www.rsc.org/images/entities/char_2009.gif) SiO2 molar ratios prepared by different methods.
b Prepared by wet-kneading.
c ND – not detected. SiO2 molar ratios prepared by different methods.
b Prepared by wet-kneading.
c ND – not detected.
|
||||
MgO![[thin space (1/6-em)]](https://www.rsc.org/images/entities/char_2009.gif) : :![[thin space (1/6-em)]](https://www.rsc.org/images/entities/char_2009.gif) SiO2 = 95 SiO2 = 95![[thin space (1/6-em)]](https://www.rsc.org/images/entities/char_2009.gif) : :![[thin space (1/6-em)]](https://www.rsc.org/images/entities/char_2009.gif) 5b 5b |
114.8 | 48.3 | NDc | 66.5 |
MgO![[thin space (1/6-em)]](https://www.rsc.org/images/entities/char_2009.gif) : :![[thin space (1/6-em)]](https://www.rsc.org/images/entities/char_2009.gif) SiO2 = 85 SiO2 = 85![[thin space (1/6-em)]](https://www.rsc.org/images/entities/char_2009.gif) : :![[thin space (1/6-em)]](https://www.rsc.org/images/entities/char_2009.gif) 15b 15b |
121.6 | 60.4 | NDc | 61.2 |
MgO![[thin space (1/6-em)]](https://www.rsc.org/images/entities/char_2009.gif) : :![[thin space (1/6-em)]](https://www.rsc.org/images/entities/char_2009.gif) SiO2 = 75 SiO2 = 75![[thin space (1/6-em)]](https://www.rsc.org/images/entities/char_2009.gif) : :![[thin space (1/6-em)]](https://www.rsc.org/images/entities/char_2009.gif) 25b 25b |
122.2 | 63.9 | NDc | 58.3 |
MgO![[thin space (1/6-em)]](https://www.rsc.org/images/entities/char_2009.gif) : :![[thin space (1/6-em)]](https://www.rsc.org/images/entities/char_2009.gif) SiO2 = 65 SiO2 = 65![[thin space (1/6-em)]](https://www.rsc.org/images/entities/char_2009.gif) : :![[thin space (1/6-em)]](https://www.rsc.org/images/entities/char_2009.gif) 35b 35b |
133.8 | 76.9 | NDc | 56.9 |
MgO-C![[thin space (1/6-em)]](https://www.rsc.org/images/entities/char_2009.gif) : :![[thin space (1/6-em)]](https://www.rsc.org/images/entities/char_2009.gif) SiO2 = 65 SiO2 = 65![[thin space (1/6-em)]](https://www.rsc.org/images/entities/char_2009.gif) : :![[thin space (1/6-em)]](https://www.rsc.org/images/entities/char_2009.gif) 35b 35b |
105.3 | 52.5 | NDc | 52.8 |
MgO![[thin space (1/6-em)]](https://www.rsc.org/images/entities/char_2009.gif) : :![[thin space (1/6-em)]](https://www.rsc.org/images/entities/char_2009.gif) SiO2 = 50 SiO2 = 50![[thin space (1/6-em)]](https://www.rsc.org/images/entities/char_2009.gif) : :![[thin space (1/6-em)]](https://www.rsc.org/images/entities/char_2009.gif) 50b 50b |
95.1 | 49.6 | NDc | 45.5 |
| MgO–SiO2 (I) | 86.8 | 39.3 | NDc | 47.5 |
| MgO–SiO2 (II) | 148.6 | 79.6 | NDc | 69.0 |
| MgO–SiO2 (III) | 102.4 | 50.6 | NDc | 56.8 |
| Samplesa | Number of basic sites (cm3 g−1) | ||||
|---|---|---|---|---|---|
| Total sites (Tb) | Weak sites | Moderate sites | Strong sites | T b/Ta | |
a MgO–SiO2 catalysts with various MgO![[thin space (1/6-em)]](https://www.rsc.org/images/entities/char_2009.gif) : :![[thin space (1/6-em)]](https://www.rsc.org/images/entities/char_2009.gif) SiO2 molar ratios prepared by different methods.
b Prepared by wet-kneading. Ta = total acidic sites; Tb = total basic sites. SiO2 molar ratios prepared by different methods.
b Prepared by wet-kneading. Ta = total acidic sites; Tb = total basic sites.
|
|||||
MgO![[thin space (1/6-em)]](https://www.rsc.org/images/entities/char_2009.gif) : :![[thin space (1/6-em)]](https://www.rsc.org/images/entities/char_2009.gif) SiO2 = 95 SiO2 = 95![[thin space (1/6-em)]](https://www.rsc.org/images/entities/char_2009.gif) : :![[thin space (1/6-em)]](https://www.rsc.org/images/entities/char_2009.gif) 5b 5b |
41.9 | 9.9 | 18.9 | 13.1 | 0.37 |
MgO![[thin space (1/6-em)]](https://www.rsc.org/images/entities/char_2009.gif) : :![[thin space (1/6-em)]](https://www.rsc.org/images/entities/char_2009.gif) SiO2 = 85 SiO2 = 85![[thin space (1/6-em)]](https://www.rsc.org/images/entities/char_2009.gif) : :![[thin space (1/6-em)]](https://www.rsc.org/images/entities/char_2009.gif) 15b 15b |
41.5 | 14.3 | 18.9 | 8.3 | 0.34 |
MgO![[thin space (1/6-em)]](https://www.rsc.org/images/entities/char_2009.gif) : :![[thin space (1/6-em)]](https://www.rsc.org/images/entities/char_2009.gif) SiO2 = 75 SiO2 = 75![[thin space (1/6-em)]](https://www.rsc.org/images/entities/char_2009.gif) : :![[thin space (1/6-em)]](https://www.rsc.org/images/entities/char_2009.gif) 25b 25b |
36.5 | 11.9 | 17.0 | 7.6 | 0.30 |
MgO![[thin space (1/6-em)]](https://www.rsc.org/images/entities/char_2009.gif) : :![[thin space (1/6-em)]](https://www.rsc.org/images/entities/char_2009.gif) SiO2 = 65 SiO2 = 65![[thin space (1/6-em)]](https://www.rsc.org/images/entities/char_2009.gif) : :![[thin space (1/6-em)]](https://www.rsc.org/images/entities/char_2009.gif) 35b 35b |
34.8 | 11.4 | 12.8 | 10.6 | 0.26 |
MgO-C![[thin space (1/6-em)]](https://www.rsc.org/images/entities/char_2009.gif) : :![[thin space (1/6-em)]](https://www.rsc.org/images/entities/char_2009.gif) SiO2 = 65 SiO2 = 65![[thin space (1/6-em)]](https://www.rsc.org/images/entities/char_2009.gif) : :![[thin space (1/6-em)]](https://www.rsc.org/images/entities/char_2009.gif) 35b 35b |
35.3 | 10.3 | 16.8 | 8.2 | 0.34 |
MgO![[thin space (1/6-em)]](https://www.rsc.org/images/entities/char_2009.gif) : :![[thin space (1/6-em)]](https://www.rsc.org/images/entities/char_2009.gif) SiO2 = 50 SiO2 = 50![[thin space (1/6-em)]](https://www.rsc.org/images/entities/char_2009.gif) : :![[thin space (1/6-em)]](https://www.rsc.org/images/entities/char_2009.gif) 50b 50b |
30.0 | 9.9 | 10.8 | 9.3 | 0.32 |
| MgO–SiO2 (I) | 15.9 | 6.2 | 3.4 | 6.3 | 0.18 |
| MgO–SiO2 (II) | 26.8 | 9.9 | 3.9 | 13.0 | 0.18 |
| MgO–SiO2 (III) | 20.5 | 6.6 | 6.6 | 7.3 | 0.20 |
The amount of acidic sites of the various materials prepared via different methods was also investigated by NH3-TPD in Fig. 6(b). The NH3-TPD profiles obtained over the samples prepared by the physical mixture, incipient wetness impregnation and wet-kneading have similar desorption profiles at low temperature, evidencing the weak acidic sites. In addition, the NH3 desorption peaks for the sol–gel sample display a tailed peak on the higher temperature side, which corresponds to a stronger acid site. This is also in good agreement with the significantly increased ethylene and diethyl ether by-products over the sol–gel catalyst, as evidenced by a broadening of the NH3 desorption signal in the whole temperature range. In fact, the sol–gel method resulted in the formation of either forsterite or silica domains and led to a considerably enhanced total surface acidity, which gave rise to the preferred formation of ethylene.42 It indicates that the optimal catalyst for the one-pot ethanol transformation into butadiene process requires an intimate contact between the two components but not full mixing of them.35 The amounts of different acid sites and total acid sites are calculated from the NH3-TPD peak areas and illustrated in Table 2. The number of surface acid sites decreased in the order: MgO–SiO2 (II) > MgO–SiO2 (IV) > MgO–SiO2 (III) > MgO![[thin space (1/6-em)]](https://www.rsc.org/images/entities/char_2009.gif) :
:![[thin space (1/6-em)]](https://www.rsc.org/images/entities/char_2009.gif) SiO2 (I).
SiO2 (I).
The basicity measurements of MgO–SiO2 catalysts with different MgO loadings were carried out by the temperature-programmed desorption of CO2 (Fig. 6(c)). The TPD profiles contain three main CO2 desorption peaks, which can be attributed to the weak, moderate, and strong basic surface sites. As shown in Fig. 6(c), the temperature of maximum CO2 desorption was generally shifted toward higher temperatures, indicating that the proportion of stronger basic sites on the surface increased gradually with decreasing MgO contents. Fig. 6(d) illustrates the CO2-TPD of MgO–SiO2 catalysts prepared by different methods. The basicity of MgO–SiO2 catalysts and the basicity/acidity ratio calculated from the CO2-TPD and NH3-TPD peak areas are also summarized in Table 3. The sol–gel catalyst showed a greater acidity than the others, in terms of acid sites and strength. Clearly, the wet-kneaded MgO–SiO2 samples presented a remarkably higher basicity/acidity ratio than the catalysts prepared by other methods, regardless of the MgO![[thin space (1/6-em)]](https://www.rsc.org/images/entities/char_2009.gif) :
:![[thin space (1/6-em)]](https://www.rsc.org/images/entities/char_2009.gif) SiO2 ratios employed. The number of basic sites varies in the order: MgO–SiO2 (IV) > MgO–SiO2 (II) > MgO–SiO2 (III) > MgO
SiO2 ratios employed. The number of basic sites varies in the order: MgO–SiO2 (IV) > MgO–SiO2 (II) > MgO–SiO2 (III) > MgO![[thin space (1/6-em)]](https://www.rsc.org/images/entities/char_2009.gif) :
:![[thin space (1/6-em)]](https://www.rsc.org/images/entities/char_2009.gif) SiO2 (I). It should be noted that the trend of basicity and MgO
SiO2 (I). It should be noted that the trend of basicity and MgO![[thin space (1/6-em)]](https://www.rsc.org/images/entities/char_2009.gif) :
:![[thin space (1/6-em)]](https://www.rsc.org/images/entities/char_2009.gif) SiO2 ratio variation were almost consistent with the trend of catalytic performance of MgO–SiO2 catalysts (see below). The result indicates that wet-kneading method may give samples that possess much more abundant basic sites on the catalyst's surface.
SiO2 ratio variation were almost consistent with the trend of catalytic performance of MgO–SiO2 catalysts (see below). The result indicates that wet-kneading method may give samples that possess much more abundant basic sites on the catalyst's surface.
3.2. Catalytic test for 1,3-butadiene production from ethanol
In order to understand the relationship between the structure and activity, the effect of reaction temperature on the product distribution was investigated over MgO–SiO2 and MgO-C–SiO2 (molar ratio = 65![[thin space (1/6-em)]](https://www.rsc.org/images/entities/char_2009.gif) :
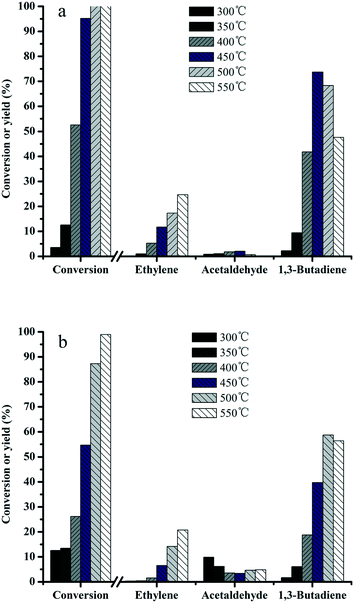
:![[thin space (1/6-em)]](https://www.rsc.org/images/entities/char_2009.gif) 35) composite catalysts. It can be seen from Fig. 7a that the ethanol conversions increase with increasing temperature over MgO–SiO2, while the product distributions are found to be dependent on the reaction temperature. A significant increase of the butadiene yield was obtained by increasing the temperature from 300 to 450 °C. When increase of the reaction temperature is continued above 450 °C, the butadiene yield started to decline. In contrast, the MgO-C–SiO2 with the same composition shows quite low activity at relatively low temperatures (Fig. 7b), indicating its limited ability to catalyze the conversion of ethanol into BD reaction under mild conditions. The acetaldehyde yield remains in a very low level even in the temperature range investigated. Ethylene was found as the main by-product and its yield increased dramatically as the reaction temperature increased, indicating that higher temperatures facilitated the dehydration activity of this catalyst and resulted in a high ethylene yield.2,39 More importantly, as a major desired product, an exceptional high yield of 73% for 1,3-butadiene was achieved at 450 °C, while the highest yield of acetaldehyde was obtained, which was similar to the previous work58 (Fig. 7a). As shown in Fig. 7, the results revealed the catalytic activities obtained by the MgO–SiO2 catalyst are much better than that of the MgO-C–SiO2 catalyst in terms of the BD yield, indicating that the catalyst using the hydrothermal-derived MgO, which possesses more active sites than the commercial MgO, and consequently higher catalytic activity, is more favorable for BD production. The conversion of the ethanol over MgO–SiO2 (MgO
35) composite catalysts. It can be seen from Fig. 7a that the ethanol conversions increase with increasing temperature over MgO–SiO2, while the product distributions are found to be dependent on the reaction temperature. A significant increase of the butadiene yield was obtained by increasing the temperature from 300 to 450 °C. When increase of the reaction temperature is continued above 450 °C, the butadiene yield started to decline. In contrast, the MgO-C–SiO2 with the same composition shows quite low activity at relatively low temperatures (Fig. 7b), indicating its limited ability to catalyze the conversion of ethanol into BD reaction under mild conditions. The acetaldehyde yield remains in a very low level even in the temperature range investigated. Ethylene was found as the main by-product and its yield increased dramatically as the reaction temperature increased, indicating that higher temperatures facilitated the dehydration activity of this catalyst and resulted in a high ethylene yield.2,39 More importantly, as a major desired product, an exceptional high yield of 73% for 1,3-butadiene was achieved at 450 °C, while the highest yield of acetaldehyde was obtained, which was similar to the previous work58 (Fig. 7a). As shown in Fig. 7, the results revealed the catalytic activities obtained by the MgO–SiO2 catalyst are much better than that of the MgO-C–SiO2 catalyst in terms of the BD yield, indicating that the catalyst using the hydrothermal-derived MgO, which possesses more active sites than the commercial MgO, and consequently higher catalytic activity, is more favorable for BD production. The conversion of the ethanol over MgO–SiO2 (MgO![[thin space (1/6-em)]](https://www.rsc.org/images/entities/char_2009.gif) :
:![[thin space (1/6-em)]](https://www.rsc.org/images/entities/char_2009.gif) SiO2 = 65
SiO2 = 65![[thin space (1/6-em)]](https://www.rsc.org/images/entities/char_2009.gif) :
:![[thin space (1/6-em)]](https://www.rsc.org/images/entities/char_2009.gif) 35) reaches the ethanol conversion of 95% and the selectivity to BD is 77% at 450 °C, which are considerably better than the results of the MgO-C–SiO2 under the same reaction conditions. The reasons for this could stem from not only an increase of the MgO surface area and enhanced MgO and SiO2 interactions but also an appropriate balance of acid–base sites formed on the MgO–SiO2 catalyst surface. In addition, hierarchical flower-like structured MgO provides a significantly larger active surface area and the rugged surface can favor mass transport and consequently higher catalytic performance.59,60
35) reaches the ethanol conversion of 95% and the selectivity to BD is 77% at 450 °C, which are considerably better than the results of the MgO-C–SiO2 under the same reaction conditions. The reasons for this could stem from not only an increase of the MgO surface area and enhanced MgO and SiO2 interactions but also an appropriate balance of acid–base sites formed on the MgO–SiO2 catalyst surface. In addition, hierarchical flower-like structured MgO provides a significantly larger active surface area and the rugged surface can favor mass transport and consequently higher catalytic performance.59,60
Fig. 8 shows the performance of various MgO–SiO2 catalysts for the conversion of ethanol to butadiene. Compared with the negligible ethanol conversion of bare SiO2 (results not shown), the addition of MgO improves the catalytic performance significantly. With the increase of the MgO content, the conversion of ethanol rises from 78 to 100%, except the MgO![[thin space (1/6-em)]](https://www.rsc.org/images/entities/char_2009.gif) :
:![[thin space (1/6-em)]](https://www.rsc.org/images/entities/char_2009.gif) SiO2 = 95
SiO2 = 95![[thin space (1/6-em)]](https://www.rsc.org/images/entities/char_2009.gif) :
:![[thin space (1/6-em)]](https://www.rsc.org/images/entities/char_2009.gif) 5 sample (decrease to 73%). Variation of the Mg/Si ratio in a series of wet-kneaded samples showed a volcano-type dependence of the butadiene yield on the MgO content. The yield of butadiene showed the maximum value when the MgO
5 sample (decrease to 73%). Variation of the Mg/Si ratio in a series of wet-kneaded samples showed a volcano-type dependence of the butadiene yield on the MgO content. The yield of butadiene showed the maximum value when the MgO![[thin space (1/6-em)]](https://www.rsc.org/images/entities/char_2009.gif) :
:![[thin space (1/6-em)]](https://www.rsc.org/images/entities/char_2009.gif) SiO2 molar ratio was 65
SiO2 molar ratio was 65![[thin space (1/6-em)]](https://www.rsc.org/images/entities/char_2009.gif) :
:![[thin space (1/6-em)]](https://www.rsc.org/images/entities/char_2009.gif) 35. The presence of the MgO phase in the catalyst gives rise to an increase in the basicity and the surface area of the catalyst (see above). This indicates that the MgO–SiO2 (molar ratio = 65
35. The presence of the MgO phase in the catalyst gives rise to an increase in the basicity and the surface area of the catalyst (see above). This indicates that the MgO–SiO2 (molar ratio = 65![[thin space (1/6-em)]](https://www.rsc.org/images/entities/char_2009.gif) :
:![[thin space (1/6-em)]](https://www.rsc.org/images/entities/char_2009.gif) 35) catalyst will give the optimum acidic and basic properties required for the formation of butadiene from ethanol.
35) catalyst will give the optimum acidic and basic properties required for the formation of butadiene from ethanol.
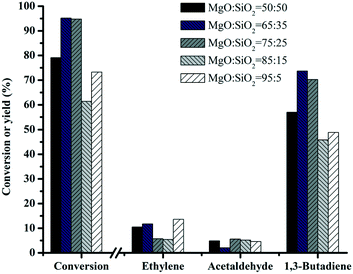 | ||
Fig. 8 Effect of catalyst composition on the catalytic performance of MgO![[thin space (1/6-em)]](https://www.rsc.org/images/entities/char_2009.gif) : :![[thin space (1/6-em)]](https://www.rsc.org/images/entities/char_2009.gif) SiO2. Conditions: 0.1 g of catalyst, ethanol (gas phase) molar fraction 5.79%, nitrogen flow 50 mL min−1, T = 450 °C. SiO2. Conditions: 0.1 g of catalyst, ethanol (gas phase) molar fraction 5.79%, nitrogen flow 50 mL min−1, T = 450 °C. | ||
To investigate the effects of the different preparation methods on butadiene production, four different synthesis methods were employed for preparing MgO![[thin space (1/6-em)]](https://www.rsc.org/images/entities/char_2009.gif) :
:![[thin space (1/6-em)]](https://www.rsc.org/images/entities/char_2009.gif) SiO2 catalysts and the results are shown in Fig. 9. The catalysts showed significant differences in the butadiene yield, decreasing in the order: MgO–SiO2 (IV) > MgO–SiO2 (III) > MgO–SiO2 (II) > MgO–SiO2 (I). The catalysts prepared by a physical mixture performed poorly, giving the similar conversion of ethanol and the yield of butadiene to the bare MgO (results not shown). It might be explained by the fact that the contact and interaction between MgO and SiO2 are critical for achievement of a high yield toward the butadiene. The sol–gel material showed the highest ethanol conversion and ethylene yield, suggesting that the dehydration of ethanol to ethylene is more favorable on the catalyst prepared by the sol–gel method, which could be associated with its considerably enhanced total surface acidity, compared to the other catalysts, in agreement with the NH3-TPD results.
SiO2 catalysts and the results are shown in Fig. 9. The catalysts showed significant differences in the butadiene yield, decreasing in the order: MgO–SiO2 (IV) > MgO–SiO2 (III) > MgO–SiO2 (II) > MgO–SiO2 (I). The catalysts prepared by a physical mixture performed poorly, giving the similar conversion of ethanol and the yield of butadiene to the bare MgO (results not shown). It might be explained by the fact that the contact and interaction between MgO and SiO2 are critical for achievement of a high yield toward the butadiene. The sol–gel material showed the highest ethanol conversion and ethylene yield, suggesting that the dehydration of ethanol to ethylene is more favorable on the catalyst prepared by the sol–gel method, which could be associated with its considerably enhanced total surface acidity, compared to the other catalysts, in agreement with the NH3-TPD results.
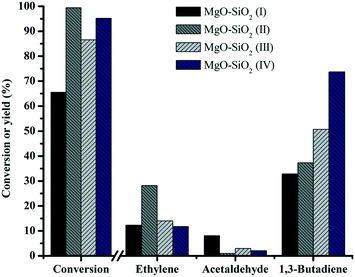 | ||
Fig. 9 Effect of the catalyst preparation method on catalytic performance of MgO![[thin space (1/6-em)]](https://www.rsc.org/images/entities/char_2009.gif) : :![[thin space (1/6-em)]](https://www.rsc.org/images/entities/char_2009.gif) SiO2. Conditions: 0.1 g of catalyst, ethanol (gas phase) molar fraction 5.79%, nitrogen flow 50 mL min−1, T = 450 °C. SiO2. Conditions: 0.1 g of catalyst, ethanol (gas phase) molar fraction 5.79%, nitrogen flow 50 mL min−1, T = 450 °C. | ||
The catalytic activity over the MgO![[thin space (1/6-em)]](https://www.rsc.org/images/entities/char_2009.gif) :
:![[thin space (1/6-em)]](https://www.rsc.org/images/entities/char_2009.gif) SiO2 (molar ratio = 65
SiO2 (molar ratio = 65![[thin space (1/6-em)]](https://www.rsc.org/images/entities/char_2009.gif) :
:![[thin space (1/6-em)]](https://www.rsc.org/images/entities/char_2009.gif) 35) catalyst is shown as a function of weight hourly space velocity (WHSV) in Fig. 10. As the contact time decreases, the conversion of ethanol progressively decreases, accompanied by the decreased selectivity to ethylene and a concomitant increase of selectivity to butadiene and acetaldehyde. Acetaldehyde is the primary product of ethanol dehydrogenation over the basic MgO sites. It also can be seen that the 1,3-BD productivity values rapidly increase as the contact time decreases and an exceptionally high space time butadiene yield of 0.025 mol gcat−1 h−1 was achieved at 450 °C with the WHSV of 4.1 h−1. To the best of our knowledge, the highest BD yield of 0.71 gBD gcat−1 h−1 (0.013 mol gcat−1 h−1) so far obtained from the one-pot conversion of bio-ethanol ever in the literature records was achieved by Larina et al. with a BD selectivity of 60.2% and complete ethanol conversion, over a quaternary Zn–La–Zr–Si catalyst operating at 400 °C and a WHSV of 2 h−1.61 A very recent publication by Lee et al. investigated the use of Cu/MCF and Zr/MCF and these were separately loaded into two fixed bed reactors for the conversion of ethanol to BD, achieving the BD selectivity of 73% with an ethanol conversion of 96% at 400 °C and a WHSV of 3.7 h−1 and the productivity of 1.4 gBD gcat−1 h−1 (0.025 mol gcat−1 h−1).62 Clearly, our catalytic system performs even better in terms of BD productivity than the above results, suggesting that our as-prepared material is a promising catalyst for 1,3-BD production.
35) catalyst is shown as a function of weight hourly space velocity (WHSV) in Fig. 10. As the contact time decreases, the conversion of ethanol progressively decreases, accompanied by the decreased selectivity to ethylene and a concomitant increase of selectivity to butadiene and acetaldehyde. Acetaldehyde is the primary product of ethanol dehydrogenation over the basic MgO sites. It also can be seen that the 1,3-BD productivity values rapidly increase as the contact time decreases and an exceptionally high space time butadiene yield of 0.025 mol gcat−1 h−1 was achieved at 450 °C with the WHSV of 4.1 h−1. To the best of our knowledge, the highest BD yield of 0.71 gBD gcat−1 h−1 (0.013 mol gcat−1 h−1) so far obtained from the one-pot conversion of bio-ethanol ever in the literature records was achieved by Larina et al. with a BD selectivity of 60.2% and complete ethanol conversion, over a quaternary Zn–La–Zr–Si catalyst operating at 400 °C and a WHSV of 2 h−1.61 A very recent publication by Lee et al. investigated the use of Cu/MCF and Zr/MCF and these were separately loaded into two fixed bed reactors for the conversion of ethanol to BD, achieving the BD selectivity of 73% with an ethanol conversion of 96% at 400 °C and a WHSV of 3.7 h−1 and the productivity of 1.4 gBD gcat−1 h−1 (0.025 mol gcat−1 h−1).62 Clearly, our catalytic system performs even better in terms of BD productivity than the above results, suggesting that our as-prepared material is a promising catalyst for 1,3-BD production.
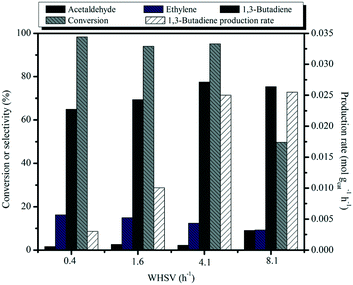 | ||
Fig. 10 Effect of WHSV on catalytic activity of MgO![[thin space (1/6-em)]](https://www.rsc.org/images/entities/char_2009.gif) : :![[thin space (1/6-em)]](https://www.rsc.org/images/entities/char_2009.gif) SiO2 and 1,3-butadiene productivity. Conditions: 0.1 g of catalyst, ethanol (gas phase) molar fraction 5.79%, T = 450 °C. SiO2 and 1,3-butadiene productivity. Conditions: 0.1 g of catalyst, ethanol (gas phase) molar fraction 5.79%, T = 450 °C. | ||
The catalytic stability of the MgO![[thin space (1/6-em)]](https://www.rsc.org/images/entities/char_2009.gif) :
:![[thin space (1/6-em)]](https://www.rsc.org/images/entities/char_2009.gif) SiO2 (molar ratio = 65
SiO2 (molar ratio = 65![[thin space (1/6-em)]](https://www.rsc.org/images/entities/char_2009.gif) :
:![[thin space (1/6-em)]](https://www.rsc.org/images/entities/char_2009.gif) 35) catalyst was investigated as a function of time on stream, with butadiene as the main product and ethylene and acetaldehyde as the major by-products, as depicted in Fig. 11. Once the stream entered the reactor, the MgO
35) catalyst was investigated as a function of time on stream, with butadiene as the main product and ethylene and acetaldehyde as the major by-products, as depicted in Fig. 11. Once the stream entered the reactor, the MgO![[thin space (1/6-em)]](https://www.rsc.org/images/entities/char_2009.gif) :
:![[thin space (1/6-em)]](https://www.rsc.org/images/entities/char_2009.gif) SiO2 (molar ratio = 65
SiO2 (molar ratio = 65![[thin space (1/6-em)]](https://www.rsc.org/images/entities/char_2009.gif) :
:![[thin space (1/6-em)]](https://www.rsc.org/images/entities/char_2009.gif) 35) catalyst started to be activated and reach the maximum ethanol conversion of 95%, followed by a slow deactivation thereafter, and the selectivity for butadiene declined with decreasing ethanol conversion. In addition to butadiene, the selectivity for ethylene and acetaldehyde increased with the decreasing butadiene yield, indicating that the mitigated butadiene yield is due to the gradual covering of surface active sites by coke deposition. After the 42 h on stream test, wet-kneaded MgO
35) catalyst started to be activated and reach the maximum ethanol conversion of 95%, followed by a slow deactivation thereafter, and the selectivity for butadiene declined with decreasing ethanol conversion. In addition to butadiene, the selectivity for ethylene and acetaldehyde increased with the decreasing butadiene yield, indicating that the mitigated butadiene yield is due to the gradual covering of surface active sites by coke deposition. After the 42 h on stream test, wet-kneaded MgO![[thin space (1/6-em)]](https://www.rsc.org/images/entities/char_2009.gif) :
:![[thin space (1/6-em)]](https://www.rsc.org/images/entities/char_2009.gif) SiO2 (65
SiO2 (65![[thin space (1/6-em)]](https://www.rsc.org/images/entities/char_2009.gif) :
:![[thin space (1/6-em)]](https://www.rsc.org/images/entities/char_2009.gif) 35) still exhibited 51% ethanol conversion and 49% of butadiene selectivity.
35) still exhibited 51% ethanol conversion and 49% of butadiene selectivity.
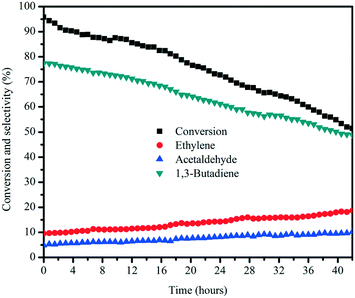 | ||
Fig. 11 Stability test of the MgO![[thin space (1/6-em)]](https://www.rsc.org/images/entities/char_2009.gif) : :![[thin space (1/6-em)]](https://www.rsc.org/images/entities/char_2009.gif) SiO2 (molar ratio = 65 SiO2 (molar ratio = 65![[thin space (1/6-em)]](https://www.rsc.org/images/entities/char_2009.gif) : :![[thin space (1/6-em)]](https://www.rsc.org/images/entities/char_2009.gif) 35) catalyst. Conditions: 0.1 g of catalyst, ethanol (gas phase) molar fraction 5.79%, nitrogen flow 50 mL min−1, T = 450 °C. 35) catalyst. Conditions: 0.1 g of catalyst, ethanol (gas phase) molar fraction 5.79%, nitrogen flow 50 mL min−1, T = 450 °C. | ||
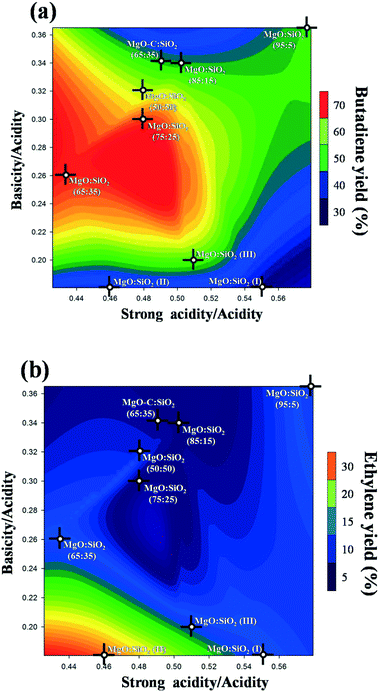
As documented in the literature, it was generally accepted that balanced acidic/basic sites on the catalyst surface are important to achieve a high yield of butadiene from ethanol. Therefore, the effect of total basicity/total acidity and strong acidity/total acidity on the butadiene yield is shown as a three-dimensional contour plot in Fig. 12a. This plot is very practically useful to understand the interaction and effects of different factors on the response. As can be clearly seen from Fig. 12a, an appropriate balance of surface acid/base sites is essential to obtain a high butadiene yield, based on the statistics of all samples employed. Notably, a relatively high butadiene yield was observed on the MgO![[thin space (1/6-em)]](https://www.rsc.org/images/entities/char_2009.gif) :
:![[thin space (1/6-em)]](https://www.rsc.org/images/entities/char_2009.gif) SiO2 catalyst with a moderate total basicity/total acidity ratio in the range of 0.24–0.3 and a strong acidity/total acidity ratio in the range of 0.46–0.5. This also indicates that a small amount of basic sites and an intermediate density of strong acid sites are the favorable conditions to achieve a higher yield of butadiene. In the literature, the preparation method of these MgO–SiO2 composite catalysts has been observed to be of pivotal importance for catalytic performance.34 This is indeed also observed in the case of our study. From Fig. 12a, it is found that the catalyst prepared by the sol–gel method, incipient wetness impregnation, and physical mixing show much stronger surface acidity than the samples prepared by wet-kneading, as evidenced by their significantly lower values of the surface basicity/acidity ratio, and lower catalytic activity than the wet-kneaded materials. The reason for this phenomenon may be due to the fact that the basic sites provided by MgO favor the dehydrogenation of ethanol and lead to the predominant formation of acetaldehyde,22 whereas the acid sites on the catalyst surface contribute mainly on ethanol dehydration to ethylene. In this sense, a subtle balance of surface basicity and acidity is necessary to achieve the first base-catalyzed dehydrogenation of ethanol to acetaldehyde and aldol condensation, and a follow-up acid-catalyzed dehydration. As a major by-product, the ethylene yield was also three-dimensionally contour plotted in Fig. 12b. As shown in Fig. 12b, the increased ratio of the weak acidity to the total acidity was beneficial to the catalytic dehydration of ethanol to ethylene, indicating that ethanol dehydration is more sensitive to the weak acidic sites. This interpretation is consistent with some recent literature reports.63–65
SiO2 catalyst with a moderate total basicity/total acidity ratio in the range of 0.24–0.3 and a strong acidity/total acidity ratio in the range of 0.46–0.5. This also indicates that a small amount of basic sites and an intermediate density of strong acid sites are the favorable conditions to achieve a higher yield of butadiene. In the literature, the preparation method of these MgO–SiO2 composite catalysts has been observed to be of pivotal importance for catalytic performance.34 This is indeed also observed in the case of our study. From Fig. 12a, it is found that the catalyst prepared by the sol–gel method, incipient wetness impregnation, and physical mixing show much stronger surface acidity than the samples prepared by wet-kneading, as evidenced by their significantly lower values of the surface basicity/acidity ratio, and lower catalytic activity than the wet-kneaded materials. The reason for this phenomenon may be due to the fact that the basic sites provided by MgO favor the dehydrogenation of ethanol and lead to the predominant formation of acetaldehyde,22 whereas the acid sites on the catalyst surface contribute mainly on ethanol dehydration to ethylene. In this sense, a subtle balance of surface basicity and acidity is necessary to achieve the first base-catalyzed dehydrogenation of ethanol to acetaldehyde and aldol condensation, and a follow-up acid-catalyzed dehydration. As a major by-product, the ethylene yield was also three-dimensionally contour plotted in Fig. 12b. As shown in Fig. 12b, the increased ratio of the weak acidity to the total acidity was beneficial to the catalytic dehydration of ethanol to ethylene, indicating that ethanol dehydration is more sensitive to the weak acidic sites. This interpretation is consistent with some recent literature reports.63–65
According to XRD and physisorption, the best performing catalyst consisting of the MgO![[thin space (1/6-em)]](https://www.rsc.org/images/entities/char_2009.gif) :
:![[thin space (1/6-em)]](https://www.rsc.org/images/entities/char_2009.gif) SiO2 ratio of 65
SiO2 ratio of 65![[thin space (1/6-em)]](https://www.rsc.org/images/entities/char_2009.gif) :
:![[thin space (1/6-em)]](https://www.rsc.org/images/entities/char_2009.gif) 35 has the smallest particle size and largest surface area, but a general correlation between activity and specific surface area was not established. FT-IR spectroscopy provided valuable information on the interaction of MgO and SiO2 on the as-prepared MgO-SiO2 composite catalysts. It is important to note the formation of a Si–O–Mg bond over the samples prepared by wet-kneading and the sol–gel method, and the absence of such a linkage over the catalysts prepared by the methods other than wet-kneading and the sol–gel method, indicating that the wet-kneading and the sol–gel method may well promote the interaction of the components and lead to the formation of Si–O–Mg chemical bonds. In a very recent study, Weckhuysen et al.37 highlighted the role of magnesium silicate in a wet-kneaded silica–magnesia catalyst and proposed that the formation of the magnesium silicate phase as the key for the ethanol to butadiene conversion. Nevertheless, the sol–gel catalyst having the magnesium silicate phase exhibited a rather poor activity in our study, implying that the formation of this magnesium silicate phase, prepared by us, may not be the decisive structural characteristic to achieve high catalytic performance. In view of the difference in catalytic activity and the physicochemical properties of the MgO–SiO2 composite catalysts, the catalytic activity is associated with the balanced surface acid/base sites in relation to the interfacial Si–O–Mg link caused by the strong interaction between MgO and SiO2. The explanation is expected to be useful implication for designing new acid–base multifunctional catalysts for the ethanol-to-butadiene process. However, how exactly the Si–O–Mg linkage affects the catalytic performance remains an open question for further investigations.
35 has the smallest particle size and largest surface area, but a general correlation between activity and specific surface area was not established. FT-IR spectroscopy provided valuable information on the interaction of MgO and SiO2 on the as-prepared MgO-SiO2 composite catalysts. It is important to note the formation of a Si–O–Mg bond over the samples prepared by wet-kneading and the sol–gel method, and the absence of such a linkage over the catalysts prepared by the methods other than wet-kneading and the sol–gel method, indicating that the wet-kneading and the sol–gel method may well promote the interaction of the components and lead to the formation of Si–O–Mg chemical bonds. In a very recent study, Weckhuysen et al.37 highlighted the role of magnesium silicate in a wet-kneaded silica–magnesia catalyst and proposed that the formation of the magnesium silicate phase as the key for the ethanol to butadiene conversion. Nevertheless, the sol–gel catalyst having the magnesium silicate phase exhibited a rather poor activity in our study, implying that the formation of this magnesium silicate phase, prepared by us, may not be the decisive structural characteristic to achieve high catalytic performance. In view of the difference in catalytic activity and the physicochemical properties of the MgO–SiO2 composite catalysts, the catalytic activity is associated with the balanced surface acid/base sites in relation to the interfacial Si–O–Mg link caused by the strong interaction between MgO and SiO2. The explanation is expected to be useful implication for designing new acid–base multifunctional catalysts for the ethanol-to-butadiene process. However, how exactly the Si–O–Mg linkage affects the catalytic performance remains an open question for further investigations.
4. Conclusions
In the direct conversion of ethanol to butadiene over binary MgO-SiO2 composite catalysts, the activity in terms of ethanol conversion and butadiene selectivity was found to depend significantly on the preparation methods and catalyst compositions. The catalyst materials prepared by wet-kneading proved to be more active and selective for ethanol conversion to butadiene, which points out the importance of the hierarchical flower-like structured MgO interacting with the as-prepared SiO2 spheres. The sol–gel method containing the high surface acidity led to the large amounts of by-products (ethylene, etc.) formed by ethanol dehydration. At the optimal reaction conditions, the best-performing wet-kneaded MgO![[thin space (1/6-em)]](https://www.rsc.org/images/entities/char_2009.gif) :
:![[thin space (1/6-em)]](https://www.rsc.org/images/entities/char_2009.gif) SiO2 = 65
SiO2 = 65![[thin space (1/6-em)]](https://www.rsc.org/images/entities/char_2009.gif) :
:![[thin space (1/6-em)]](https://www.rsc.org/images/entities/char_2009.gif) 35 (molar ratio) catalyst at 450 °C exhibited an ethanol conversion of 95% and BD selectivity of 77% at a high WHSV of 4.1 h−1 and an unprecedented productivity of 0.025 mol gcat−1 h−1 compared to commercial MgO. The hierarchical structured MgO was synthesized by using an ethylene-glycol-mediated self-assembly process, which provided a large surface area and better access to the catalytic sites. Extensive characterization showed that the greater ethanol conversion and butadiene selectivity were obtained by combining an appropriate balance of surface total basicity/total acidity (total basicity/total acidity = 0.24–0.3) with a small amount of strong acid sites (strong acidity/total acidity = 0.46–0.5), which are critical in catalyzing the dehydrogenation of ethanol, suppressing the dehydration and the aldol condensation, respectively, and consequently enhancing the butadiene selectivity. Together with the results presented above, the crucial factor to butadiene formation requires a subtle balance of acid–base sites in relation to the strong interaction between MgO and SiO2, leading to the formation of an interfacial Si–O–Mg linkage seemingly critical for high performance catalysts in the Lebedev process, which can be easily governed by the wet-kneading method and the MgO to SiO2 ratio.
35 (molar ratio) catalyst at 450 °C exhibited an ethanol conversion of 95% and BD selectivity of 77% at a high WHSV of 4.1 h−1 and an unprecedented productivity of 0.025 mol gcat−1 h−1 compared to commercial MgO. The hierarchical structured MgO was synthesized by using an ethylene-glycol-mediated self-assembly process, which provided a large surface area and better access to the catalytic sites. Extensive characterization showed that the greater ethanol conversion and butadiene selectivity were obtained by combining an appropriate balance of surface total basicity/total acidity (total basicity/total acidity = 0.24–0.3) with a small amount of strong acid sites (strong acidity/total acidity = 0.46–0.5), which are critical in catalyzing the dehydrogenation of ethanol, suppressing the dehydration and the aldol condensation, respectively, and consequently enhancing the butadiene selectivity. Together with the results presented above, the crucial factor to butadiene formation requires a subtle balance of acid–base sites in relation to the strong interaction between MgO and SiO2, leading to the formation of an interfacial Si–O–Mg linkage seemingly critical for high performance catalysts in the Lebedev process, which can be easily governed by the wet-kneading method and the MgO to SiO2 ratio.
Acknowledgements
This work is supported by the Program for Professor of Special Appointment (Eastern Scholar) at Shanghai Institutions of Higher Learning, the National Natural Science Foundation of China (Grant 21503133, 21673137), the Natural Science Foundation of Shanghai City (15ZR1419100, 16ZR1413900), the Scientific Research Foundation for the Returned Overseas Chinese Scholars from the State Education Ministry, the Municipal Education of Shanghai (ZZGCD15031) and the Shanghai University of Engineering Science Innovation Fund for Graduate Students (E3-0903-16-01037-15KY0408).Notes and references
- E. V. Makshina, M. Dusselier, W. Janssens, J. Degrève, P. A. Jacobs and B. F. Sels, Chem. Soc. Rev., 2014, 43, 7917–7953 RSC.
- C. Angelici, B. M. Weckhuysen and P. C. Bruijnincx, ChemSusChem, 2013, 6, 1595–1614 CrossRef CAS PubMed.
- M. D. Jones, Chem. Cent. J., 2014, 8, 53 CrossRef PubMed.
- J. Sun and Y. Wang, ACS Catal., 2014, 4, 1078–1090 CrossRef CAS.
- E. Makshina, W. Janssens, B. Sels and P. Jacobs, Catal. Today, 2012, 198, 338–344 CrossRef CAS.
- W. C. White, Chem.-Biol. Interact., 2007, 166, 10–14 CrossRef CAS PubMed.
- J. D. McMillan, Renewable Energy, 1997, 10, 295–302 CrossRef CAS.
- A. D. Patel, K. Meesters, H. den Uil, E. de Jong, E. Worrell and M. K. Patel, ChemSusChem, 2013, 6, 1724–1736 CrossRef CAS PubMed.
- J. Goldemberg, Science, 2007, 315, 808–810 CrossRef CAS PubMed.
- G. W. Huber, S. Iborra and A. Corma, Chem. Rev., 2006, 106, 4044–4098 CrossRef CAS PubMed.
- P. Anbarasan, Z. C. Baer, S. Sreekumar, E. Gross, J. B. Binder, H. W. Blanch, D. S. Clark and F. D. Toste, Nature, 2012, 491, 235–239 CrossRef CAS PubMed.
- S. Lebedev, Zh. Obshch. Khim., 1933, 3, 698–717 CAS.
- H. Niiyama, S. Morii and E. Echigoya, Bull. Chem. Soc. Jpn., 1972, 45, 655–659 CrossRef CAS.
- Y. A. Gorin, Zh. Obshch. Khim., 1946, 16, 283–294 CAS.
- W. Quattlebaum, W. Toussaint and J. Dunn, J. Am. Chem. Soc., 1947, 69, 593–599 CrossRef CAS.
- E. D. Williams, K. A. Krieger and A. R. Day, J. Am. Chem. Soc., 1953, 75, 2404–2407 CrossRef CAS.
- S. Bhattacharyya and S. Sanyal, J. Catal., 1967, 7, 152–158 CrossRef CAS.
- H. Jones, E. Stahly and B. Corson, J. Am. Chem. Soc., 1949, 71, 1822–1828 CrossRef CAS.
- H.-J. Chae, T.-W. Kim, Y.-K. Moon, H.-K. Kim, K.-E. Jeong, C.-U. Kim and S.-Y. Jeong, Appl. Catal., B, 2014, 150, 596–604 CrossRef.
- M. Lewandowski, G. S. Babu, M. Vezzoli, M. D. Jones, R. E. Owen, D. Mattia, P. Plucinski, E. Mikolajska, A. Ochenduszko and D. C. Apperley, Catal. Commun., 2014, 49, 25–28 CrossRef CAS.
- T. Tsuchida, J. Kubo, T. Yoshioka, S. Sakuma, T. Takeguchi and W. Ueda, J. Catal., 2008, 259, 183–189 CrossRef CAS.
- A. Chieregato, J. Velasquez Ochoa, C. Bandinelli, G. Fornasari, F. Cavani and M. Mella, ChemSusChem, 2015, 8, 377–388 CrossRef CAS PubMed.
- N. Takezawa, C. Hanamaki and H. Kobayashi, J. Catal., 1975, 38, 101–109 CrossRef.
- M. León, E. Díaz, A. Vega, S. Ordóñez and A. Auroux, Appl. Catal., B, 2011, 102, 590–599 CrossRef.
- Y. Kitayama and A. Michishita, J. Chem. Soc., Chem. Commun., 1981, 401–402 RSC.
- V. L. Sushkevich, D. Palagin and I. I. Ivanova, ACS Catal., 2015, 5, 4833–4836 CrossRef CAS.
- R. Ohnishi, T. Akimoto and K. Tanabe, J. Chem. Soc., Chem. Commun., 1985, 1613–1614 RSC.
- T. De Baerdemaeker, M. Feyen, U. Müller, B. Yilmaz, F.-S. Xiao, W. Zhang, T. Yokoi, X. Bao, H. Gies and D. E. De Vos, ACS Catal., 2015, 5, 3393–3397 CrossRef CAS.
- V. L. Sushkevich, I. I. Ivanova and E. Taarning, Green Chem., 2015, 17, 2552–2559 RSC.
- S. Da Ros, M. D. Jones, D. Mattia, J. C. Pinto, M. Schwaab, F. B. Noronha, S. A. Kondrat, T. C. Clarke and S. H. Taylor, ChemCatChem, 2016, 8, 2376–2386 CrossRef CAS.
- M. D. Jones, C. G. Keir, C. Di Iulio, R. A. Robertson, C. V. Williams and D. C. Apperley, Catal. Sci. Technol., 2011, 1, 267–272 CAS.
- B. Corson, E. Stahly, H. Jones and H. Bishop, Ind. Eng. Chem., 1949, 41, 1012–1017 CrossRef CAS.
- B. Corson, H. Jones, C. Welling, J. Hinckley and E. Stahly, Ind. Eng. Chem., 1950, 42, 359–373 CrossRef CAS.
- S. Kvisle, A. Aguero and R. Sneeden, Appl. Catal., 1988, 43, 117–131 CrossRef CAS.
- C. Angelici, M. E. Velthoen, B. M. Weckhuysen and P. C. Bruijnincx, ChemSusChem, 2014, 7, 2505–2515 CrossRef CAS PubMed.
- G. Natta and R. Rigamonti, Chim. Ind., 1947, 29, 239–243 CAS.
- S.-H. Chung, C. Angelici, S. O. Hinterding, M. Weingarth, M. Baldus, K. Houben, B. M. Weckhuysen and P. C. Bruijnincx, ACS Catal., 2016, 6, 4034–4045 CrossRef CAS.
- C. Angelici, M. E. Velthoen, B. M. Weckhuysen and P. C. Bruijnincx, Catal. Sci. Technol., 2015, 5, 2869–2879 CAS.
- W. Janssens, E. V. Makshina, P. Vanelderen, F. De Clippel, K. Houthoofd, S. Kerkhofs, J. A. Martens, P. A. Jacobs and B. F. Sels, ChemSusChem, 2015, 8, 994–1008 CrossRef CAS PubMed.
- Z.-M. Cui, Z. Chen, C.-Y. Cao, W.-G. Song and L. Jiang, Chem. Commun., 2013, 49, 6093–6095 RSC.
- W. Stöber, A. Fink and E. Bohn, J. Colloid Interface Sci., 1968, 26, 62–69 CrossRef.
- J. V. Ochoa, C. Bandinelli, O. Vozniuk, A. Chieregato, A. Malmusi, C. Recchi and F. Cavani, Green Chem., 2016, 18, 1653–1663 RSC.
- S. Gregg and K. Sing, Adsorption Surface Area and Porosity, Academic Press, New York, 1982 Search PubMed.
- F. Balas, M. Rodríguez-Delgado, C. Otero-Arean, F. Conde, E. Matesanz, L. Esquivias, J. Ramírez-Castellanos, J. Gonzalez-Calbet and M. Vallet-Regí, Solid State Sci., 2007, 9, 351–356 CrossRef CAS.
- S. Coluccia, A. Barton and A. J. Tench, J. Chem. Soc., Faraday Trans. 1, 1981, 77, 2203–2207 RSC.
- P.-Y. Wu, Y.-P. Jiang, Q.-Y. Zhang, Y. Jia, D.-Y. Peng and W. Xu, New J. Chem., 2016, 40, 2878–2885 RSC.
- Y. H. Xie, B. Li, W. Z. Weng, Y. P. Zheng, K. T. Zhu, N. W. Zhang, C. J. Huang and H. L. Wan, Appl. Catal., A, 2015, 504, 179–186 CrossRef CAS.
- M. R. Basila, J. Chem. Phys., 1961, 35, 1151–1158 CrossRef CAS.
- R. S. Mcdonald, J. Phys. Chem., 1958, 62, 1168–1178 CrossRef CAS.
- B. A. Morrow and A. J. Mcfarlan, J. Phys. Chem., 1992, 96, 1395–1400 CrossRef CAS.
- O. Isaienko and E. Borguet, Langmuir, 2013, 29, 7885–7895 CrossRef CAS PubMed.
- B. Karmakar, G. De and D. Ganguli, J. Non-Cryst. Solids, 2000, 272, 119–126 CrossRef CAS.
- Y. Y. Li, K. K. Han, W. G. Lin, M. M. Wan, Y. Wang and J. H. Zhu, J. Mater. Chem. A, 2013, 1, 12919–12925 CAS.
- A. Ġ. Vaġzoğullar, M. Uğurlu and Ġ. Kula, Inter. J. Environ., 2015, 4, 19–31 CrossRef.
- B. González-Rodríguez, R. Trujillano, V. Rives, M. Vicente, A. Gil and S. Korili, Appl. Clay Sci., 2015, 118, 124–130 CrossRef.
- D. Arkhipenko, J. Struct. Chem., 1963, 4, 180–186 CrossRef.
- M. Y. He, Z. Liu and E. Min, Catal. Today, 1988, 2, 321–338 CrossRef CAS.
- C. Liu, J. Sun, C. Smith and Y. Wang, Appl. Catal., A, 2013, 467, 91–97 CrossRef CAS.
- B. M. Choudary, M. L. Kantam, K. V. Ranganath, K. Mahendar and B. Sreedhar, J. Am. Chem. Soc., 2004, 126, 3396–3397 CrossRef CAS PubMed.
- M. T. Drexler and M. D. Amiridis, J. Catal., 2003, 214, 136–145 CrossRef CAS.
- O. V. Larina, P. I. Kyriienko and S. O. Soloviev, Theor. Exp. Chem., 2016, 52, 51–56 CrossRef CAS.
- L. C. Jian, Y. Shao, S. J. R. Tan, X. Li, Y. Zhang and S. L. Su, ACS Sustainable Chem. Eng., 2016, 4, 4887–4894 CrossRef.
- Y. Han, C. Lu, D. Xu, Y. Zhang, Y. Hu and H. Huang, Appl. Catal., A, 2011, 396, 8–13 CrossRef CAS.
- A. G. Gayubo, A. Alonso, B. Valle, A. T. Aguayo and J. Bilbao, Appl. Catal., B, 2010, 97, 299–306 CrossRef CAS.
- Y. Chen, Y. Wu, L. Tao, B. Dai, M. Yang, Z. Chen and X. Zhu, J. Ind. Eng. Chem., 2010, 16, 717–722 CrossRef CAS.
| This journal is © The Royal Society of Chemistry 2017 |

