New insights into the support morphology-dependent ammonia synthesis activity of Ru/CeO2 catalysts†
Zhanwei
Ma
ab,
Shengli
Zhao
ab,
Xiaoping
Pei
ab,
Xumao
Xiong
a and
Bin
Hu
*a
aState Key Laboratory for Oxo Synthesis and Selective Oxidation, Lanzhou Institute of Chemical Physics, Chinese Academy of Sciences, Lanzhou 730000, China. E-mail: Hcom@licp.cas.cn; Fax: +86 931 8277088; Tel: +86 931 4968258
bUniversity of Chinese Academy of Sciences, Beijing 100049, China
First published on 24th November 2016
Abstract
Three ceria nanocrystals with different morphologies (nanocubes, nanorods, and nanoparticles) were synthesized and used as supports to evaluate the support morphology-dependent ammonia synthesis activity in the structure-sensitive ammonia synthesis reaction. The Ru/r-CeO2 catalyst shows a higher catalytic reaction rate (3830 μmol g−1 h) than that of Ru/c-CeO2 (1289 μmol g−1 h) and Ru/p-CeO2 (529 μmol g−1 h) under the reaction conditions of 400 °C, 1 MPa, and 60 mL min−1. In addition, promoters (Cs, K, and Ba) can effectively enhance the catalytic activity of the catalysts such as 2Cs–Ru/r-CeO2 (14![[thin space (1/6-em)]](https://www.rsc.org/images/entities/char_2009.gif) 266 μmol g−1 h) and 2K–Ru/r-CeO2 (11
266 μmol g−1 h) and 2K–Ru/r-CeO2 (11![[thin space (1/6-em)]](https://www.rsc.org/images/entities/char_2009.gif) 227 μmol g−1 h). The effect of the morphology of the CeO2 support on the metal–support interaction and catalytic performance of the Ru/CeO2 catalysts can be correlated to the exposed crystal planes and surface composition/electronic structure of the CeO2 support with diverse morphologies.
227 μmol g−1 h). The effect of the morphology of the CeO2 support on the metal–support interaction and catalytic performance of the Ru/CeO2 catalysts can be correlated to the exposed crystal planes and surface composition/electronic structure of the CeO2 support with diverse morphologies.
1. Introduction
Supported ruthenium catalysts have much higher activity at lower temperatures and pressures than that of the conventional iron catalysts in the synthesis reaction of ammonia.1,2 Therefore, extensive efforts have been focused on the development of effective Ru-based catalysts, including 1) Ru particle size and shape, with the most active sites (B5-type sites) ranging from 1.8 to 3.5 nm, 2) basic promoters such as alkali or alkaline earth compounds (Cs+, K+, Ba2+, etc.), and 3) the search for a proper support for Ru particles, for the synthesis of ammonia. In particular, the focal point is the design of a support that possesses the ability to change the electronic properties of Ru and affect its morphology and structure. To date, many supports, such as carbon materials, nitrides, zeolites, and oxides, have been well-developed and successfully utilized for the synthesis of ammonia.3–6 However, these supports, which consist of particles, are complex solid systems with ill-defined surface species and assorted polycrystals.Ceria, as a typical polycrystalline metal oxide, is more effective for ammonia synthesis when used as a support rather than a promoter.7 It has been reported in the previous studies8,9 that the reversible Ce4+/Ce3+ redox pair and oxygen vacancies cause the electron density of the Ru metal surface to increase and thereby enhances its activity for ammonia synthesis. Recently, ceria nanocrystals with uniform and well-defined planes, such as nanorods ({110} and {100}), nanocubes ({100}), and nanopolyhedrons ({111} and {100}), have been controllably synthesized.10,11 Numerous theoretical calculations indicate that the different crystal planes of ceria could strongly affect the oxygen vacancy formation energy and the interaction with surface molecules12 and metals such as Au,13 Pd,14 Ag,15 and Pt.16 Moreover, different exposed planes have various types of surface geometries or electronic structures and compositions, which could affect the chemical state of the active metal when being loaded on the different crystal planes. For instance, a recent study17 based on the oxidation of formaldehyde on Pd supported on ceria with different morphologies indicates that different facets have different concentrations and structures of oxygen vacancies, which can affect the chemical state of the active Pd component and further enhance its catalytic activity. Similar phenomena were observed when silver,18 aurum,19 platinum,20 nickel,21 or ruthenium22 was supported on ceria with different morphologies. Ammonia synthesis over ruthenium catalysts is well known as a structure-sensitive reaction. Several groups23,24 have reported the strong effect of Ru particle size and shape on its catalytic activity for ammonia synthesis. However, the morphological effect of the support on the ammonia synthesis activity over supported Ru catalysts, to the best of our knowledge, has never been reported.
Herein, we employed the different morphologies of ceria nanorods (r-CeO2), nanocubes (c-CeO2), and nanoparticles (p-CeO2) as supports to prepare the Ru/CeO2 catalysts (denoted as Ru/r-CeO2, Ru/c-CeO2, and Ru/p-CeO2, respectively). Their physical and chemical properties were investigated by TEM, XRD, UV-vis, Raman, XPS, and TPR analyses. The catalysts exhibit significant support-morphology-dependent catalytic performances for the ammonia synthesis reaction, which could be correlated to the exposed crystal planes and surface composition of the CeO2 nanocrystals. The promoters (Cs, K, and Ba) introduced to the catalysts obviously enhanced their ammonia synthesis activity.
2. Experimental section
2.1 Chemicals
All chemicals were of analytical grade and used directly without any further purification. They were purchased from Aladdin Industrial Corporation in China. The purity of nitrogen and hydrogen was 99.999%. Deionized water with a resistivity of 18.25 MΩ cm was used in all the reactions.2.2 Preparation of supports
CeO2 supports with various morphologies were prepared via an improved hydrothermal method, as previously reported.10 To obtain nanorods and nanocubes, 6.96 g of Ce(NO3)3·6H2O and 19.6 g of NaOH were first dissolved in 5 mL and 35 mL of deionized water, respectively. Subsequently, these two solutions were mixed and directly transferred to a 50 mL Teflon-lined stainless steel autoclave without stirring, and then heated at 100 °C, 120 °C, and 180 °C for 24 h to obtain r-CeO2, p-CeO2, and c-CeO2, respectively. After the hydrothermal treatment, the precipitates were washed with deionized water until the pH = 7, and then dried at 60 °C for 12 h, followed by calcination at 450 °C for 4 h in air at a heating rate of 2.5 °C min−1.2.3 Preparation of Ru/CeO2 catalysts
Ru/CeO2 catalysts were prepared using the incipient impregnation method. The CeO2 powders with different morphologies were stirred with a solution of ruthenium carbonyl (Ru3(CO)12) in THF at room temperature for 12 h in a rotary evaporator. Then the solvent was removed under reduced pressure at 30 °C. The gray powder was calcined at 300 °C for 3 h in a hydrogen atmosphere at a heating rate of 3 °C min−1, followed by cooling down to room temperature in a hydrogen atmosphere.The promoters were introduced using the wet impregnation method with an aqueous solution of nitrates (KNO3, Ba(NO3)2 or CsNO3) at 30 °C. The resulting samples were dried at 110 °C for 12 h. In addition, 2Cs–Ru/MgO and 6Ba–Ru/AC catalysts were synthesized according to the previous reports.25,26 The molar ratio of M/Ru (M = Cs, K, and Ba) in the 2M–Ru/CeO2 and 2Cs–Ru/MgO catalysts is 2, whereas in the 6Ba–Ru/AC catalyst, it is 6.
2.4 Measurements of catalytic activity
In the ammonia synthesis reaction, 0.2 g catalyst was used for each experiment. The catalyst was diluted with quartz sand to 0.6 mL (stainless steel microreactor (φ = 6 mm)). A stainless steel reactor with an inner diameter of 6 mm was used. The catalysts were stabilized under different temperatures for 2 hours (reaction conditions: 1 MPa, 60 mL min−1, and H2/N2 = 3). When the ammonia synthesis reaction reached a steady state, data were obtained. The ammonia synthesis rates in the effluent were determined via a chemical titration method with a known amount of H2SO4 (Congo red as the indicator).2.5 Characterization of the catalysts
The crystalline structures of the samples were analyzed via X-ray powder diffraction (XRD) (X'pert, PANalytical, Dutch) using Cu Kα radiation (λ = 1.54050 Å). The crystallite size of the support was calculated using the Scherrer equation. The BET surface area (SBET) and pore volume of all the samples were determined using N2 physisorption at 77 K with a Micromeritics ASAP 2020 apparatus. Scanning electron microscope (SEM) images were obtained using a JEOL JSM-6701F scanning electron microscope. Transmission electron microscope (TEM) experiments were conducted using a JEM-2010 with an accelerating voltage of 200 kV. The element compositions were detected using an X-ray photoelectron spectrometer (XPS, ESCALAB 250Xi). The electron binding energy scale of all the spectra was calibrated using C 1s at 284.8 eV. Temperature programmed reduction (TPR) profiles of the samples were generated using a TP-5080 catalyst characterization instrument with a TCD detector. Before the H2-TPR test, the samples (50 mg) were pretreated with an Ar flow (27 mL min−1) at 573 K for one hour and were then cooled down to 288 K. The test was performed by heating the samples (50 mg) in a H2/Ar (H2, 10%) mixture flow (30 mL min−1) at a linear heating ramp of 10 K min−1 from 288 to 1173 K. CO chemisorption was determined using the pulse method by introducing a CO flow over the sample (150 mg) maintained at 293 K. Ru dispersion was calculated from the cumulative volume of CO adsorbed during the pulse, assuming a chemisorption stoichiometry CO/Ru = 1![[thin space (1/6-em)]](https://www.rsc.org/images/entities/char_2009.gif) :
:![[thin space (1/6-em)]](https://www.rsc.org/images/entities/char_2009.gif) 1. UV-visible diffuse reflectance spectra were obtained using a UV-2550 (Shimadzu) spectrometer with BaSO4 as the reference. Raman spectra were obtained using a Renishaw RM1000 (λ
1. UV-visible diffuse reflectance spectra were obtained using a UV-2550 (Shimadzu) spectrometer with BaSO4 as the reference. Raman spectra were obtained using a Renishaw RM1000 (λ![[thin space (1/6-em)]](https://www.rsc.org/images/entities/char_2009.gif) =
=![[thin space (1/6-em)]](https://www.rsc.org/images/entities/char_2009.gif) 514 nm and 325 nm). The percentage composition of Ru was determined by XRF using a MagixPW2403.
514 nm and 325 nm). The percentage composition of Ru was determined by XRF using a MagixPW2403.
3. Results and discussion
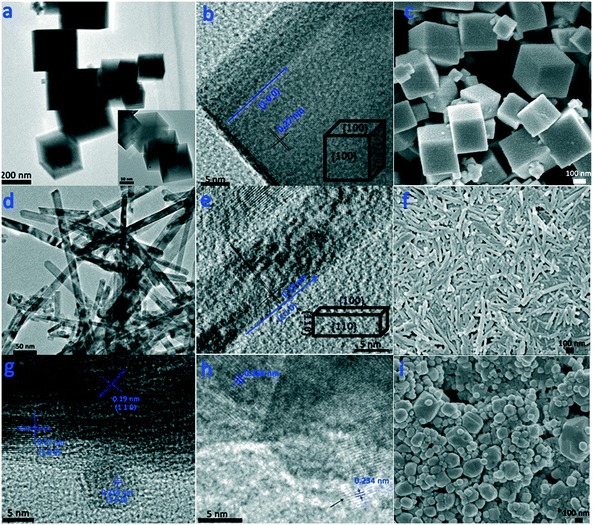
First, three CeO2 samples with different morphologies were fabricated (Fig. 1). Fig. 1a–c show the uniform cube morphology of c-CeO2 with a side size of approximately 300 nm. Note that a few smaller cubes grew on the larger cubes (Fig. S1†). The high-resolution TEM (HRTEM) image, as shown in Fig. 1b, displays clear (100) lattice fringes with an interplanar spacing of 0.27 nm, which indicates that c-CeO2 selectively exposes the (100) planes. The rod morphology of r-CeO2 has a length in the range of 200–400 nm (Fig. 1d and f). An interplanar spacing of 0.19 nm, which is attributed to the (110) plane, is observed (Fig. 1e). This indicates that r-CeO2 shows a preferred 1D growth direction along (110) and is thus enclosed by (110) and (100) planes. Moreover, some “dark pits” are observed on r-CeO2 (Fig. S2†). These “dark pits” indicate that there are many defects in r-CeO2. Fig. 1i shows irregular nanoparticles with a size of 100–300 nm, which are often referred as “classical nanoparticles”,27 with the most stable (111) planes predominantly exposed. However, as previously reported21,22 and revealed by the HRTEM images, only the (100) facet exists in c-CeO2, whereas the (111) and (110) facets are the main exposed planes for p-CeO2 and r-CeO2, respectively.Fig. 2 shows the XRD patterns of the three CeO2 samples with different morphologies and the corresponding supported Ru samples. The XRD patterns of the three CeO2 samples can be indexed to that of the fluorite CeO2 cubic structure (JCPDS: 03-065-2975), with the lattice parameters of 5.422, 5.398, and 5.373 Å. After ruthenium loading on the CeO2 samples, the resulting Ru/CeO2 samples show Ru loadings close to the theoretical value of 4% (determined by XRF measurements, Table S1†), despite some weight loss. Moreover, the TEM images (Fig. 1g, h and S3†) and the elemental mapping of the Ru/CeO2 catalysts (Fig. S4 and S5†) also disclose that the Ru nanoparticles are dispersed on the supports. The lattice spacing is 0.234 nm, which corresponds to the (100) plane of Ru (Hexagonal, JCPDS: 03-065-7645). However, no diffraction peaks related to Ru species are observed in the XRD patterns of the three Ru/CeO2 catalysts, which implies that the Ru species are highly dispersed in the catalysts. CO chemisorption and XPS were further performed to obtain the Ru dispersity (Table S1†). The results show that Ru/r-CeO2 and Ru/p-CeO2 display much higher Ru dispersion (40.4% and 36.3%, respectively) than that of Ru/c-CeO2 (23.1%), which is consistent with the trend observed by XPS. It is well-known that the strain is a type of metrology of lattice stress due to the surface effects and crystal imperfections.28 Since oxygen vacancies are the main defects in the samples, the difference in microstrain (Table S1†) indicates that the density of oxygen defects in the r-CeO2 sample is larger than that in the c-CeO2 and p-CeO2 samples. In addition, the larger microstrain of r-CeO2 could be related to the “dark pits” observed in its TEM image (Fig. S2†). Loading Ru on the CeO2 samples caused a decrease in the microstrain of the r-CeO2 and p-CeO2 samples, and contrarily, the microstrain of the c-CeO2 sample increased. These results suggest that the surface of CeO2 is enriched with oxygen vacancies, which can strongly bind to the Ru nanoparticles, and simultaneously, the Ru nanoparticles can induce the generation of oxygen vacancies in CeO2. Since the introduction of strain within the lattice could further increase the charge carrier mobility,29 we can deduce that the order of charge carrier mobility is Ru/r-CeO2 > Ru/c-CeO2 > Ru/p-CeO2.
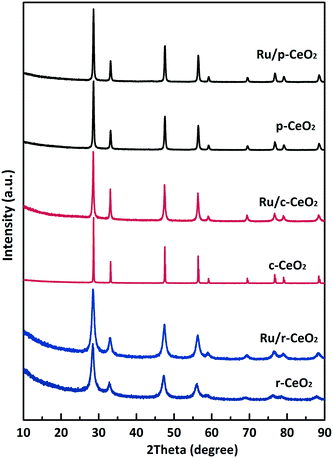 | ||
| Fig. 2 XRD patterns for the different morphologies of CeO2 and the corresponding supported Ru catalysts. | ||
Raman spectroscopy was further employed to provide the bulk and surface information using 514 nm and 325 nm excitation laser lines (Fig. S6 and S7†). Fig. S6† presents the visible (514 nm) Raman spectra of the three CeO2 supports and the corresponding catalysts. The Raman peak at around 462 cm−1 is ascribed to the F2g vibration mode of the cubic CeO2, and the other peaks at around 593 cm−1 and 1172 cm−1 are associated with the defect-induced (D) modes and second-order longitudinal modes, respectively, of the cubic CeO2 fluoride structure.22 Moreover, the Raman peaks at 690 and 964 cm−1 can be assigned to the Ru–O–Ce bond resulting from the metal–support interaction.30 The Raman spectra of Ru/CeO2 are similar to that of the supports. However, the F2g peaks shift to lower wavenumbers at around 452 cm−1, which suggests that the deposited Ru lowers the symmetry of the Ce–O bond, and this results in an increased optical absorption.21 Moreover, the peaks of Ru species were not detected, which indicates that the Ru species were highly dispersed in the catalysts. Since UV Raman spectra are more sensitive to defect sites in ceria than the visible Raman spectra, the concentration of oxygen vacancies in the supports were detected with 325 nm excitation laser lines (Fig. S7†). The relative intensity ratio of ID/IF2g reflects the concentration of oxygen vacancies in the CeO2 samples. This ratio for r-CeO2 is much higher than that for the c-CeO2 and p-CeO2 samples, which suggests that r-CeO2 has the most abundant oxygen vacancies. Theoretical calculations13 indicate that the oxygen vacancy formation energy on the different crystal planes of CeO2 follow the order of (110) < (100) < (111). This phenomenon is also in accordance with the other results reported in the literature.20–22
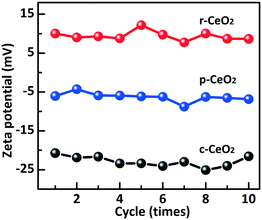
The ideal CeO2 (100) surface is a polar plane and its surface is terminated by an O layer. The CeO2 (110) and (111) surfaces are nonpolar planes (charge neutral) and their surfaces have both exposed Ce4+ and O atoms.31 However, the defects induced different surface compositions and electron structures on the planes. The zeta potential is the electrostatic potential that exists at the shear plane of a particle, which is related to both the surface charge and the local environment of the particle. The zeta potentials of r-CeO2, c-CeO2, and p-CeO2 are shown in Fig. 3. For c-CeO2 sample, the zeta potential is −22.9 ± 2.2 mV, which is due to the fact that the (100) plane was terminated by an O layer. The zeta potential of p-CeO2 is −6.3 ± 2 mV, which is close to that of the ideal (111) plane. This negative potential is ascribed to the reduction of Ce4+ to Ce3+ and oxygen species absorbed on Ce4+. However, the zeta potential of r-CeO2 is +9.4 ± 0.6 mV, which could be assigned to the “dark pits” observed on its HRTEM images, indicating the presence of abundant pit-surrounding Ce sites.32
The surface electronic states were obtained from UV/vis diffuse reflectance measurements. The support and the catalyst exhibit two intense absorption bands at about 271 and 343 nm (Fig. 4). These bands could be assigned to the O2− → Ce4+ charge transfer and the interband transitions,33 respectively. Moreover, a weak peak at 219 nm is attributed to the O2− → Ce3+ charge transfer. Compared with the absorption edge of p-CeO2, which in c-CeO2 and r-CeO2 shifts to a larger wavelength, this redshift in fact is due to the presence of Ce3+ and F color centers.34 These results suggest that the surface electron structures of CeO2 with different planes are different, which is consistent with the zeta potential results.
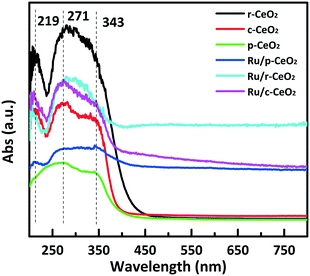 | ||
| Fig. 4 UV-vis diffuse reflectance spectra for the different morphologies of CeO2 and the supported Ru catalysts. | ||
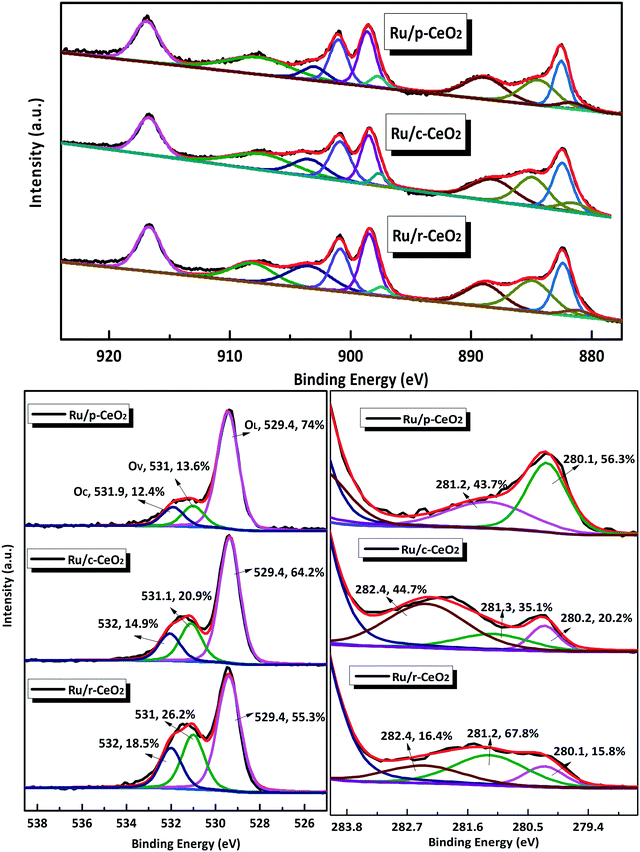
XPS analysis was used to investigate the surface chemical state of Ce, O, and Ru elements in the three Ru/CeO2 catalysts. The XPS survey spectra of the three Ru/CeO2 catalysts (Fig. S8†) indicate that the as-prepared composites comprised Ce, O, and Ru elements. Fig. 5 shows the high-resolution XPS spectra of Ce 3d, O 1s, and Ru 3d for the three Ru/CeO2 catalysts. The XPS spectra of Ce 3d are fitted into ten components. Both valences (3+ and 4+) are present in the three Ru/CeO2 catalysts. The relative percentages of Ce, Ru, and O species are obtained from the area ratio of the peaks. As shown in Table S2,† Ru/r-CeO2 has the highest Ce3+/Ce4+ ratio (0.59) among the three Ru/CeO2 catalysts, followed by Ru/c-CeO2 (0.46) and Ru/p-CeO2 (0.34). Since the presence of Ce3+ is associated with the generation of oxygen vacancies, the concentration of surface oxygen vacancies should follow the same order: Ru/r-CeO2 > Ru/c-CeO2 > Ru/p-CeO2, which agrees well with the Raman and microstrain results. The Ru/r-CeO2 and Ru/c-CeO2 catalysts exhibit larger Ce3+/Ce4+ ratios than their corresponding supports. This could be explained by the formation of more oxygen vacancies. In addition, O 1s could be fitted with the three peaks35 at 529.4 eV (OL), 531 eV (Ov), and 531.9 eV (Oc), which are assigned to the lattice oxygen bound to the metal cations, O2− in oxygen-deficient regions, and chemisorbed and dissociated oxygen species or OH, respectively. As a consequence, the number of surface oxygen vacancies could be roughly estimated based on the ratio of OV/OL.36 As shown in Table S2,† r-CeO2 has more oxygen vacancies than c-CeO2, whereas the loading of Ru increases the oxygen vacancies of all the catalysts, which is in accordance with the results obtained from the Ce 3d spectra.
The Ru X-ray photoelectron spectra (XPS) of the catalysts present a doublet corresponding to Ru 3d5/2 and Ru 3d3/2 (Fig. 5). The binding energy at 280.2 eV is characteristic of metallic ruthenium (Ru0). The shift in the peaks for Ru 3d5/2 to higher values (281.2 eV and 282.4 eV) can be attributed to Run+, which most likely exists at the interface between Ru and CeO2.37 The presence of Run+ indicates that the Ce–O bond is bound to the Ru nanoparticles, and this feature is also observed in the Raman spectra at 964 and 690 cm−1. The relative percentages of Run+ follow the order of Ru/r-CeO2 (84.2%) > Ru/c-CeO2 (79.8%) > Ru/p-CeO2 (43.7%).
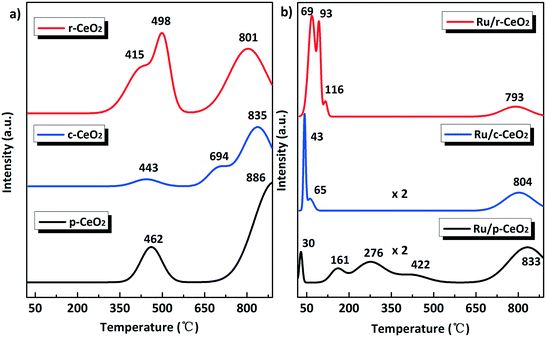
H2-TPR was employed to investigate the reducibility of the CeO2 supports and Ru/CeO2 catalysts. The peaks in the high temperature region (>600 °C) could be attributed to the reduction of bulk CeO2. The p-CeO2 and r-CeO2 supports exhibit strong reduction peaks at 462 and 415–498 °C (Fig. 6a), respectively, which could be attributed to the reduction of ceria surface oxygen. However, c-CeO2 shows a weak reduction peak for ceria surface oxygen at 443 °C. These results imply that the reduction of pure ceria is influenced by the morphology. After Ru loading, the reduction peaks of ceria surface oxygen shift to lower temperatures (Fig. 6b). Given that the samples were pretreated with Ar for 1 h, the reduction peaks at 30, 43 and 69 °C should be caused by the weakening of the Ce–O bond by the strongly bound Ru species.17 Campbell38 proposed the electronic metal–support interaction (EMSI) related to ceria formed by strong chemical bonds to Ru nanoparticles. As such, this strong Ce–O–Ru bond causes electron transfer from Ru to the support, thus forming Run+. As a consequence, the relative number of Run+ and Ce–O–Ru bonds can be roughly estimated by the area ratio of the reduction peaks. The area ratio of Ce–O–Ru in Ru/r-CeO2 is 7 and 15 times more than that of Ru/c-CeO2 and Ru/p-CeO2, respectively. The relative number of Ru–O–Ce and Run+ follows the order of Ru/r-CeO2 > Ru/c-CeO2 > Ru/p-CeO2, which is in accordance with the results obtained from the Ru XPS spectra. Moreover, the surface oxygen species reduction occurred together with the reduction of Ru species at 65 and 93–116 °C in the Ru/c-CeO2 and Ru/r-CeO2 samples, respectively. However, in the case of Ru/p-CeO2, the lower temperatures at 161 and 276 °C could be ascribed to the abstraction of O2− by hydrogen from the surface ceria facilitated by the presence of the Ru nanoparticles. The reduction peak at 422 °C appears because the reduced ceria is far from the Ru nanoparticles. It is interesting to compare the surface oxygen reduction peak (<600 °C) area of the Ru/CeO2 catalysts with that of the CeO2 supports. The surface oxygen reduction peak area of Ru/r-CeO2 is 1.8 times larger than that of the r-CeO2 support. For the Ru/c-CeO2 and Ru/p-CeO2 catalysts, this peak area is 3.1 and 2.8 times larger than that of the corresponding supports, respectively. Specifically, the H2 consumption amount of surface oxygen in the Ru/CeO2 catalysts is far more than that in the CeO2 supports. Generally, after the surface oxygen reduction in the Ru/CeO2 catalysts, a Ce film was formed on the CeO2 surface and Ru was deposited onto the Ce film. According to a previous report,39 the Ce/Ru metal system can uptake hydrogen to form CeH2+x hydride. Thus, it is reasonable to deduce that the excess H2 consumption should be a result of the formation of the CeH2+x hydride. As such, the amount of CeH2+x hydride on the different planes could be similar to the number of Ru–O–Ce and Run+ following the order: Ru/r-CeO2 > Ru/c-CeO2 > Ru/p-CeO2. The earlier studies40,41 have reported that CeH2+x hydride can transfer electrons to Ru, as detected by the X-ray absorption spectroscopy (XAS), which suggests that the ammonia synthesis activity is related to the formation of CeH2+x hydride on different planes.
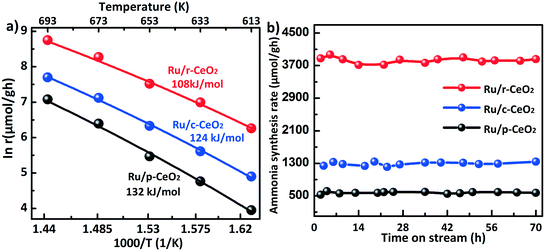
Ammonia synthesis is a structure-sensitive reaction, which determines the optimal loading amount and size of Ru. For the loading amount of Ru, a previous study42 revealed that the dispersion of Ru decreases in the range of 1–5% Ru and the optimal loading is around 3.5%. In addition, Li et al.43 found that the catalytic activity does not apparently increase when the Ru loading exceeds 4%. Therefore, three different ceria morphologies with a Ru loading of 4% were employed to establish the structure–activity relationship of the support. The ammonia synthesis rates and apparent activation energy (Ea) were evaluated on the three Ru/CeO2 catalysts (Fig. 7a). The reaction rate of the Ru/r-CeO2 catalyst was 3830 μmol g−1 h, which was much higher than that of the Ru/c-CeO2 (1289 μmol g−1 h) and Ru/p-CeO2 (529 μmol g−1 h) catalysts at a reaction temperature of 400 °C. The Ea values of the three Ru/CeO2 catalysts can be ranked as follows: Ru/r-CeO2 (108 kJ mol−1) < Ru/c-CeO2 (124 kJ mol−1) < Ru/p-CeO2 (132 kJ mol−1). These results indicate that the morphology of the CeO2 supports has a significant effect on the rate of ammonia synthesis, which agrees well with the amount of CeH2+x hydride on the different planes. In addition, it is widely accepted that the basicity of the support would lead to electron donation to Ru, and the acidity would withdraw electrons from Ru. Therefore, the activity of Ru/γ-Al2O3 for the ammonia synthesis is lower than that of Ru/MgO (Fig. S9†). For the Ru/p-CeO2 catalyst, its basicity is weaker than that of MgO, whereas the activity of Ru/p-CeO2 is higher than that of Ru/MgO. This could be ascribed to the formation of CeH2+x hydride, which could transfer electrons to Ru and reversibly store and release hydrogen.44Fig. 7b shows the correlation of the ammonia synthesis rate with the reaction time on stream. The catalysts were used to continuously produce NH3 for 70 hours without deactivation.
Alkali and alkaline earth metals (Cs, K, and Ba) are exclusively used as promoters for ammonia synthesis. These promoters can effectively lower the N2 dissociation barrier and facilitate the destabilization of NHx species. Fig. 8 shows the effect of K, Ba, and Cs promoters introduced into the three Ru/CeO2 catalysts on the ammonia synthesis rate. Note that the catalytic activities increase by the introduction of Cs, K, and Ba promoters. Especially, the Cs promoter is the most effective to improve the ammonia synthesis rate with different morphologies of the Ru/CeO2 catalysts. For the same morphology, such as the r-CeO2 support, the effect of the promoters on the catalytic performance of 2M–Ru/r-CeO2 (M = K, Cs, and Ba) catalysts follows the order of 2Cs–Ru/r-CeO2 (14![[thin space (1/6-em)]](https://www.rsc.org/images/entities/char_2009.gif) 266 μmol g−1 h) > 2K–Ru/r-CeO2 (11
266 μmol g−1 h) > 2K–Ru/r-CeO2 (11![[thin space (1/6-em)]](https://www.rsc.org/images/entities/char_2009.gif) 227 μmol g−1 h) > 2Ba–Ru/r-CeO2 (6638 μmol g−1 h). Therefore, the XPS of the 2M–Ru/r-CeO2 catalysts was further performed to investigate the effect of the promoters on the catalytic activity (Fig. S10†). It can be observed that the Cs 3d5/2 binding energy at 724.2 eV is much lower than that of Cs2O (725.2 eV). According to the previous reports,45–47 ruthenium can facilitate the decomposition of CsNO3, KNO3, and Ba(NO3)2 at around 120 °C and partial Cs reduction has been observed by XAS. Thus, the Cs 3d5/2 binding energy at 724.2 eV can be attributed to the partially reduced cesium. The Ba 3d5/2 binding energy at 780 eV is ascribed to the formation of BaO, which is in accordance with the previous report.48 Interestingly, the promoters obviously changed the electronic structure of the ruthenium and the support. The relative percentage of Ru0 was 15.8% in Ru/r-CeO2, whereas that of Ru0 increased to 47.6%, 20.3%, and 48.9% in 2Cs–Ru/r-CeO2, 2Ba–Ru/r-CeO2, and 2K–Ru/r-CeO2, respectively. Simultaneously, the ratio of Ce3+/Ce4+ decreased from 0.58 to 0.29, 0.31, and 0.23 (Table S3†). This suggests that the introduction of promoters causes the electron transfer from the support to Ru. For the promoters, the electron effect may be the main promoting action.49,50 However, there is no direct correlation between the activity of Ru and the relative percentage of Ru0 and the values for ratio of Ce3+/Ce4+. Comparing the three Ru/CeO2 catalysts involving the same promoter, the catalytic activities follow the order of 2M–Ru/r-CeO2 > 2M–Ru/c-CeO2 > 2M–Ru/p-CeO2. These results indicate that the different planes of CeO2 and the promoters play crucial roles to enhance the ammonia synthesis activity. Table S4† compares the rates of ammonia synthesis over Ru catalysts supported on various supports with different Ru precursors. The 2Cs–Ru/r-CeO2 catalyst has much higher activity (33.5 mmol g−1 h) at 3 MPa and 400 °C than that of the other catalysts. The 2Cs–Ru/MgO (10
227 μmol g−1 h) > 2Ba–Ru/r-CeO2 (6638 μmol g−1 h). Therefore, the XPS of the 2M–Ru/r-CeO2 catalysts was further performed to investigate the effect of the promoters on the catalytic activity (Fig. S10†). It can be observed that the Cs 3d5/2 binding energy at 724.2 eV is much lower than that of Cs2O (725.2 eV). According to the previous reports,45–47 ruthenium can facilitate the decomposition of CsNO3, KNO3, and Ba(NO3)2 at around 120 °C and partial Cs reduction has been observed by XAS. Thus, the Cs 3d5/2 binding energy at 724.2 eV can be attributed to the partially reduced cesium. The Ba 3d5/2 binding energy at 780 eV is ascribed to the formation of BaO, which is in accordance with the previous report.48 Interestingly, the promoters obviously changed the electronic structure of the ruthenium and the support. The relative percentage of Ru0 was 15.8% in Ru/r-CeO2, whereas that of Ru0 increased to 47.6%, 20.3%, and 48.9% in 2Cs–Ru/r-CeO2, 2Ba–Ru/r-CeO2, and 2K–Ru/r-CeO2, respectively. Simultaneously, the ratio of Ce3+/Ce4+ decreased from 0.58 to 0.29, 0.31, and 0.23 (Table S3†). This suggests that the introduction of promoters causes the electron transfer from the support to Ru. For the promoters, the electron effect may be the main promoting action.49,50 However, there is no direct correlation between the activity of Ru and the relative percentage of Ru0 and the values for ratio of Ce3+/Ce4+. Comparing the three Ru/CeO2 catalysts involving the same promoter, the catalytic activities follow the order of 2M–Ru/r-CeO2 > 2M–Ru/c-CeO2 > 2M–Ru/p-CeO2. These results indicate that the different planes of CeO2 and the promoters play crucial roles to enhance the ammonia synthesis activity. Table S4† compares the rates of ammonia synthesis over Ru catalysts supported on various supports with different Ru precursors. The 2Cs–Ru/r-CeO2 catalyst has much higher activity (33.5 mmol g−1 h) at 3 MPa and 400 °C than that of the other catalysts. The 2Cs–Ru/MgO (10![[thin space (1/6-em)]](https://www.rsc.org/images/entities/char_2009.gif) 530 μmol g−1 h−1) and 6Ba–Ru/AC (6543 μmol g−1 h) catalysts were also used for comparison (Fig. S11†) at 1 MPa and 400 °C. The former is one of the most active Ru catalysts for ammonia synthesis and the latter is used for commercial ammonia production. Under these reaction conditions, the ammonia synthesis rate of the 2Cs–Ru/p-CeO2 catalyst was 5103 μmol g−1 h, which is much smaller than that of the 2Cs–Ru/MgO catalyst. With a change in the exposed planes of ceria, the ammonia synthesis rate significantly increased, for example, the ammonia synthesis rate of 6061 μmol g−1 h for 2Cs–Ru/c-CeO2 and 14
530 μmol g−1 h−1) and 6Ba–Ru/AC (6543 μmol g−1 h) catalysts were also used for comparison (Fig. S11†) at 1 MPa and 400 °C. The former is one of the most active Ru catalysts for ammonia synthesis and the latter is used for commercial ammonia production. Under these reaction conditions, the ammonia synthesis rate of the 2Cs–Ru/p-CeO2 catalyst was 5103 μmol g−1 h, which is much smaller than that of the 2Cs–Ru/MgO catalyst. With a change in the exposed planes of ceria, the ammonia synthesis rate significantly increased, for example, the ammonia synthesis rate of 6061 μmol g−1 h for 2Cs–Ru/c-CeO2 and 14![[thin space (1/6-em)]](https://www.rsc.org/images/entities/char_2009.gif) 266 μmol g−1 h for 2Cs–Ru/r-CeO2. These results suggest that the effect of the morphology of CeO2 support on the catalytic performance of Ru/CeO2 and 2M–Ru/CeO2 catalysts could be correlated to the exposed crystal planes and surface composition/electronic structure of the CeO2 support with different morphologies.
266 μmol g−1 h for 2Cs–Ru/r-CeO2. These results suggest that the effect of the morphology of CeO2 support on the catalytic performance of Ru/CeO2 and 2M–Ru/CeO2 catalysts could be correlated to the exposed crystal planes and surface composition/electronic structure of the CeO2 support with different morphologies.
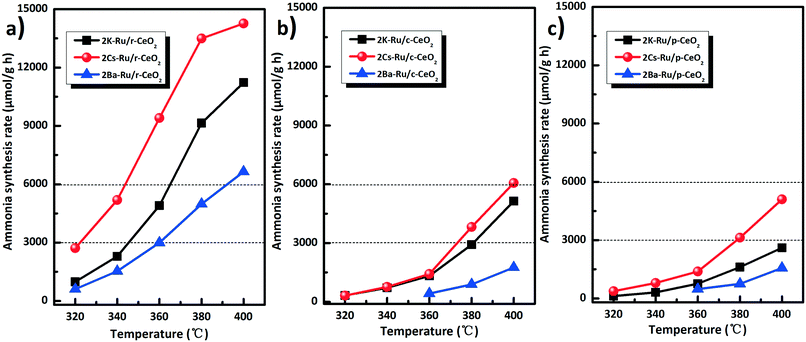 | ||
Fig. 8 Activity comparison of the Ru/CeO2 catalysts (a–c) with the promoters (K, Ba, and Cs). Reaction conditions: 673 K, N2![[thin space (1/6-em)]](https://www.rsc.org/images/entities/char_2009.gif) : :![[thin space (1/6-em)]](https://www.rsc.org/images/entities/char_2009.gif) H2 = 1 H2 = 1![[thin space (1/6-em)]](https://www.rsc.org/images/entities/char_2009.gif) : :![[thin space (1/6-em)]](https://www.rsc.org/images/entities/char_2009.gif) 3, 60 mL min−1, and 1 MPa. 3, 60 mL min−1, and 1 MPa. | ||
4. Conclusions
We have synthesized three different morphologies of CeO2 supports (nanocubes, nanorods, and nanoparticles), which dominantly exposed the (100), (110), and (111) facets, respectively. Raman, UV-vis, zeta potential, XPS, and H2-TPR analyses verify that the surface composition and electronic structure of the various facets are different. The three Ru/CeO2 catalysts and catalysts involving promoters (Cs, K, and Ba) exhibit significant support-morphology-dependent catalytic activity towards ammonia synthesis. The Ru/r-CeO2 catalyst shows a higher catalytic reaction rate (3830 μmol g−1 h) than that of Ru/c-CeO2 (1289 μmol g−1 h) and Ru/p-CeO2 (529 μmol g−1 h) at the reaction temperature (400 °C) and pressure (1 MPa). The promoters (Cs, K, and Ba) effectively enhance the catalytic activity, for example, the catalytic activity of 14![[thin space (1/6-em)]](https://www.rsc.org/images/entities/char_2009.gif) 266 μmol g−1 h for 2Cs–Ru/r-CeO2 and 11
266 μmol g−1 h for 2Cs–Ru/r-CeO2 and 11![[thin space (1/6-em)]](https://www.rsc.org/images/entities/char_2009.gif) 227 μmol g−1 h for 2K–Ru/r-CeO2. These results not only demonstrate that the catalytic performance of the catalysts can be tuned by controlling the morphology of the support but also provide a novel strategy to enhance the ammonia synthesis activity via increasing the number of highly efficient planes of the support.
227 μmol g−1 h for 2K–Ru/r-CeO2. These results not only demonstrate that the catalytic performance of the catalysts can be tuned by controlling the morphology of the support but also provide a novel strategy to enhance the ammonia synthesis activity via increasing the number of highly efficient planes of the support.
Acknowledgements
This research was financially supported by the National Natural Science Foundation of China (Grant No. 21403257).References
- H. Bielawa, O. Hinrichsen, A. Birkner and M. Muhler, Angew. Chem., Int. Ed., 2001, 40, 1061–1063 CrossRef CAS.
- R. Schlögl, Angew. Chem., Int. Ed., 2003, 42, 2004–2008 CrossRef PubMed.
- B. C. McClaine, S. E. Siporin and R. J. Davis, J. Phys. Chem. B, 2001, 105, 7525–7532 CrossRef CAS.
- D. Szmigiel, H. Bielawa, M. Kurtz, O. Hinrichsen, M. Muhler, W. Raróg, S. Jodzis, Z. Kowalczyk, L. Znak and J. Zieliński, J. Catal., 2002, 205, 205–212 CrossRef CAS.
- R. Kojima and K. I. Aika, Chem. Lett., 2000, 29, 514–515 CrossRef.
- Z. W. Ma, S. L. Zhao, X. M. Xiong, B. Hu and C. L. Song, Catal. Lett., 2016, 146, 2324–2329 CrossRef CAS.
- Y. Niwa and K. Aika, Chem. Lett., 1996, 3, 3–4 CrossRef.
- Z. W. Ma, X. M. Xiong, C. L. Song, B. Hu and W. Q. Zhang, RSC Adv., 2016, 6, 51106–51110 RSC.
- X. Luo, R. Wang, J. Ni, J. Lin, B. Lin, X. Xu and K. Wei, Catal. Lett., 2009, 133, 382–387 CrossRef CAS.
- C. Pan, D. Zhang, L. Shi and J. Fang, Eur. J. Inorg. Chem., 2008, 2008, 2429–2436 CrossRef.
- H. X. Mai, L. D. Sun, Y. W. Zhang, R. Si, W. Feng, H. P. Zhang, H. C. Liu and C. H. Yan, J. Phys. Chem. B, 2005, 109, 24380–24385 CrossRef CAS PubMed.
- M. Nolan and G. W. Watson, J. Phys. Chem. B, 2006, 110, 16600–16606 CrossRef CAS PubMed.
- R. Si and M. Flytzani Stephanopoulos, Angew. Chem., Int. Ed., 2008, 47, 2884–2887 CrossRef CAS PubMed.
- M. Nolan, J. Mater. Chem., 2011, 21, 9160–9168 RSC.
- Y. Xu, J. Greeley and M. Mavrikakis, J. Am. Chem. Soc., 2005, 127, 12823–12827 CrossRef CAS PubMed.
- A. Bruix, J. A. Rodriguez, P. J. Ramirez, S. D. Senanayake, J. Evans, J. B. Park, D. Stacchiola, P. Liu, J. Hrbek and F. Illas, J. Am. Chem. Soc., 2012, 134, 8968–8974 CrossRef CAS PubMed.
- H. Tan, J. Wang, S. Yu and K. Zhou, Environ. Sci. Technol., 2015, 49, 8675–8682 CrossRef CAS PubMed.
- S. Liu, X. Wu, W. Liu, W. Chen, R. Ran, M. Li and D. Weng, J. Catal., 2016, 337, 188–198 CrossRef CAS.
- M. F. Camellone and S. Fabris, J. Am. Chem. Soc., 2009, 131, 10473–10483 CrossRef PubMed.
- Y. Gao, W. Wang, S. Chang and W. Huang, ChemCatChem, 2013, 5, 3610–3620 CrossRef CAS.
- N. Wang, W. Qian, W. Chu and F. Wei, Catal. Sci. Technol., 2016, 6, 3594–3605 CAS.
- F. Wang, C. Li, X. Zhang, M. Wei, D. G. Evans and X. Duan, J. Catal., 2015, 329, 177–186 CrossRef CAS.
- C. Fernández, C. Sassoye, D. P. Debecker, C. Sanchez and P. Ruiz, Appl. Catal., A, 2014, 474, 194–202 CrossRef.
- Z. Song, T. Cai, J. C. Hanson, J. A. Rodriguez and J. Hrbek, J. Am. Chem. Soc., 2004, 126, 8576–8584 CrossRef CAS PubMed.
- F. Rosowski, A. Hornung, O. Hinrichsen, D. Herein, M. Muhler and G. Ertl, Appl. Catal., A, 1997, 151, 443–460 CrossRef CAS.
- C. Liang, Z. Wei, Q. Xin and C. Li, Appl. Catal., A, 2001, 208, 193–201 CrossRef CAS.
- K. Zhou and Y. Li, Angew. Chem., Int. Ed., 2012, 51, 602–613 CrossRef CAS PubMed.
- R. Si, Y.-W. Zhang, S. J. Li, B. X. Lin and C. H. Yan, J. Phys. Chem. B, 2004, 108, 12481–12488 CrossRef CAS.
- G. Giri, E. Verploegen, S. C. B. Mannsfeld, S. Atahan-Evrenk, D. H. Kim, S. Y. Lee, H. A. Becerril, A. Aspuru-Guzik, M. F. Toney and Z. Bao, Nature, 2011, 480, 504–508 CrossRef CAS PubMed.
- A. Satsuma, M. Yanagihara, J. Ohyama and K. Shimizu, Catal. Today, 2013, 201, 62–67 CrossRef CAS.
- H. F. Wardenga and A. Klein, Appl. Surf. Sci., 2016, 377, 1–8 CrossRef.
- Y. Sun, Q. Liu, S. Gao, H. Cheng, F. Lei, Z. Sun, Y. Jiang, H. Su, S. Wei and Y. Xie, Nat. Commun., 2013, 4, 2899 Search PubMed.
- L. Liu, Z. Yao, Y. Deng, F. Gao, B. Liu and L. Dong, ChemCatChem, 2011, 3, 978–989 CrossRef CAS.
- J. Wang, D. N. Tafen, J. P. Lewis, Z. L. Hong, A. Manivannan, M. J. Zhi, M. Li and N. Q. Wu, J. Am. Chem. Soc., 2009, 131, 12290–12297 CrossRef CAS PubMed.
- J. C. Dupin, D. Gonbeau, P. Vinatier and A. Levasseur, Phys. Chem. Chem. Phys., 2000, 2, 1319–1324 RSC.
- Z. Hu, X. Liu, D. Meng, Y. Guo, Y. Guo and G. Lu, ACS Catal., 2016, 6, 2265–2279 CrossRef CAS.
- H. Y. Kim, H. M. Lee and G. Henkelman, J. Am. Chem. Soc., 2012, 134, 1560–1570 CrossRef CAS PubMed.
- C. T. Campbell, Nat. Chem., 2012, 4, 597–598 CrossRef CAS PubMed.
- A. P. Walker, T. Rayment and R. M. Lambert, J. Catal., 1989, 117, 102–120 CrossRef CAS.
- A. P. Walker, T. Rayment, R. M. Lambert and R. J. Oldman, J. Catal., 1990, 125, 67–76 CrossRef CAS.
- A. P. Walker and R. M. Lambert, J. Phys. Chem., 1992, 96, 2265–2271 CrossRef CAS.
- I. Rossetti and L. Forni, Appl. Catal., A, 2005, 282, 315–320 CrossRef CAS.
- Z. Li, C. Liang, Z. Feng, P. Ying, D. Wang and C. Li, J. Mol. Catal. A: Chem., 2004, 211, 103–109 CrossRef CAS.
- H. J. Lin, J. J. Tang, Q. Yu, H. Wang, L. Z. Ouyang, Y. J. Zhao, J. W. Liu, W. H. Wang and M. Zhu, Nano Energy, 2014, 9, 80–87 CrossRef CAS.
- W. Raróg-Pilecka, E. Miśkiewicz, S. Jodzis, J. Petryk, D. Lomot, Z. Kaszkur, Z. Karpiński and Z. Kowalczyk, J. Catal., 2006, 239, 313–325 CrossRef.
- I. Rossetti, L. Sordelli, P. Ghigna, S. Pin, M. Scavini and L. Forni, Inorg. Chem., 2011, 50, 3757–3765 CrossRef CAS PubMed.
- I. Rossetti, F. Mangiarini and L. Forni, Appl. Catal., A, 2007, 323, 219–225 CrossRef CAS.
- E. Truszkiewicz, W. Raróg-Pilecka, K. Schmidt-Szałowski, S. Jodzis, E. Wilczkowska, D. Łomot, Z. Kaszkur, Z. Karpiński and Z. Kowalczyk, J. Catal., 2009, 265, 181–190 CrossRef CAS.
- Z. Kowalczyk, S. Jodzis, W. Raróg, J. Zieliński and J. Pielaszek, Appl. Catal., A, 1998, 173, 153–160 CrossRef CAS.
- I. Rossetti, N. Pernicone and L. Forni, Appl. Catal., A, 2001, 208, 271–278 CrossRef CAS.
Footnote |
| † Electronic supplementary information (ESI) available. See DOI: 10.1039/c6cy02089e |
| This journal is © The Royal Society of Chemistry 2017 |

