Ethanol gas-phase ammoxidation to acetonitrile: the reactivity of supported vanadium oxide catalysts†
F.
Folco
a,
J.
Velasquez Ochoa
a,
F.
Cavani
 *ab,
L.
Ott
c and
M.
Janssen
c
aDipartimento di Chimica Industriale e dei Materiali, ALMA MATER STUDIORUM Università di Bologna, Viale del Risorgimento 4, 40136 Bologna, Italy. E-mail: fabrizio.cavani@unibo.it
bConsorzio INSTM, Research Unit of Bologna, Firenze, Italy
cLonza Ltd, 3930 Visp, Switzerland
First published on 1st December 2016
Abstract
New insights on the gas-phase ammoxidation of ethanol to acetonitrile over supported vanadia catalysts were obtained by means of reactivity experiments (in ethanol ammoxidation and oxidation) as well as in situ Raman and DRIFT spectroscopy. It was found that the rate-determining step during the redox process depends on the support type. In the case of V2O5/ZrO2, the V oxidation state under reaction conditions is closer to V5+, whereas with V2O5/TiO2, the reduction of V5+ is faster than the re-oxidation of the corresponding reduced V species by O2; thus, the V oxidation state under steady state conditions is lower than for V2O5/ZrO2. In the latter catalyst, the more oxidized V species is responsible for ammonia activation and reaction with the intermediate acetaldehyde, leading in the end to a better acetonitrile yield than with V2O5/TiO2. It was also found that V2O5/ZrO2 is more selective to acetaldehyde than V2O5/TiO2. With the former catalyst, ethanol is able to reduce V2O5 only to a limited extent. Conversely, V2O5/TiO2 is readily reduced by ethanol but this reduced V species is responsible for an unselective oxidation of the alcohol, giving more CO and CO2.
Introduction
Acetonitrile is a very versatile compound. Its unique chemical properties, such as polarity, miscibility with water, low boiling point, low acidity and low UV cut-off, make it a good solvent for the synthesis of pharmaceuticals and intermediates, oligonucleotides and peptides.1 It is also used as a reactant in chemical syntheses such as the production of malononitrile, pesticides or pharmaceuticals. Unlike other solvents, commercial acetonitrile is not the result of a direct synthesis but is mostly obtained as a by-product of the industrial-scale production of acrylonitrile. Acrylonitrile is the primary product of propylene ammoxidation, in which 2–4% acetonitrile is also formed.2 In some cases after acrylonitrile purification the waste (mostly acetonitrile) is incinerated. In a few cases, however, the acetonitrile is isolated by distillation; depending on the waste stream and the distillation capability, different acetonitrile qualities are obtained.3Late in 2008 and throughout 2009 the chemical industry experienced a severe acetonitrile shortage, because several acrylonitrile production plants were temporarily shut down. This awoke the pharma industry to the fact that a dedicated process for the synthesis of acetonitrile is needed. Possible routes for the synthesis of acetonitrile include:
(a) Reaction between CO, NH3 and H2; the reaction is carried out in the gas phase using a molybdenum or iron catalyst supported over silica, as described in Monsanto patents.4,5 Various mechanisms have been proposed for this reaction in the literature.6,7
(b) Hydrocyanation of C1–C2 compounds; in this process methane reacts with HCN without a catalyst, at 900 °C, to produce acetonitrile and hydrogen.8,9 In an alternative process, acetylene reacts with ammonia in the presence of a catalyst to produce acetonitrile.
(c) Ethane2,10–19 or ethylene20–23 ammoxidation; catalysts for ethane ammoxidation include mixed Nb/Sb oxides, Nb-promoted Ni oxides, Co-exchanged zeolites, Cr-exchanged zeolites and zeolite-supported Sb oxides. Because of the better yields obtained, ethane ammoxidation is the preferred route. Recently Alzchem claimed to have started a gas-phase ammoxidation process for the production of acetonitrile.24
An alternative acetonitrile process based on a renewable source might make use of ethanol as the reactant. In general, the ammoxidation of alcohols has been much less discussed in the literature than other substrates, with the very few examples limited to the liquid-phase ammoxidation of benzyl alcohol,25–29 glycerol and ethanol, and to the gas-phase ammoxidation of glycerol30 and ethanol.31–34 Indeed, ethanol ammoxidation can be carried out in the same reactor and process where propylene is ammoxidized into acrylonitrile. The conditions for the ammoxidation of ethanol are claimed to be not very different from those necessary for conducting propylene ammoxidation, while the co-feeding of ethanol and propylene has been proposed as a tool to increase the acetonitrile/acrylonitrile selectivity ratio.35,36
Table S1 (in ESI†) summarizes the results reported in the literature on the gas and liquid-phase ammoxidation of primary alcohols to nitriles. In some cases the mechanism proposed includes the formation of carboxylic acid, then amide, which, in turn, is dehydrated to nitrile.33 In other cases the mechanism proposed is either via aldehyde, imine and final oxidehydrogenation to nitrile27–29,31,32 or via an exchange between water and ammonia with the formation of amine and subsequent oxidehydrogenation to nitrile.31 Mizuno et al. have recently published several papers discussing synthetic procedures for the aerobic preparation of nitriles and the direct synthesis of primary amides (where the latter are formed by hydration of nitriles). The catalysts described are based not only on Ru(OH)3-alumina, but also on manganese oxide-based octahedral molecular sieves (KMn8O16: OMS-2).37 Manganese oxide is also a catalyst for the oxidative desulphurization of primary thioamides into the corresponding nitriles,38 while Ru hydroxide is a catalyst for the oxidative transformation of primary azides into nitriles.39 Ishida et al.25 reported that in the liquid-phase ammoxidation of benzyl alcohol catalyzed by CeO2-supported Au, a key intermediate is hemiaminal, which is obtained by the addition of ammonia to the carbonyl bond of benzaldehyde. The hemiaminal can either be oxidehydrogenated to an amide or dehydrated to an imine and then oxidehydrogenated to nitrile. Other procedures for the ammoxidation of alcohols (especially aryl alcohols) to give nitriles entail conventional methods of organic synthetic chemistry; see, for instance, the several methods cited in ref. 40 and 41, which use properly selected oxidants and reagents as N sources.
Finally, it is worth mentioning the gas-phase ammonolysis of ethanol, carried out over Ni-based catalysts.42
In this paper, we report on the chemistry of the gas-phase ammoxidation of ethanol to acetonitrile, by means of catalysts based on supported vanadium oxide. These catalysts were chosen because they had already been described in the past as excellent systems for gas-phase ammoxidation of alkylaromatics to aromatic nitriles, but were never tested for alcohol ammoxidation.43–48 Another aim of this work is to contribute to the understanding of the interaction between the substrate and the V species and the role of the rate determining step on the catalytic performance of V oxide-based catalysts for selective oxidation reactions.
Experimental
Catalysts were prepared by means of wet impregnation: the appropriate amount of NH4VO3 was dissolved in water at 40 °C and the support was added to the solution. The support was either ZrO2 synthesized in the lab (26.5 m2 g−1 after calcination at 450 °C) or TiO2 (anatase supplied by CristalACTiV™ DT-51, 22.0 m2 g−1) (see Table S2†). The suspension was stirred for 1 h and then dried in a rotavapor. Afterwards it was heated to 120 °C for 3 h and then calcined at 450 °C for 5 h with a 10 °C min−1 rate. The amount of vanadia loaded (7 wt%) corresponds to approximately 2 and 3 monolayers for V2O5–ZrO2 (catalyst code V/Zr/O, surface area 24.2 m2 g−1) and V2O5–TiO2 (catalyst code V/Ti/O, surface area 21.3 m2 g−1), respectively.The tubular type quartz reactor had an internal diameter of 0.8 cm and an overall length of 46 cm. The catalytic bed was positioned at mid-height, corresponding to the isothermal zone of the furnace. The catalyst was held on a porous septum of sintered glass. A stainless steel internal tube with a diameter of 1/16′′ contained a thermocouple which made it possible to measure the temperature at different heights inside the catalytic bed. The temperature at the reactor exit was maintained at 200 °C by means of a heating strip. The W/F ratio (W = catalyst weight; F = overall inlet gaseous flow rate, calculated at normal conditions) was typically in the range of 0.1–1.0 g s mL−1.
The ethanol used for the reactivity experiments was an azeotropic mixture, in order to simulate a process in which the azeotrope, and not pure ethanol, would be used.
The analysis of the effluent stream was carried out via on-line sampling and injection into a HP 5890A gas chromatograph with two columns. The first column was a semicapillary HP Plot U, 30 m long, with an internal diameter of 0.53 mm, a 20 μm thick fixed phase and a maximum allowed temperature of 190 °C. This column was used to separate ethanol, ammonia, carbon dioxide, water, acetaldehyde, acetonitrile and other C-containing by-products (hydrocyanic acid and other nitriles). The second column was a semicapillary HP Molesieve, 30 m long, with an internal diameter of 0.53 mm and a maximum allowed temperature of 300 °C. This column was used to separate oxygen, nitrogen and carbon monoxide. The two columns were joined to a splitter/union and the combined flow was conveyed to the thermal-conductivity detector. The GC oven temperature was programmed as follows: 6.8 min at 60 °C, heating rate 40 °C min−1 up to 100 °C, isothermal operation for 8.5 min, heating rate 60 °C min−1 up to 130 °C, isothermal operation for 5 min, final heating rate 60 °C min−1 up to 170 °C, final isothermal operation for 8 min.
Raman studies were performed using a Renishaw 1000 instrument, equipped with a Leica DMLM microscope and a laser source Argon ion (514 nm) with a power of 35 mW. In situ Raman experiments were carried out by loading 5–10 mg of the catalyst into the Raman cell (Linkam TS1500) under a stream of ethanol vapour in He or air.
For in situ diffuse-reflectance-Fourier-transform-spectroscopy (DRIFTS) experiments, the sample was pre-treated at 450 °C in a He flow (10 mL min−1) for 45 min, in order to remove any molecules adsorbed on the material. Then the sample was cooled to 85 °C, and ethanol was fed at 0.6 μL min−1 for 15 min using He or air as the carrier. Following this, the carrier gas was left to flow until weakly adsorbed ethanol was evacuated; then the temperature was raised to 400 °C at 5 °C min−1. Spectra were recorded every 50 °C using the spectrum of the catalyst without adsorbed ethanol as a background. IR Spectra were recorded using an MCT detector with 128 scans and 2 cm−1 resolution on a Bruker Vertex 70 using a Pike DiffusIR cell attachment. The desorbed products were monitored by on-line mass spectrometry using an GeneSys Evolution from European Spectrometry Systems.
Surface area of the catalysts was measured with a Micromeritics ASAP2020 instrument. TPR experiments were carried out using a TPD/TPR/TPO Micromeritics instrument. 30–50 mg of sample were pretreated at 200 °C under a He flow. After cooling down to 50 °C, a mixture of 5% H2 in He was used and after 20 min the temperature program started: from 50 to 800 °C at 5 °C min−1, 800 °C for 30 min.
Results and discussion
Catalytic behaviour of V2O5/ZrO2 and V2O5/TiO2 catalysts in ethanol ammoxidation
Experiments were carried out with two supported catalysts containing the same amount of V2O5 (7 wt%) dispersed on either ZrO2 (monoclinic) (catalyst code V/Zr/O) or TiO2 (anatase) (catalyst code V/Ti/O). The two catalysts had comparable surface areas (see Table S2†). The amount of vanadia loaded corresponds to approximately 2 and 3 monolayers for V/Zr/O and V/Ti/O, respectively. First of all, it should be noted that V/Ti/O catalysts with approximately 1 monolayer of V2O5 displayed a lower activity than the catalysts containing more V, but the distribution of products was similar and the maximum acetonitrile yield was identical. It was thus decided to investigate the performance of the two catalysts containing 7% V2O5 in detail.Moreover, it should be mentioned that H2-TPR experiments (Fig. S1 in ESI†) showed different reduction profiles for both V/Ti/O and V/Zr/O compared to the corresponding profiles of samples obtained by mixing 7% V2O5 with either the TiO2 or the ZrO2 support and then calcining the corresponding powder mixtures at 450 °C. Despite the relatively high amount of V2O5 (ca. 2–3 monolayers of V oxide), a modification of the redox properties of V5+ due to the interaction between the dispersed V species and the support was observed compared to bulk V2O5.
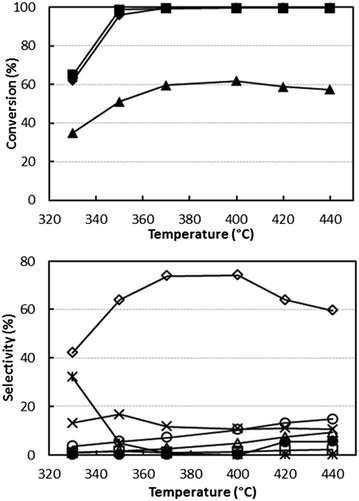
Fig. 1 shows the catalytic behaviour of V/Zr/O at 0.1 g s mL−1W/F ratio using an ethanol/ammonia/oxygen feed composition (mol%) of 5/6/6, i.e. a reactant ratio close to the stoichiometric ratio for acetonitrile synthesis (1/1/1), but with a slight excess of both oxygen and ammonia. This component ratio was chosen to maximize the reactant conversion, while limiting the formation of over-oxidized products (CO, CO2 and N2) and the consumption of ammonia.
The data show that complete ethanol and oxygen conversions were obtained at 350–370 °C with an acetonitrile yield of 73–74%. By-products of the reaction were ethylene, CO, CO2 and HCN. At 330 °C acetaldehyde selectivity was very high, but it decreased when the temperature was raised with a concomitant increase of selectivity to acetonitrile. The carbon balance was close to 100%, which indicates that no heavy compounds were formed. The achieved yield to acetonitrile was lower than the yields reported in the literature with vanadyl pyrophosphate and SAPO/VAPO catalysts.31,33 It is worth mentioning, however, that we tried to replicate the catalysts and conditions reported in those papers, but obtained selectivity values far lower than those claimed.
Another set of experiments was conducted by increasing the partial ammonia pressure in an attempt to increase acetonitrile yield (ethanol/ammonia/oxygen mol% 5/13/6). Nevertheless, the maximum yield achieved was still 73–74% at 370–390 °C and at total ethanol conversion (see Fig. S2†). In this case, at low temperature the ethanol conversion was significantly less than in the tests carried out at lower ammonia partial inlet pressure. This clearly indicates that ammonia and ethanol compete for adsorption and activation over the same type of active sites. The distribution of products was not different from that shown in Fig. 1. In the low temperature range (T < 350 °C), the selectivity to by-products, with the exception of CO2, was zero; at higher temperatures, selectivity to CO, ethylene, HCN and N2 (the latter deriving from ammonia combustion) increased, whereas that to CO2 decreased slightly.
In another set of experiments, the partial pressure of all reactants was increased in order to increase acetonitrile production. Results are reported in Fig. S3.† In this case, the best yield to acetonitrile was slightly lower, 70–71% at 400 °C, and the same was true for ethanol conversion (compare Fig. 1, S2 and S3†), probably due to a surface saturation effect; nevertheless, the production of acetonitrile was considerably enhanced: 2.5 kgEtOH kgcat h−1 for the conditions of Fig. 1 and S2† compared to 4.8 kgEtOH kgcat h−1 for the conditions of Fig. S3.†
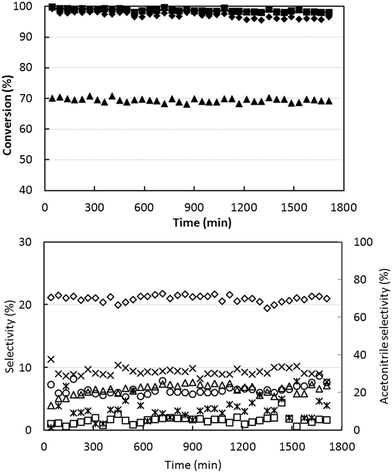
To check the stability of the catalytic performance, we tested the short-term lifetime of the catalyst, using ethanol-rich conditions at 400 °C (temperature at which the best yield was obtained). Results are shown in Fig. 2. There was a slow initial deactivation effect, with a slight decline in ethanol conversion during the first 15–20 h; afterwards, the performance was stable. The selectivity to acetonitrile remained stable at approximately 70%.
The results obtained indicate that acetaldehyde is the key reaction intermediate, since no acetic acid was detected under any of the reaction conditions investigated. It can be inferred that acetaldehyde reacts with activated ammonia to yield ethanimine, which is then oxidehydrogenated to nitrile. Experiments conducted using different contact times will confirm the role of acetaldehyde as the key reaction intermediate (see below).
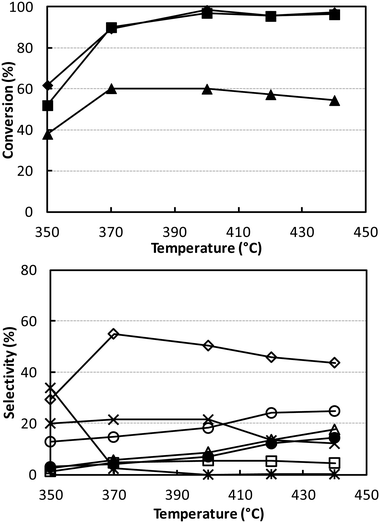
Fig. 3 shows the catalytic performance of V/Ti/O under the same conditions as shown in Fig. 1 (W/F 0.1 g s mL−1; ethanol/ammonia/oxygen feed composition 5/6/6 mol%). Results show that this catalyst was less active than V/Zr/O, a phenomenon which may in part be attributed to the lower surface area of V/Ti/O. The main difference was in the distribution of products. The best selectivity to acetonitrile was lower (55% at 90% ethanol conversion), with a higher selectivity to all by-products, especially CO and CO2. The combustion of ammonia to N2 was also much greater than with V/Zr/O.
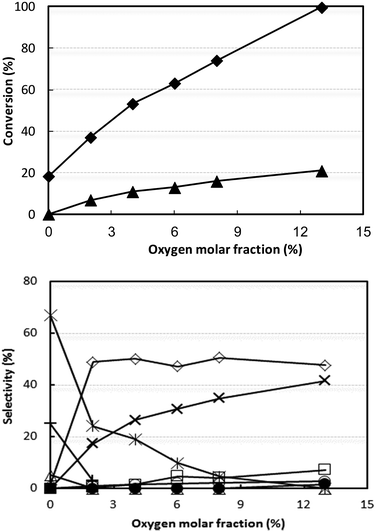
Even when conditions were drastically changed, for example, by increasing both ammonia and oxygen concentrations as well as the contact time, the best acetonitrile yield achieved was still only approximately 50% (Fig. S4†). Since V/Ti/O was more selective than V/Zr/O to CO, CO2 and HCN and less selective to acetonitrile, we hypothesised that oxygen might play an important role in determining the selectivity. We therefore investigated the effect of partial oxygen pressure with V/Ti/O, with the aim of limiting oxidative degradation by the use of a lower O2 partial pressure in the feed. The results of these experiments are shown in Fig. 4; the other conditions were the same as those used in Fig. S4† at 320 °C.
It is shown that ethanol was converted even in the absence of oxygen, producing acetaldehyde and ethane by means of a disproportionation reaction, known to occur with reduced Vanadium oxide catalysts:49,50
| 2CH3CH2OH → CH3CHO + C2H6 + H2O |
Adding oxygen led to a progressive decrease in the formation of acetaldehyde and ethane and to a corresponding increase in CO2 (conversely, the yield to CO remained very low). The selectivity to acetonitrile showed a steep rise when 2% oxygen was added in the feed, but remained constant over further increases in oxygen content.
These experiments indicate that in the absence of oxygen, but in the presence of ammonia, the catalyst converts ethanol into acetaldehyde. The latter, however, does not react with ammonia (ammonia conversion in the absence of oxygen was negligible), thus indicating that ammonia needs oxygen in order to be activated. We thus conclude that the activation of ammonia most likely occurs on oxidized V sites. Further experiments (discussed below) show that in the absence of oxygen the V species in V/Ti/O is very quickly reduced.
Therefore, the presence of oxygen has several effects: (i) it contributes to ethanol conversion by providing an alternative route to acetaldehyde, via oxidehydrogenation; (ii) it catalyzes the combustion of acetaldehyde into CO2; the rate of CO2 formation is almost directly proportional to the oxygen content in the inlet feed; (iii) it generates active sites for the reaction between acetaldehyde and activated ammonia to produce acetonitrile.
With this catalyst, however, the best selectivity to acetonitrile was still no higher than 50%, at both very low (2%) and high (13%) O2 partial pressure. Therefore, a low (but not zero) partial oxygen pressure permits a rapid conversion of acetaldehyde into both acetonitrile and CO2. A further increase in O2 concentration, however, only increased the rate of acetaldehyde transformation into CO2 and, to a lesser extent, into CO and HCN. This can be attributed to the limited number of active sites which are capable of activating ammonia. In fact, the experiments conducted with different contact times (Fig. S5†) confirmed that acetaldehyde undergoes consecutive transformations into both acetonitrile and CO2 (and to a lesser extent into CO and HCN).
The results discussed above show that the superior performance of V/Zr/O, compared to V/Ti/O, is due in part to its greater efficiency in the conversion of acetaldehyde into acetonitrile, together with lower formation of both CO2 from acetaldehyde combustion and N2 from ammonia combustion. Another difference between the two systems may be the different efficiencies in the conversion of ethanol into acetaldehyde. In order to gain more information on this step of the process, we compared the reactivity of the catalysts in ethanol oxidation.
It is also worth noting that zirconia-supported vanadium oxide catalysts have been reported to give better performance in ammoxidation reactions, specifically for toluene and picoline.51–53 The same type of catalyst was also used in several oxidation reactions, such as ethanol to acetaldehyde,54,55 methanol to formaldehyde56–58 and alkane oxidehydrogenation to olefins.58–64 In general, various catalysts based on supported vanadium oxide have been described for ethanol oxidation.65–69
Catalytic behaviour in ethanol oxidation
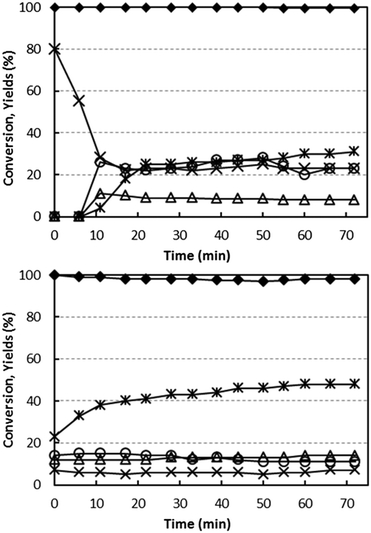
Fig. 5 compares the performance of the two catalysts as a function of time, at 400 °C with a feed stream containing 5% ethanol and 6% oxygen. These conditions were chosen to simulate the best conditions for ammoxidation (feed concentrations) and for yield to acetonitrile (temperature). Variation in the catalytic behaviour of the catalyst under these conditions would indicate a progressive change in the nature of V sites during reaction.Using both catalysts, the conversion of ethanol was total or almost total throughout the entire reaction time. Considerable differences, however, were seen in the selectivity. In the case of V/Zr/O (Fig. 5 bottom), acetaldehyde selectivity increased from 23% (for the freshly oxidized catalyst) up to a stable value of 48% for the “equilibrated” catalyst; minor changes were seen over time for CO, CO2 and also for ethylene. The formation of H2 (4% yield, decreasing over time) was also observed. Along with the increase in acetaldehyde formation, an improved C balance was observed after longer reaction times. This indicates that some products were retained on the fresh catalyst surface and were responsible for the poor C balance observed.
In the case of V/Ti/O, the fresh catalyst was highly selective to CO2, with no other products detected in the outlet stream; over time the selectivity to CO2 decreased, whereas that to CO and acetaldehyde increased; H2 did not form using this catalyst. However, the final selectivity to acetaldehyde was only 35%.
With both catalysts, some minor products were formed (not shown in figure): ethane, diethylether, acetone and propylene, with an overall selectivity between 10 and 15% for V/Zr/O and approximately 5% for V/Ti/O.
These experiments demonstrate that the two catalysts differ greatly in regard to the redox behaviour. The fresh V/Ti/O is unselective, but this changes notably during reaction in the presence of ethanol and oxygen, and it becomes progressively more selective to acetaldehyde. The considerable change in the observed catalytic behaviour may be related to a change in the nature of the active V sites; the fully oxidized (and unselective) V sites become progressively more reduced and thus more selective to the formation of acetaldehyde and CO and less to the formation of CO2. However, even under best conditions, this catalyst is less selective than V/Zr/O. Conversely, with V/Zr/O, catalyst changes have less effect on the product distribution, which indicates that the active V sites do not undergo important modifications on exposure to the reactant stream. These differences may be explained by taking into account a different type of rate-determining step in the redox process. In V/Ti/O, V5+ reduction (by ethanol) is faster than the re-oxidation of the reduced V species, giving rise to a working V species which, under steady-state conditions, is strongly reduced. The opposite is true for V/Zr/O, where the rate-determining step is the reduction of the V species, and the working V species is fully or almost fully oxidized.
The nature of active sites may be very different in the absence or presence of ammonia, meaning that this result cannot be used directly to interpret ammoxidation results. Nevertheless, it is reasonable to assume that the different performance shown during ethanol oxidation to acetaldehyde may also be one reason for the lower selectivity to acetonitrile observed during ethanol ammoxidation with V/Ti/O. In fact, acetaldehyde is the key intermediate in this reaction. Comparing Fig. 1 (V/Zr/O) and Fig. 3 (V/Ti/O), it can be seen that for an ethanol conversion of around 60% (achieved at 330 °C for the former catalyst and at 350 °C for the latter), the overall selectivity to acetaldehyde + acetonitrile is 75% for V/Zr/O and 65% for V/Ti/O.
It is also worth noting that both bare supports, used at the same conditions as for Fig. 5, led to ethanol conversions close to 90%, with the following distribution of products (registered after 6 h time-on-stream):
a) TiO2: 26% selectivity to acetaldehyde, 18% to CO2, 9% to ethylene, 36% C loss, and minor formation of crotonaldehyde, ethylacetate, butene and acetone.
b) ZrO2: 23% selectivity to acetaldehyde, 25% to CO2, 8% to ethylene, 30% C loss, and minor formation of acetone, crotonaldehyde, butene and ethylacetate.
Therefore, it seems that the role of V is not only that one of facilitating ethanol conversion, but also of improving the selectivity to acetaldehyde, while decreasing the formation of heavy compounds responsible for the C loss registered.
Catalytic behaviour in the anaerobic oxidation of ethanol
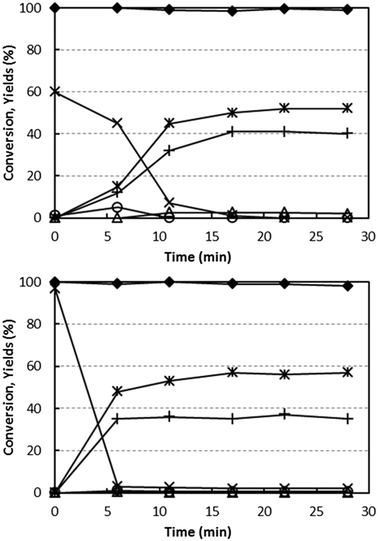
The reducibility of V/Zr/O and V/Ti/O by alcohol was studied via experiments at a fixed temperature (400 °C) and a feed stream of 5% ethanol/N2. As with the O2 co-feeding experiments, the relative concentrations of products as a function of time were measured (Fig. 6). This enabled us to calculate the extent of V reduction, assuming that all V in the freshly calcined V/Zr/O and V/Ti/O was present as V5+.With both catalysts, ethanol conversion was total or almost total throughout the entire experiment time. In the case of V/Ti/O, initially only CO2 and H2O were produced, with a CO2 yield close to 60%, which decreased close to 0% after approximately 15 min reaction time. Based on the stoichiometry of ethanol combustion, the extent of V5+ reduction can be calculated from the amount of O2− released from V2O5. It was found that all the V5+ present in the fresh catalyst was reduced to (almost) metallic V under the conditions investigated. At the same time, the formation of CO2 decreased while acetaldehyde and ethane became the predominant products, with formation of small amounts of ethylene (selectivity 3%). Thus, the disproportionation of ethanol was the only reaction occurring on the completely reduced catalyst. It is worth noting that this latter reaction occurs with no oxygen ion exchange between ethanol and the catalyst.
In the case of V/Zr/O, a similar phenomenon occurred. However, the initial formation of CO2 (the only product at the very beginning of the reaction) lasted only a few minutes – after just 6 min it had totally disappeared. This indicates a limited extent of reduction of V5+, no higher than 40%. Ethane and acetaldehyde were the predominant products after a few minutes' reaction time, with minor formation of ethylene (selectivity < 1%) and acetone (3%). After the initially unsteady behaviour, the reaction was shown to be stable for 2 h. With both catalysts, the formation of H2 was very low (yield lower than 1%).
These experiments demonstrate that ethanol is able to reduce V5+ both in V/Ti/O and V/Zr/O. In the absence of oxygen, the oxidized V species selectively forms CO2, but upon reduction CO2 formation is prevented and the disproportionation of ethanol becomes the main reaction. However, the extent of V5+ reduction in the two catalysts is quite different: it is totally reduced with V/Ti/O, whereas with V/Zr/O only a partial reduction occurs.
Raman spectroscopy study of catalysts
In order to support the hypothesis proposed above, we characterized the systems by means of in situ Raman and DRIFT spectroscopies.The Raman spectra of the two catalysts recorded under N2 flow at increasing temperature are shown in Fig. 7. After heating, the samples were maintained at 400 °C for several hours, first under N2 and then under air. For both samples, no further changes in the Raman spectra were observed after the end of the temperature ramp.
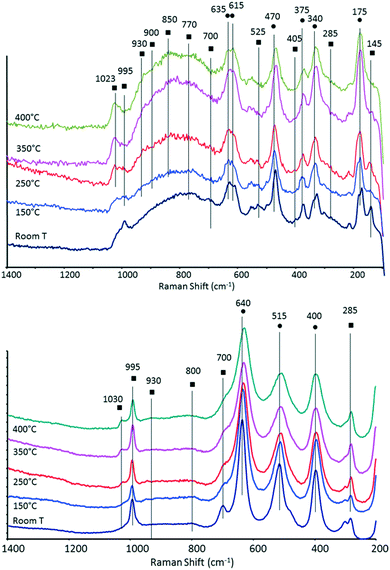 | ||
| Fig. 7 In situ Raman spectra recorded under N2 flow at increasing temperature for V/Zr/O (top) and V/Ti/O (bottom) (● bands attributable to ZrO2 or TiO2; ■ bands attributable to V oxide). | ||
It is well known that the structure of vanadia species supported on zirconia and titania depends on VOx surface density. Supported VOx species form polyvanadate domains of increasing size as well as monolayers and clusters as the vanadium surface density increases. Crystalline V2O5 appears when vanadia loading exceeds an apparent surface density of 7–8 V atoms per nm2.60,61,70–72
In the case of V/Zr/O, the broad band at around 995 cm−1 recorded at room temperature is attributable to bulk vanadium oxide; other Raman bands of bulk V2O5 were shown at around 700, 525, 405, 285 and 145 cm−1. However, when heating the sample, a band at 1023 cm−1 became predominant (not shown at room temperature), which may be attributed to the symmetric stretch of a terminal mono-oxo V![[double bond, length as m-dash]](https://www.rsc.org/images/entities/char_e001.gif) O bond present in dispersed and dehydrated polyvanadate species (this band shifts from 1017 cm−1 for tetrahedral monomeric vanadate species to 1036 cm−1 for polyvanadate species).53,54,56,60,61,70,72,73 At the same time, the intensity of bands attributable to bulk V2O5 progressively decreased. It is important to note that when the sample was left for several hours at high temperature, no changes in the spectrum appeared. If the heating was carried out in air (instead of in N2) there was again a progressive disappearance of bands attributable to bulk V oxide, albeit at higher temperatures than with N2. Xie et al. reported that changes in the IR spectra in a 12% V2O5/SiO2 catalyst were due to the loss of oxygen and the consequent formation of nonstoichiometric V suboxides, an event which may occur even in an oxidizing environment.74 On the other hand, it cannot be ruled out that a partial spreading of vanadium oxide onto the ZrO2 surface might also have contributed to the change of spectrum. However, it should be mentioned that in our case the phenomena recorded were quite reversible upon the cooling and rehydration of the sample, an observation which contrasts with the formation of V suboxides.
O bond present in dispersed and dehydrated polyvanadate species (this band shifts from 1017 cm−1 for tetrahedral monomeric vanadate species to 1036 cm−1 for polyvanadate species).53,54,56,60,61,70,72,73 At the same time, the intensity of bands attributable to bulk V2O5 progressively decreased. It is important to note that when the sample was left for several hours at high temperature, no changes in the spectrum appeared. If the heating was carried out in air (instead of in N2) there was again a progressive disappearance of bands attributable to bulk V oxide, albeit at higher temperatures than with N2. Xie et al. reported that changes in the IR spectra in a 12% V2O5/SiO2 catalyst were due to the loss of oxygen and the consequent formation of nonstoichiometric V suboxides, an event which may occur even in an oxidizing environment.74 On the other hand, it cannot be ruled out that a partial spreading of vanadium oxide onto the ZrO2 surface might also have contributed to the change of spectrum. However, it should be mentioned that in our case the phenomena recorded were quite reversible upon the cooling and rehydration of the sample, an observation which contrasts with the formation of V suboxides.
A very broad peak occurred between 950 and 700 cm−1. In this range, various bands could be seen which shift and change intensity upon heating. For example, Raman bands at around 825, 860 and at 920–950 cm−1 have been attributed to the presence of polyvanadate species, and specifically to V–O–V stretching modes;60,61 broad Raman bands at around 800 and 930 cm−1 were associated with the vibration of bridging V–O–V bonds and bridging V–O–Zr bonds, respectively.70 In general, however, a broad peak in the 950–700 cm−1 range represents a wide set of configurations, arising from a distribution of V–O stretching modes within polyvanadate domains, such as V–O–V and V–O–Zr modes. The number of these domains is affected by changes in the coordination around V atoms, which in turn affects the bond order.60 The broad band recorded between 700 and 800 cm−1 might be assigned to a ZrV2O7 phase; however, this compound is typically characterized by sharp bands at 775 and 975–982 cm−1 and the latter is not seen in our spectra. ZrV2O7 is known to form by reaction between monoclinic zirconia and vanadium oxide, especially for high V2O5 loadings and at high temperatures, as a consequence of zirconium migration into V2O5 crystallites.60,71,75 The other bands are attributable to zirconia. For example, the Raman band at around 340 cm−1 is typical of monoclinic ZrO2.54
In the case of V/Ti/O, bands attributable to bulk vanadium oxide were also observed at room temperature at 995, ca. 700, 525, 405 (these two latter are overlapped by TiO2 bands), 285 and 145 cm−1. The intensity of some of these bands declined when the temperature was raised, with a concomitant increase in the intensity of the peak assigned to the terminal V![[double bond, length as m-dash]](https://www.rsc.org/images/entities/char_e001.gif) O bond in dehydrated and dispersed polyvanadate species at 1030 cm−1. Surface polyvanadate functionalities (broad Raman band at around 930–940 cm−1) were also observed, albeit very weak.72
O bond in dehydrated and dispersed polyvanadate species at 1030 cm−1. Surface polyvanadate functionalities (broad Raman band at around 930–940 cm−1) were also observed, albeit very weak.72
The Raman spectra were also recorded while heating samples under an ethanol/air feed, with an equimolar alcohol![[thin space (1/6-em)]](https://www.rsc.org/images/entities/char_2009.gif) :
:![[thin space (1/6-em)]](https://www.rsc.org/images/entities/char_2009.gif) oxygen ratio (Fig. 8). The spectrum of V/Zr/O remained the same as that recorded under a N2 flow (even after several hours at 400 °C under reaction conditions), whereas V/Ti/O showed the progressive disappearance of all bands attributable to V2O5, possibly as a result of the reduction of vanadium oxide.
oxygen ratio (Fig. 8). The spectrum of V/Zr/O remained the same as that recorded under a N2 flow (even after several hours at 400 °C under reaction conditions), whereas V/Ti/O showed the progressive disappearance of all bands attributable to V2O5, possibly as a result of the reduction of vanadium oxide.
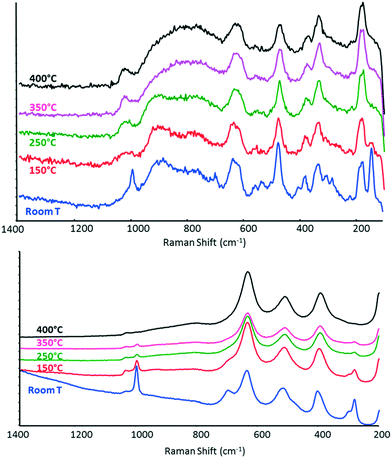 | ||
| Fig. 8 In situ Raman spectra recorded under 5% ethanol/air flow at increasing temperature for V/Zr/O (top) and V/Ti/O (bottom). | ||
This difference in the behaviour of the two catalysts is attributable to the different rate-limiting steps in the redox reaction to form the key intermediate, acetaldehyde. With V/Zr/O, the rate-limiting step seems to be the reduction of the V5+ species by ethanol, whereas with V/Ti/O, the rate-limiting step appears to be V reoxidation. In other words, under reaction conditions V/Ti/O shows a constant level of V oxidation that is lower than that shown by V/Zr/O. In agreement with these findings, Christodoulakis et al.60 observed some significant changes of all bands attributable to V–O under reduction with propane at 500 °C in case of supported vanadium oxide catalysts. However, significantly higher degrees of reduction of VOx species were observed with TiO2- than with ZrO2-supported catalysts. Wachs et al.72 compared different vanadia-supported catalysts for n-butane oxidation. With V2O5/ZrO2, the Raman intensities of the terminal V![[double bond, length as m-dash]](https://www.rsc.org/images/entities/char_e001.gif) O bond and polymeric vanadate functionalities decreased somewhat due to the reduced surface vanadium oxide species, while the bulk vanadium oxide was not affected. Conversely, in the case of V2O5/TiO2, the Raman intensities of surface vanadium oxide functionalities decreased. Burcham et al.56 reported that upon the introduction of a methanol/O2/He gas stream, both the terminal V
O bond and polymeric vanadate functionalities decreased somewhat due to the reduced surface vanadium oxide species, while the bulk vanadium oxide was not affected. Conversely, in the case of V2O5/TiO2, the Raman intensities of surface vanadium oxide functionalities decreased. Burcham et al.56 reported that upon the introduction of a methanol/O2/He gas stream, both the terminal V![[double bond, length as m-dash]](https://www.rsc.org/images/entities/char_e001.gif) O and bridging V–O–V bands decreased in intensity and shifted to lower wavenumbers for all supported vanadia catalysts. Su and Bell71 reported that for V2O5/ZrO2 catalysts, the partial reduction of the dispersed vanadia species alters the Raman spectra; the ratio of intensity of the zirconia bands to intensity of vanadia bands increased. This phenomenon was not observed in our V/Zr/O sample, thus supporting the hypothesis that vanadium oxide was less reduced under our conditions.
O and bridging V–O–V bands decreased in intensity and shifted to lower wavenumbers for all supported vanadia catalysts. Su and Bell71 reported that for V2O5/ZrO2 catalysts, the partial reduction of the dispersed vanadia species alters the Raman spectra; the ratio of intensity of the zirconia bands to intensity of vanadia bands increased. This phenomenon was not observed in our V/Zr/O sample, thus supporting the hypothesis that vanadium oxide was less reduced under our conditions.
When the same experiment was carried out with ethanol only (diluted in He), the two catalysts showed similar behaviours (Fig. S6†); both showed a progressive decrease in the intensity of all bands – those attributed to V oxide and also those attributed to the support (zirconia or titania) – which almost disappeared at high temperature. At the same time strong bands attributable to carbonaceous compounds appeared at around 1340 and 1585 cm−1. This phenomenon, however, was quite reversible (Fig. S7†). In fact, carbonaceous compounds desorbed completely when the ethanol stream was replaced by a N2 stream at 400 °C and the spectrum returned almost to that of the original catalyst. In the case of V/Zr/O, bands attributable to V oxide as well as to the support appeared again, whereas in case of V/Ti/O, only bands attributable to anatase were observed.
From these results it can be concluded that:
a) In the absence of oxygen, ethanol is strongly retained on the catalyst surface, forming adsorbed species which are easily desorbed at 400 °C under a nitrogen feed. Conversely, when oxygen is present, no compounds are retained on the catalyst surface; they are transformed into products and rapidly desorb into the gas-phase.
b) In the absence of oxygen, on V/Ti/O the adsorbed ethanol easily desorbs into the gas phase under a nitrogen feed, but in doing so O2− ion from the V–O site is picked up and the V ion reduced, while ethanol is oxidized. Therefore, under the conditions used, ethanol acts as a reductant towards V ions. In contrast, on V/Zr/O, desorption occurs with no (or only partial) V reduction.
It is evident that the support plays a key role and greatly affects the catalytic behaviour of the catalyst. The role of supports in V oxide catalysts has been highlighted by several authors in the literature.55,60,72,76 Tian et al. reported that for various vanadia-supported catalysts used for alkane oxidation, the support cation is a potent ligand that directly influences the reactivity of the V–O-support species, the catalytic active site, by controlling its basic character via the electronegativity of the support.70 Even the acid-basic features of the support can affect reactivity. For example, Enache et al.63,64 reported that in ethane oxidation over titania- and ZrO2-supported V oxides, the greater selectivity to acetic acid observed with the former system was due to the stronger retention of acetic acid over the more basic ZrO2 support.
In conclusion, Raman experiments made it possible to highlight the different redox properties of V species in V/Zr/O and V/Ti/O catalysts. In the case of V/Zr/O, the V species is less easily reduced by ethanol and the catalyst works, on average, in a highly oxidized state during ethanol oxidation. Conversely, the V2O5 in V/Ti/O is more easily reduced and the V species works, on average, in a more reduced state. The presence of more oxidized V sites in V/Zr/O may be important in the activation of ammonia during ethanol ammoxidation, as hypothesized in the discussion above.
After ethanol oxidation experiments, used catalysts were characterized by Raman spectroscopy; the spectra are shown in Fig. S8.† It can be seen that V/Ti/O was indeed strongly reduced, whereas V/Zr/O appeared to be mostly in its oxidized form; bands attributable to V2O5 were clearly seen. This further supports the hypothesis that in case of V–Zr–O, V sites still were oxidised after reaction and were not covered by coke.
Experiments carried out using DRIFT spectroscopy under oxidation conditions with ethanol provide further support for the mentioned hypothesis and are discussed, see below.
DRIFT spectroscopy study of catalysts
Temperature-programmed ethanol desorption was recorded by in situ DRIFT spectroscopy; the spectra are shown in Fig. 9. In these experiments, the carrier was air.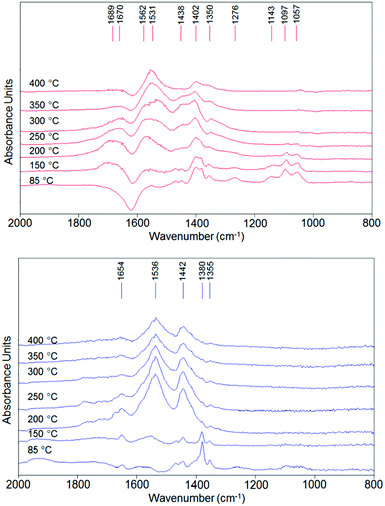 | ||
| Fig. 9 DRIFT spectra recorded during ethanol temperature-programmed-desorption using air as carrier (10 mL min−1) for V/Zr/O (top) and V/Ti/O (bottom). | ||
In the low temperature range (85–150 °C), the band for chemically bound ethanol (1380 cm−1δsCH3) was dominant in the spectrum of V/Ti/O, while the spectrum of V/Zr/O showed bands corresponding to ethoxy species (dissociated ethanol, 1057, 1097 and 1143 cm−1, ν(as)C–Obident, ν(as)C–C and ν(as)C–Omonodent, respectively)77 and a negative band at 1630 cm−1 (δ H–O–H), indicating that water is desorbed from the catalyst. The desorption of water suggests an oxidative dehydrogenation over V/Zr/O which is not observed in the case of V/Ti/O. With increasing temperature, several broad bands appeared in the spectra of both catalysts. The bands at 1350–1355, 1438–1442 and 1531–1536 cm−1 correspond to the stretching of acetate-like moieties (δsCH3, ν(as)O–C–O, ν(s)O–C–O, respectively);78 they seem to be the predominant surface species in the case of V/Ti/O at 200 °C, but at higher temperatures the intensity of the bands simply decreased. However, in the case of V/Zr/O there are additional bands especially in the C![[double bond, length as m-dash]](https://www.rsc.org/images/entities/char_e001.gif) O region, indicating the formation of more oxidized products.
O region, indicating the formation of more oxidized products.
Even if an unambiguous assignment is not possible, the evolution of bands at 1402, 1670 and 1689 cm−1 suggests the formation of acetic acid or ethylacetate, and the band at 1562 cm−1 is typical for a surface carbonate79,80 (see in Fig. S9† the deconvoluted spectrum for both catalysts at 350 °C). Thus, from this analysis it can be inferred that in the case of V/Zr/O, the formation of acetaldehyde results mainly from oxidative dehydrogenation of activated ethanol (ethoxy species). The resulting reduced V species is promptly reoxidized by O2 and is able to continue the oxidation process towards the formation of acetic acid, ethylacetate, carbonates and so on. Conversely, in the case of V/Ti/O, acetaldehyde forms mainly by disproportionation of ethanol (with co-formation of ethane), and then it evolves to acetates. However, after V5+ has been reduced, the reoxidation process is more difficult, leading to the decomposition of the acetates.
Scheme 1 depicts the proposed routes for aerobic ethanol oxidation over the two catalysts.
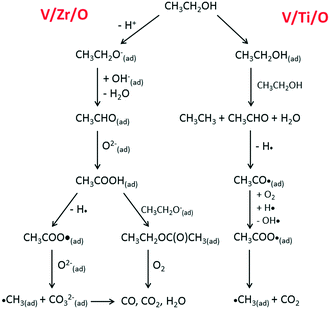 | ||
| Scheme 1 Main pathways for aerobic ethanol oxidation on the surface of V/Zr/O (left) and V/Ti/O (right) catalysts. | ||
Experiments were also conducted with V/Zr/O in the absence of O2 (anaerobic conditions), i.e., with a feed of ethanol and He as the carrier gas. Ethanol was first adsorbed at room temperature and then the temperature was increased while recording DRIFT spectra (Fig. 10). It can be seen that at low temperatures ethanol dissociated forming the ethoxy species. At 150 °C, however, a band at 1632 cm−1 appeared. The presence of this band, attributable to the C![[double bond, length as m-dash]](https://www.rsc.org/images/entities/char_e001.gif) O stretching of acetaldehyde, and the lack of a negative band for water desorption confirm that under anaerobic conditions the aldehyde is formed mainly by disproportionation. Interestingly, the spectrum of V/Zr/O under inert atmosphere is similar to that shown for V/Ti/O in air, confirming that the latter catalyst reduces quickly but is not easily reoxidised.
O stretching of acetaldehyde, and the lack of a negative band for water desorption confirm that under anaerobic conditions the aldehyde is formed mainly by disproportionation. Interestingly, the spectrum of V/Zr/O under inert atmosphere is similar to that shown for V/Ti/O in air, confirming that the latter catalyst reduces quickly but is not easily reoxidised.
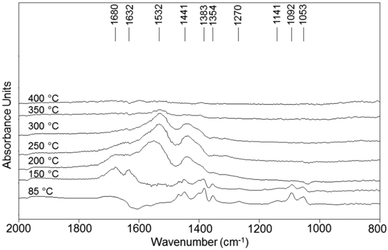 | ||
| Fig. 10 DRIFT spectra of V/Zr/O recorded during temperature-programmed-ethanol desorption using He as the carrier gas. | ||
Fig. 11 compares the main m/z signals recorded during the ethanol TPD measurements conducted with and without oxygen for V/Zr/O.
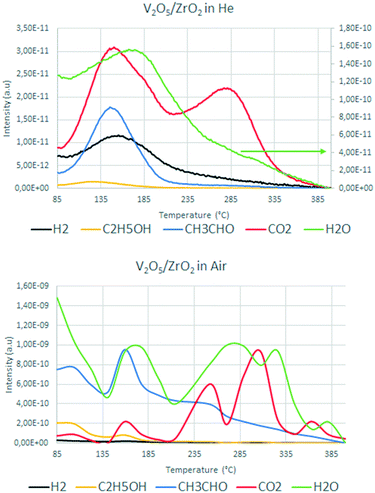 | ||
| Fig. 11 Mass signals recorded during ethanol temperature-programmed desorption over V/Zr/O under inert (top) and aerobic (bottom) conditions. | ||
Under anaerobic conditions at low temperature, the desorption of some unconverted ethanol and the formation of CO2 and water were observed, in agreement with the results for the fresh catalyst in the reactivity test (see Fig. 6). The concomitant formation of aldehyde and hydrogen was also observed. This confirms that V/Zr/O is not able to release the oxygen ion in the form of water and perform the oxidative dehydrogenation of the alcohol in the absence of an external oxygen source. At high temperature there was a CO2 desorption that was not due to total oxidation (because there was no water formation), but to a decomposition of the intermediates. Conversely, in the presence of air the concomitant desorption of acetaldehyde and water in similar relative amounts at low temperature and the absence of hydrogen formation indicate clearly the preferential ODH pathway for the aldehyde formation. At high temperature, the evolution of CO2 and water in several steps (in a higher order of magnitude compared to the anaerobic conditions) was evidence for the occurrence of combustion (total oxidation) reactions. This confirms the previously discussed hypothesis that in the presence of oxygen V/Zr/O is able to easily recover its oxidation state, leading to oxidation of the intermediate acetaldehyde into CO2 and H2O.
Conclusions
Two vanadium oxide catalysts, one supported on titania, the other on zirconia, were tested for the gas-phase ammoxidation of ethanol to acetonitrile. The two showed different catalytic behaviours, with V/Zr/O being more active and more selective to acetonitrile than V/Ti/O. The higher selectivity gave rise to the formation of less CO2 and N2 from ammonia combustion.These different behaviours were attributed to the fact that V/Zr/O is more selective than V/Ti/O in the oxidative dehydrogenation of ethanol to acetaldehyde, which is a key reaction intermediate in ammoxidation to acetonitrile. This is because the nature of V sites under steady-state conditions is different in the two cases: with V/Ti/O, the rate-determining step of the redox process is the reoxidation of V by O2, whereas with V/Zr/O it is the reduction by ethanol. This means that the V in V/Ti/O is more reduced. The different reducibility of V5+ by ethanol has also been demonstrated by specifically designed reducibility experiments. It is also important to note that the fully oxidized V5+ is intrinsically unselective under anaerobic conditions, giving rise to the formation of CO2 and H2O only. The reduced catalyst catalyzes the disproportionation of ethanol to acetaldehyde and ethane, a reaction which, conversely, occurs to a negligible extent in the presence of molecular oxygen. V/Zr/O is also more efficient in the subsequent step of acetaldehyde reaction with ammonia, which is the step needed to form imine, the precursor for nitrile formation. In this step, not only does V/Ti/O produce a greater amount of CO2, but ammonia combustion to yield N2 is also increased, which is clearly detrimental to the production of acetonitrile. The more efficient activation of ammonia with V/Zr/O has been attributed to the greater availability of oxidized V sites in this catalyst.
Acknowledgements
Lonza is acknowledged for financial support.References
- P. Pollak, G. Romeder, F. Hagedorn and H. Gelbke, Nitriles, Ullmann's Encycl. Ind. Chem., 2005, pp. 1–15 Search PubMed.
- F. Cavani, G. Centi and P. Marion, Catalytic ammoxidation of hydrocarbons on mixed oxides, in Metal Oxide Catalysts, ed. S. D. Jackson and J. S. J. Hargreaves, Wiley-VCH Verlag GmbH & Co. KGaA, Weinheim, Germany, 2009, pp. 771–818 Search PubMed.
- I. F. McConvey, D. Woods, M. Lewis, Q. Gan and P. Nancarrow, Org. Process Res. Dev., 2012, 16, 612–624 CrossRef CAS.
- Process for preparing nitriles, Monsanto Co., GB 1497649, 1976.
- G. Olivé and S. Olivé, US 4179462, 1979 Search PubMed.
- K. N. Kim and A. M. Lane, J. Catal., 1992, 137, 127–138 CrossRef CAS.
- T. Tatsumi, S. Kunitomi, J. Yoshiwara, A. Muramatsu and H. Tominaga, Catal. Lett., 1989, 3, 223–226 CrossRef CAS.
- L. J. Krebaum, US 3129241, 1964 Search PubMed.
- W. J. Sandner and W. L. Fierce, CA 615929, 1961 Search PubMed.
- Y. Li and J. N. Armor, J. Catal., 1998, 173, 511–518 CrossRef CAS.
- Y. Li and J. N. Armor, Appl. Catal., A, 1999, 183, 107–120 CrossRef CAS.
- Y. Li and J. N. Armor, J. Catal., 1998, 176, 495–502 CrossRef CAS.
- Y. Li and J. N. Armor, Appl. Catal., A, 1999, 188, 211–217 CrossRef CAS.
- E. Rojas, M. O. Guerrero-Pérez and M. A. Bañares, Catal. Commun., 2009, 10, 1555–1557 CrossRef CAS.
- Z. Sobalik, A. A. Belhekar, Z. Tvaru and B. Wichterlová, Appl. Catal., A, 1999, 188, 175–186 CrossRef CAS.
- E. Rojas, M. O. Guerrero-Pérez and M. A. Bañares, Catal. Lett., 2012, 143, 31–42 CrossRef.
- R. Bulánek, K. Novoveská and B. Wichterlová, Appl. Catal., A, 2002, 235, 181–191 CrossRef.
- W. Pan, M. Jia, H. Lian, Y. Shang, T. Wu and W. Zhang, React. Kinet. Catal. Lett., 2005, 86, 67–73 CrossRef CAS.
- F. Rubio-Marcos, E. Rojas, R. López-Medina, M. O. Guerrero-Pérez, M. A. Bañares and J. F. Fernandez, ChemCatChem, 2011, 3, 1637–1645 CrossRef CAS.
- F. Ayari, M. Mhamdi, J. Álvarez-Rodríguez, A. R. Guerrero Ruiz, G. Delahay and A. Ghorbel, Appl. Catal., A, 2012, 415-416, 132–140 CrossRef CAS.
- F. Ayari, M. Mhamdi, G. Delahay and A. Ghorbel, J. Sol-Gel Sci. Technol., 2008, 49, 170–179 CrossRef.
- F. Ayari, M. Mhamdi, D. P. Debecker, E. M. Gaigneaux, J. Alvarez-Rodriguez and A. Guerrero-Ruiz, J. Mol. Catal. A: Chem., 2011, 339, 8–16 CrossRef CAS.
- M. Mhamdi, S. Khaddar-Zine and A. Ghorbel, Appl. Catal., A, 2008, 337, 39–47 CrossRef CAS.
- H.-G. Erben, Spec. Chem. Mag., 2009, 29, 38 CAS.
- T. Ishida, H. Watanabe, T. Takei, A. Hamasaki, M. Tokunaga and M. Haruta, Appl. Catal., A, 2012, 425-426, 85–90 CrossRef CAS.
- S. J. Kulkarni, R. R. Rao, M. Subrahmanyam, A. V. Rama Rao, A. Sarkany and L. Guczi, Appl. Catal., A, 1996, 139, 59–74 CrossRef CAS.
- T. Oishi, K. Yamaguchi and N. Mizuno, Top. Catal., 2010, 53, 479–486 CrossRef CAS.
- T. Oishi, K. Yamaguchi and N. Mizuno, Angew. Chem., Int. Ed., 2009, 48, 6286–6288 CrossRef CAS PubMed.
- K. Yamaguchi and N. Mizuno, Synlett, 2010, 16, 2365–2382 Search PubMed.
- M. O. Guerrero-Pérez and M. A. Bañares, ChemSusChem, 2008, 1, 511–513 CrossRef PubMed.
- S. Kulkarni, R. Ramachandra Rao, M. Subrahmanyam and A. V. Rama Rao, J. Chem. Soc., Chem. Commun., 1994, 273 RSC.
- C. Hamill, H. Driss, A. Goguet, R. Burch, L. Petrov, M. Daous and D. Rooney, Appl. Catal., A, 2015, 506, 261–267 CrossRef CAS.
- B. M. Reddy and B. Manohar, J. Chem. Soc., Chem. Commun., 1993, 234–235 RSC.
- W. Yin, C. Wang and Y. Huang, Org. Lett., 2013, 15, 1850–1853 CrossRef CAS PubMed.
- S. P. Godbole, M. J. Seely and D. Suresh, US 6204407 B1, 2001 Search PubMed.
- S. Godbole, M. J. Seely and D. Suresh, WO 02/070465A1, 2002 Search PubMed.
- K. Yamaguchi, H. Kobayashi, T. Oishi and N. Mizuno, Angew. Chem., Int. Ed., 2012, 51, 544–547 CrossRef CAS PubMed.
- K. Yamaguchi, K. Yajima and N. Mizuno, Chem. Commun., 2012, 48, 11247–11249 RSC.
- J. He, K. Yamaguchi and N. Mizuno, J. Org. Chem., 2011, 76, 4606–4610 CrossRef CAS PubMed.
- C. Zhu, C. Sun and Y. Wei, Synthesis, 2010, 24, 4235–4241 Search PubMed.
- F.-E. Chen, Y. Li, M. Xu and H. Jia, Synthesis, 2002, 13, 1804–1806 CrossRef.
- Y. Zhang, C. Feng, C. Qiu, Y. Wen and J. Zhao, Catal. Commun., 2009, 10, 1454–1458 CrossRef CAS; C. Feng, Y. Zhang and Y. Wen, Catal. Lett., 2011, 141, 168–177 CrossRef.
- F. Cavani, F. Parrinello and F. Trifirò, J. Mol. Catal., 1987, 43, 117–125 CrossRef CAS.
- F. Cavani, E. Foresti, F. Trifiró and G. Busca, J. Catal., 1987, 106, 251–262 CrossRef CAS.
- P. Cavalli, F. Cavani, I. Manenti and F. Trifirò, Catal. Today, 1987, 1, 245–255 CrossRef CAS.
- P. Cavalli, F. Cavani, I. Manenti and F. Trifirò, Ind. Eng. Chem. Res., 1987, 26, 639–647 CrossRef CAS.
- P. Cavalli, F. Cavani, I. Manenti, F. Trifirò and M. El-Sawi, Ind. Eng. Chem. Res., 1987, 26, 804–810 CrossRef CAS.
- G. Busca, F. Cavani and F. Trifirò, J. Catal., 1987, 106, 471–482 CrossRef CAS.
- Y. Nakamura, T. Murayama and W. Ueda, ChemCatChem, 2014, 6, 741–744 CrossRef CAS.
- Y. Nakamura, T. Murayama and W. Ueda, J. Mol. Catal. A: Chem., 2014, 394, 137–144 CrossRef CAS.
- K. V. R. Chary, C. P. Kumar, T. Rajiah and C. S. Srikanth, J. Mol. Catal. A: Chem., 2006, 258, 313–319 CrossRef CAS.
- K. V. R. Chary, C. P. Kumar, D. Naresh, T. Bhaskar and Y. Sakata, J. Mol. Catal. A: Chem., 2006, 243, 149–157 CrossRef CAS.
- M. Sanati, A. Andersson, L. R. Wallenberg and B. Rebenstorf, Appl. Catal., A, 1993, 106, 51–72 CrossRef CAS.
- B. Beck, M. Harth, N. G. Hamilton, C. Carrero, J. J. Uhlrich and A. Trunschke, J. Catal., 2012, 296, 120–131 CrossRef CAS.
- L. J. Lakshmi, Z. Ju and E. C. Alyea, Langmuir, 1999, 15, 3521–3528 CrossRef CAS.
- L. J. Burcham, G. Deo, X. Gao and I. E. Wachs, Top. Catal., 2000, 11-12, 85–100 CrossRef.
- R. Z. Khaliullin and A. T. Bell, J. Phys. Chem. B, 2002, 106, 7832–7838 CrossRef CAS.
- P. R. Shah, I. Baldychev, J. M. Vohs and R. J. Gorte, Appl. Catal., A, 2009, 361, 13–17 CrossRef CAS.
- A. Adamski, Z. Sojka, K. Dyrek, M. Che, G. Wendt and S. Albrecht, Langmuir, 1999, 15, 5733–5741 CrossRef CAS.
- A. Christodoulakis, M. Machli, A. A. Lemonidou and S. Boghosian, J. Catal., 2004, 222, 293–306 CrossRef CAS.
- A. Khodakov, J. Yang, S. Su, E. Iglesia and A. Bell, J. Catal., 1998, 177, 343–351 CrossRef CAS.
- R. Sasikala, V. Sudarsan, T. Sakuntala, Jagannath, C. Sudakar and R. Naik, Appl. Catal., A, 2008, 350, 252–258 CrossRef CAS.
- D. I. Enache, E. Bordes, A. Ensuque and F. Bozon-Verduraz, Appl. Catal., A, 2004, 278, 103–110 CAS.
- D. I. Enache, E. Bordes-Richard, A. Ensuque and F. Bozon-Verduraz, Appl. Catal., A, 2004, 278, 93–102 CAS.
- S. T. Oyama and G. A. Somorjai, J. Phys. Chem., 1990, 94, 5022–5028 CrossRef CAS.
- R. Tesser, V. Maradei, M. Di Serio and E. Santacesaria, Ind. Eng. Chem. Res., 2004, 43, 1623–1633 CrossRef CAS.
- E. Santacesaria, A. Sorrentino, R. Tesser, M. Di Serio and A. Ruggiero, J. Mol. Catal. A: Chem., 2003, 204-205, 617–627 CrossRef CAS.
- N. E. Quaranta, J. Soria, V. Cortés Corberán and J. L. G. Fierro, J. Catal., 1997, 171, 1–13 CrossRef CAS.
- J. M. Miller, L. J. Lakshmi, N. J. Ihasz and J. M. Miller, J. Mol. Catal. A: Chem., 2001, 165, 199–209 CrossRef.
- H. Tian, E. I. Ross and I. E. Wachs, J. Phys. Chem. B, 2006, 110, 9593–9600 CrossRef CAS PubMed.
- S. C. Su and A. T. Bell, J. Phys. Chem. B, 1998, 102, 7000–7007 CrossRef CAS.
- I. E. Wachs, J.-M. Jehng, G. Deo, B. M. Weckhuysen, V. V. Guliants and J. B. Benziger, J. Catal., 1997, 170, 75–88 CrossRef CAS.
- S. Albrecht, G. Wendt, G. Lippold, A. Damski and K. Dyrek, Solid State Ionics, 1997, 101-103, 909–914 CrossRef CAS.
- S. Xie, E. Iglesia and A. T. Bell, J. Phys. Chem. B, 2001, 105, 5144–5152 CrossRef CAS.
- B. M. Reddy, I. Ganesh and E. P. Reddy, J. Phys. Chem. B, 1997, 101, 1769–1774 CrossRef CAS.
- G. Deo and I. E. Wachs, J. Phys. Chem., 1991, 95, 5889–5895 CrossRef CAS.
- A. M. Nadeem, G. I. N. Waterhouse and H. Idriss, Catal. Today, 2012, 182, 16–24 CrossRef CAS.
- M. Schmal, D. V. Cesar, M. M. Souza and C. E. Guarido, Can. J. Chem. Eng., 2011, 89, 1166–1175 CrossRef CAS.
- H. Idriss and E. G. Seebauer, J. Mol. Catal. A: Chem., 2000, 152, 201–212 CrossRef CAS.
- J. Velasquez Ochoa, C. Trevisanut, J. M. Millet, G. Busca and F. Cavani, J. Phys. Chem. C, 2013, 117, 23908–23918 Search PubMed.
Footnote |
| † Electronic supplementary information (ESI) available. See DOI: 10.1039/c6cy01275b |
| This journal is © The Royal Society of Chemistry 2017 |

