
Low-temperature H2-plasma-assisted NOx storage and reduction over a combined Pt/Ba/Al and LaMnFe catalyst
Zhao-shun
Zhang
ad,
Chuan
Shi
*a,
Zhi-feng
Bai
a,
Ming-run
Li
b,
Bing-bing
Chen
a and
Mark
Crocker
*c
aState Key Laboratory of Fine Chemicals, School of Chemistry, Dalian University of Technology, Dalian, China. E-mail: chuanshi@dlut.edu.cn; Tel: +86 411 84986083
bState Key Laboratory of Catalysis, Dalian Institute of Chemical Physics, Dalian, China
cCenter for Applied Energy Research, University of Kentucky, Lexington, KY 40511, USA. E-mail: mark.crocker@uky.edu; Tel: +1 859 257 0295
dSchool of Chemistry and Chemical Engineering, Qufu Normal University, Qufu, China
First published on 11th November 2016
Abstract
A model catalyst of the Pt/Ba/Al2O3 (PBA) type exhibited poor activity in NOx storage–reduction (NSR) at low temperatures (≤300 °C) even under a plasma-enhanced process. In order to achieve optimal NOx removal efficiency during plasma-assisted NOx storage–reduction in the presence of H2O and CO2, a PBA+LMF (LaMn0.9Fe0.1O3) catalyst was prepared by mechanical mixing. Compared to the PBA and LMF references, the combined PBA+LMF catalyst showed an obvious synergistic effect with respect to NOx storage capacity. With the assistance of H2 plasma in rich phase, higher NOx conversions could be obtained over the PBA+LMF sample over a wide temperature range (200–350 °C). The origin of the synergy was clarified on the basis of structure–activity correlations. The combination of non-thermal plasma and heterogeneous catalysis was proven to be very effective in improving the low temperature activity of lean NOx trap (LNT) catalysts.
1. Introduction
NOx storage and reduction (NSR) (also known as lean NOx trap (LNT)) technology is practically used for lean burn engines' NOx removal. The commercial Pt/Ba/Al2O3 (PBA) catalyst exhibits good catalytic performance at temperatures higher than 300 °C due to the strong surface basicity of BaO. However, typical engine-out temperatures in the FTP-75 (the U.S. Federal Test Procedure used to certify vehicle emissions and fuel economy) are about 180–350 °C, therefore how to improve the low temperature activity of LNT catalysts is especially important for light duty diesel applications.Though there are some efforts on this issue being published,1–4 such as doping transition metal oxides including CeO2, MnOx, CoOx, etc., to improve the low temperature activity of the Pt/Ba/Al2O3 catalyst, the activity below 250 °C is still quite lower than practical demands. On the other hand, when the low temperature activity becomes a bottleneck for thermal catalysis, non-thermal plasma might provide another possibility. In a previous study, we found that by combining the high NOx storage capacity of perovskite catalysts with non-thermal plasma-assisted activation of H2 in rich phase, high NOx conversions were achieved over the LaMn0.9Fe0.1O3 catalyst over a broad temperature range in the absence of H2O and CO2.5 However, the ubiquity of CO2 and H2O in vehicle exhaust emphasizes the importance of understanding their roles—beyond mere dilution—with respect to the function of NOx trap catalysts.6
Therefore, in the present study, the performance of representative LNT catalysts in the presence of H2O and CO2 was studied in a typical H2-plasma-assisted NSR process. It was found that the activity of the LaMn0.9Fe0.1O3 (LMF) catalyst was greatly depressed when H2O and CO2 were in co-existence. The traditional Pt/Ba/Al2O3 catalyst also exhibited poor low-temperature activity even in a H2-plasma-assisted NSR process. Meanwhile, it is exciting to find that when LMF was physically mixed with PBA (weight ratio of 1![[thin space (1/6-em)]](https://www.rsc.org/images/entities/char_2009.gif) :1), strong synergistic effects were exhibited in both NOx storage capacity and NOx storage and reduction performance, and higher NOx conversions could be obtained over the PBA+LMF catalyst over a wide temperature range (200–350 °C). The present study not only exhibited a highly active NSR catalyst, but also gave a general understanding of the formula of a NSR catalyst especially active for a low-temperature H2-plasma-assisted NSR process.
:1), strong synergistic effects were exhibited in both NOx storage capacity and NOx storage and reduction performance, and higher NOx conversions could be obtained over the PBA+LMF catalyst over a wide temperature range (200–350 °C). The present study not only exhibited a highly active NSR catalyst, but also gave a general understanding of the formula of a NSR catalyst especially active for a low-temperature H2-plasma-assisted NSR process.
2. Experimental
2.1. Catalyst preparation
Pt/Ba/Al2O3 (PBA) was prepared by incipient wetness impregnation: the γ-Al2O3 support (CNPC, surface area of 202 m2 g−1) was impregnated with aqueous Ba(O2CCH3)2 (Sinopharm Chemical Reagent Co., Ltd, AR), followed by drying at 120 °C and calcination at 500 °C in air. The resulting solid was impregnated with aqueous chloroplatinic acid (H2PtCl6·6H2O, Sinopharm Chemical Reagent Co., Ltd, AR), dried and further calcined at 500 °C for 5 h. The target Pt and Ba loadings were 1 wt% and 30 wt%, respectively. The LaMn0.9Fe0.1O3 catalyst (LMF) was prepared by the combustion synthesis method according to a literature procedure.5 Pt-LMF was similarly prepared by incipient wetness impregnation: LMF was impregnated with aqueous chloroplatinic acid, dried and further calcined at 500 °C for 5 h; the target Pt loading was 1 wt%. The PBA+LMF catalyst was prepared by mechanically mixing equal masses of PBA and LMF by means of grinding, followed by calcining the mixture at 500 °C in air. All samples were pressed, crushed, and sieved to 20–40 mesh to obtain suitable particles for the experiments.2.2. Catalyst characterization
X-ray powder diffraction (XRD) analysis was conducted using an XRD-6000 (Shimadzu) instrument with Cu Kα radiation (λ = 0.1542 nm), operating at 40 kV and 30 mA; phase identification was achieved through comparison of XRD patterns to those of the Joint Committee on Powder Diffraction Standards (JCPDS). Two types of scans were used to record the XRD measurements, hereby designated as normal scan (2° min−1, step size 2θ = 0.04°) and slow scan (0.24° min−1, step size 2θ = 0.01°). The crystallite sizes of BaCO3 in the different samples were determined using the Scherrer equation based on the width of the peak (slow scan) at 2θ = 24.08° corresponding to BaCO3 (111). X-ray photoelectron spectroscopic (XPS) measurements were conducted using an Al Kα source operated at 10 kV and 15 mA. Binding energies were corrected for charging effects by referencing them to adventitious carbon (284.6 eV). High-angle annular dark field STEM (HAADF-STEM) investigations were conducted in combination with spot energy-dispersive X-ray spectroscopy analysis (EDXS).2.3. NSC and NOC experiments
NOx storage capacity (NSC) and NO oxidation capacity (NOC) experiments were conducted in a microreactor using a chemiluminescence NOx analyzer (Ecotech ML9841AS) as the detector. The catalyst (500 mg) was firstly pretreated at 500 °C in 1% H2/Ar for 1 h, and then exposed to gases including 500 ppm NO, 8% O2, with or without 2% H2O and 2% CO2 present, and balance N2. The storage time was 50 min for the NSC experiments. NOC was measured when the steady state had been achieved (typically requiring 2–3 h). The NSC and NOC were calculated according to the following formulae: | (1) |
 | (2) |
2.4. In situ DRIFTS
In situ DRIFTS measurements were performed on a Tensor 27 (Bruker) FTIR spectrometer. The catalyst was firstly pretreated in 1% H2/Ar at 500 °C for 30 min and then cooled to the desired temperature in Ar. A gas mixture of 500 ppm NO, 8% O2 with or without 2% H2O and 2% CO2 present, and Ar as the balance gas was then introduced, and a series of NOx adsorption spectra were obtained over time. All spectra were measured with a resolution of 4 cm−1 and accumulating 128 scans. A background spectrum was subtracted from each spectrum.CO adsorption measurements were conducted to investigate the chemical state of Pt on the surface of the PBA catalyst. After reduction in H2 at 500 °C, the sample was pre-treated in flowing helium (99.999%, 50 ml min−1) at 500 °C and cooled to 20 °C, then exposed to flowing 3% CO/He (50 ml min−1) for 15 min (to saturate the sample) and finally flushed with flowing He. DRIFT spectra were then recorded. All spectra reported here were collected at a resolution of 4 cm−1 for 60 scans.
2.5. NOx-TPD and H2-TPSR
Each sample was first pretreated at 500 °C for 60 min in 1% H2/Ar and then cooled to the desired temperature in Ar. NOx adsorption was carried out in 500 ppm NO, 8% O2 and balance Ar, with or without 2% H2O and 2% CO2 present at 200 °C for 50 min. After purging the catalyst with Ar at 200 °C for 30 min, the temperature was raised to 700 °C at a rate of 10 °C min−1 in flowing Ar. H2-TPSR was performed after NOx adsorption at 300 °C for 50 min, and then temperature programmed reduction in 2% H2/Ar at a rate of 10 °C min−1. NOx-TPD and H2-TPSR were conducted in a microreactor using a mass spectrometer (Pfeiffer Vacuum GSD 301) as the detector.2.6. Catalyst evaluation
Catalytic activities were measured in a dielectric-barrier discharge (DBD) reactor as described in the literature,7 loaded with 500 mg of catalyst particles (20–40 mesh). The voltage was applied with a high-voltage power source (CTP-2000K, Nanjing Suman Electronic Co., Ltd) working at about 40 kHz. Effluent gases were analyzed on-line using a mass spectrometer (Pfeiffer Vacuum GSD 301). The catalyst was firstly pretreated in 2% H2/Ar at 500 °C for 1 h, and then cooled to the desired temperature for lean–rich cycling measurements until the catalyst reached a cycle-averaged steady state. Briefly, NOx is first stored on the catalyst during the fuel lean phase (plasma off) and then the stored NOx is reduced to N2 and H2O by the plasma during the fuel rich phase (plasma on). The NOx concentration was averaged over 5 cycles to give a mean conversion according to the following formula: | (3) |
The cycling parameters and gas composition used for the cycling experiments are summarized in Table 1.
| Parameter | Lean | Rich |
|---|---|---|
| Duration (s) | 600 | 120 |
| Temperature (°C) | 150–350 | 150–350 |
| Power input (W) | — | 1.8 |
| Space velocity (ml gcat−1 h−1) | 14400 |
14400 |
| NO (ppm) | 500 | — |
| O2 (%) | 8 | — |
| H2 (%) | — | 2 |
| Ar (%) | Balance | Balance |
3. Results
3.1. Catalyst characterization
The X-ray diffraction patterns of PBA, LMF and PBA+LMF catalysts are shown in Fig. 1. For the PBA catalyst, the main phases detected were BaCO3 (JCPDS no. 45-1471) and γ-Al2O3 (JCPDS no. 47-1770). The characteristic reflections of Pt or PtOx were not observed due to the low concentration of Pt in the PBA catalyst.2 In the case of LMF, the positions and relative intensities of the XRD peaks of the as-prepared LaMn0.9Fe0.1O3 sample are consistent with those of the standard LaMnO3.11 compound (JCPDS no. 50-0297).5 For the PBA+LMF sample, the sample showed diffraction patterns for BaCO3 and LaMnO3.11 crystallites. The estimated BaCO3 particle size (according to the Scherrer equation) was ca. 15 nm and ca. 11 nm for PBA and PBA+LMF, respectively. The decrease in BaCO3 particle size for the PBA+LMF sample is suggestive of a chemical interaction between LMF and PBA, i.e., possible formation of a new phase such as BaLaMn2O5.5,8 which has the same diffraction pattern as LaMnO3.11.5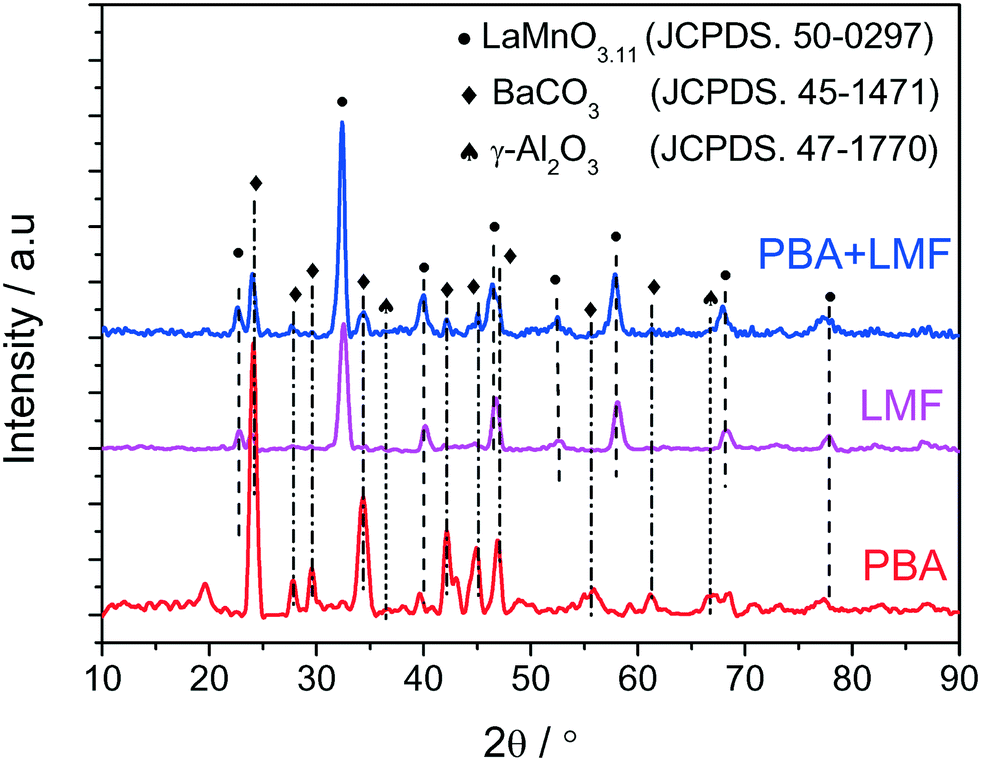 | ||
| Fig. 1 XRD patterns of PBA, LMF and PBA+LMF. | ||
Fig. 2(a)–(c) show the XPS spectra of O 1s for the PBA, LMF and PBA+LMF samples. By deconvolution, the distribution of oxygen species was estimated. Two kinds of oxygen species were present, the peak at BE = 530.8 eV being ascribed to surface lattice oxygen (Olatt2−) species, while that at BE = 532.2 eV being assigned to adsorbed oxygen species (Oads).2,3,5 The ratios of Oads/Olatt2− were 0.817 and 0.609 for LMF and PBA+LMF, respectively, significantly higher than that of PBA (0.196). This means that the LMF and PBA+LMF samples are enriched with surface oxygen compared to PBA. The Mn 2p XPS spectra are shown in Fig. 2(d) and (e). By means of curve fitting, there are two kinds of Mn species present; the Mn 2p3/2 binding energy at 641.4 eV is assigned to Mn3+, while that at 642.9 eV is ascribed to Mn4+.3,9 The ratio of Mn4+/Mn3+ is 0.940 in LMF, higher than that in PBA+LMF (0.630). These results indicate that LMF is enriched with surface Mn4+ species as compared to PBA+LMF. This is consistent with the Oads/Olatt2− data which show that LMF has more surface oxygen than PBA+LMF. On the other side, the change of Mn4+/Mn3+ ratio upon mixing LMF with PBA is also suggestive of a chemical interaction between LMF and PBA.
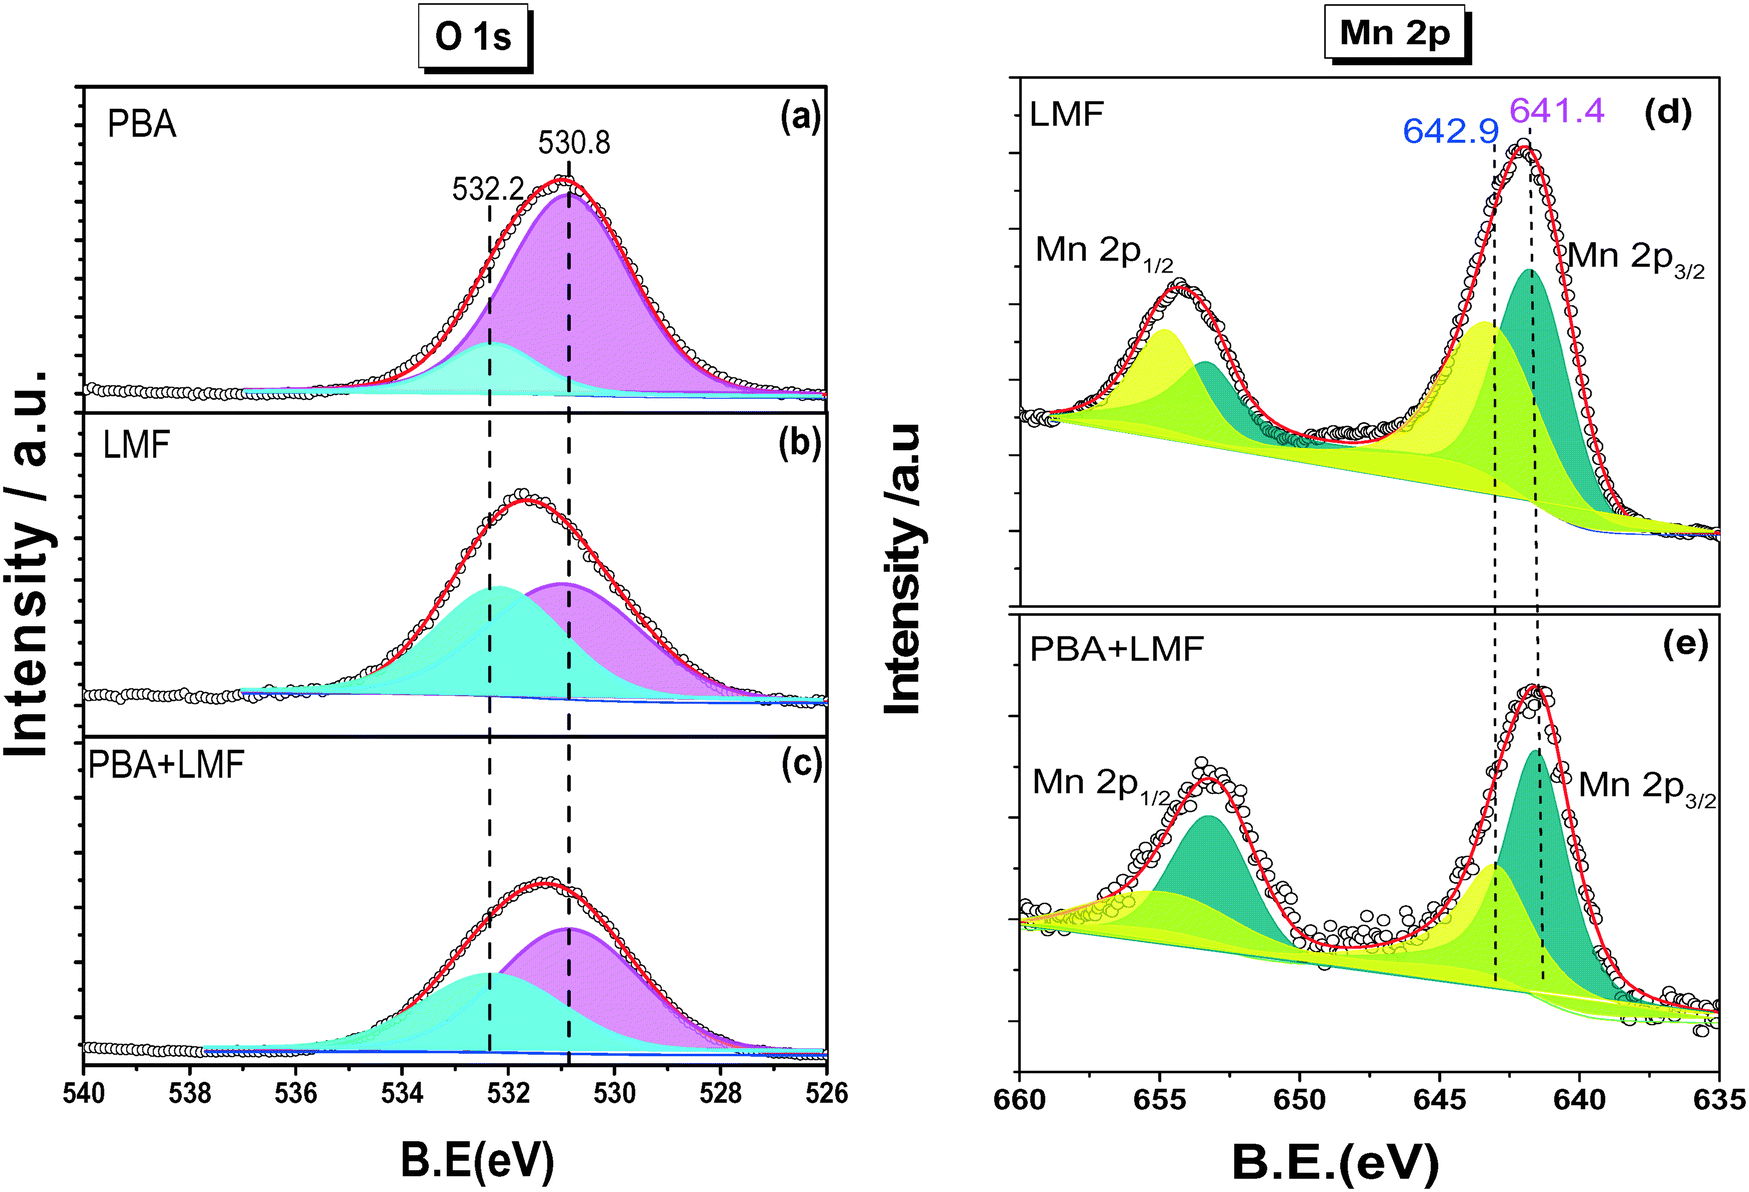 | ||
| Fig. 2 O 1s XPS spectra of PBA (a), LMF (b), PBA+LMF (c) and Mn 2p XPS spectra of LMF (d), PBA+LMF (e). | ||
DRIFTS measurements were performed after CO chemisorption on the reduced PBA, LMF and PBA+LMF samples in order to probe the state of the Pt sites, and the results are shown in Fig. 3. For comparison purposes, analogous DRIFTS measurements were also recorded for Pt-LMF. For PBA, there is a strong peak observed at 2063 cm−1, with a shoulder at 2042 cm−1 also detected. Given that the alkaline BaO/Al2O3 support is electron-rich, electron donation to the 5d orbital of Pt occurs when Pt is supported.10,11 As a result, increased back-donation of electron density from the Pt 5d orbital to CO (2π*) occurs when CO is chemisorbed, leading to a red shift of the CO vibration.11 On this basis, the band at 2042 cm−1 can be assigned to CO linearly adsorbed on Pt sites close to Ba species, while the other band at 2063 cm−1 is assigned to CO chemisorbed on Pt in contact with Al2O3. The other peaks at 1830,11 1845,12 and 1868 cm−1 (ref. 13) can be assigned to bridged-CO (B-CO) species.13 In addition, a small band at 2122 cm−1 was observed (Fig. 3); in general, carbonyls stabilized on cationic Pt sites give rise to a band above 2100 cm−1,14,15 and thus the band at 2122 cm−1 can be attributed to linearly coordinated CO species on Pt2+.
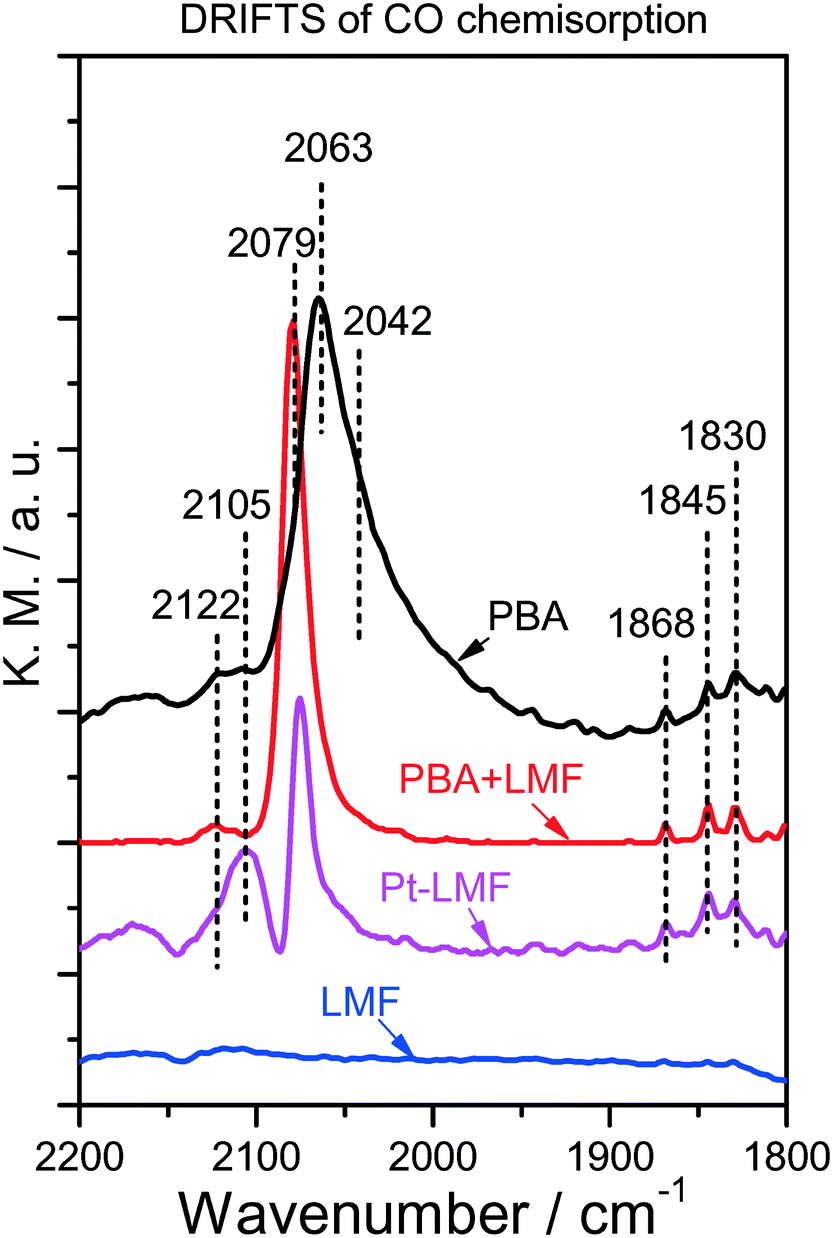 | ||
| Fig. 3 DRIFT spectra of CO chemisorbed on the different catalysts. | ||
In the case of the Pt-LMF sample, two obvious bands at 2079 and 2105 cm−1 were observed. According to the foregoing assignments, the band at 2079 cm−1 can be ascribed to CO linearly adsorbed on Pt sites interacting with LMF. Since the oxide support is electron-deficient, charge transfer should occur from Pt to the oxide, resulting in the observed blue shift in the CO vibration. The band at 2105 cm−1 can be assigned to CO adsorption on partially oxidized platinum Ptδ+.13 For the PBA+LMF sample, an obvious band at 2079 cm−1 was observed which was attributed to CO adsorption on Pt sites close to LMF, as indicated above. Notably, the band at 2042 cm−1, which is related to CO adsorbed on Pt sites close to Ba species (PBA), was not observed. In addition, similar to PBA, both linear-CO on Pt2+ (2122 cm−1) and bridged-CO species (1830, 1845 and 1868 cm−1) were observed in the DRIFT spectrum. The above results give clear evidence of CO adsorption on Pt sites close to LMF over the PBA+LMF sample.
The morphology change was confirmed by high-angle annular dark field STEM (HAADF-STEM) combined with spot energy-dispersive X-ray spectroscopy analysis (EDXS). The investigations were performed by comparison of PBA with PBA+LMF samples. As shown in Fig. 4(a), the bright white rod-like species present in the PBA sample should be ascribed to crystalline BaCO3 as indicated by the corresponding intense barium peaks (as indicated for the red square labeled region 2). Conversely, the dark region marked as region 1 (again indicated by a red square) corresponds to an Al-rich area. In the enlarged images shown in Fig. 4(b) and (c), highly dispersed, individual bright spots with an average size of ca. 1 nm are observed, which correspond to Pt nanoparticles. The corresponding X-ray spectrum shows both Pt peaks and Al peaks, while the Ba peaks are noticeably weak, indicating that Pt is preferentially dispersed on γ-Al2O3 instead of BaCO3.
 | ||
| Fig. 4 STEM images of PBA (a–c) and PBA+LMF (d–f) samples. The EDX spectra obtained from the outlined areas are shown. | ||
In the case of PBA+LMF (Fig. 4(d)), rod-like BaCO3 structures can't be clearly observed. In region 1 (indicated by a red square), strong Ba and La peaks coexist, suggesting the possible formation of a new phase such as BaLaMn2O5.5. It is also noteworthy that there is no Pt observed in this region. However, as characterized by the dark region marked in the red square 2, strong peaks due to La, Mn and Fe are observed, as well as Pt, indicating the dispersion of Pt on LMF. The bright white region, marked by the red square 3, displays strong peaks for Pt, La and Mn, indicating the re-dispersion of Pt on LMF. In the enlarged images shown in Fig. 4(e) and (f), individual bright spots due to Pt particles are observed, the observed Pt particle size distribution of 2–4 nm being a little larger than that observed for PBA.
3.2. NO oxidation capacity
Shown in Fig. 5(a) are the conversions of NO to NO2 as a function of reaction temperature in the absence of H2O and CO2. All samples displayed low NO conversion at 150 °C (<20%). As the temperature increased from 150 to 300 °C, the LMF and PBA+LMF samples showed enhanced NO conversions. However, the conversion over the PBA catalyst remained quite low (23.2% at 300 °C). Upon further increase of the temperature to 350 °C, the conversion of NO to NO2 continued to increase for PBA and PBA+LMF; however, the conversion decreased from 78.4% to 66.2% for LMF under the same conditions, which is due to the thermodynamic limitation associated with the NO/NO2 equilibrium. Based on the XPS results presented above, it is apparent that surface adsorbed oxygen plays an important role in NO oxidation,9i.e., the higher surface oxygen concentration of the LMF catalyst, as compared to PBA, is consistent with its superior NO oxidation capacity.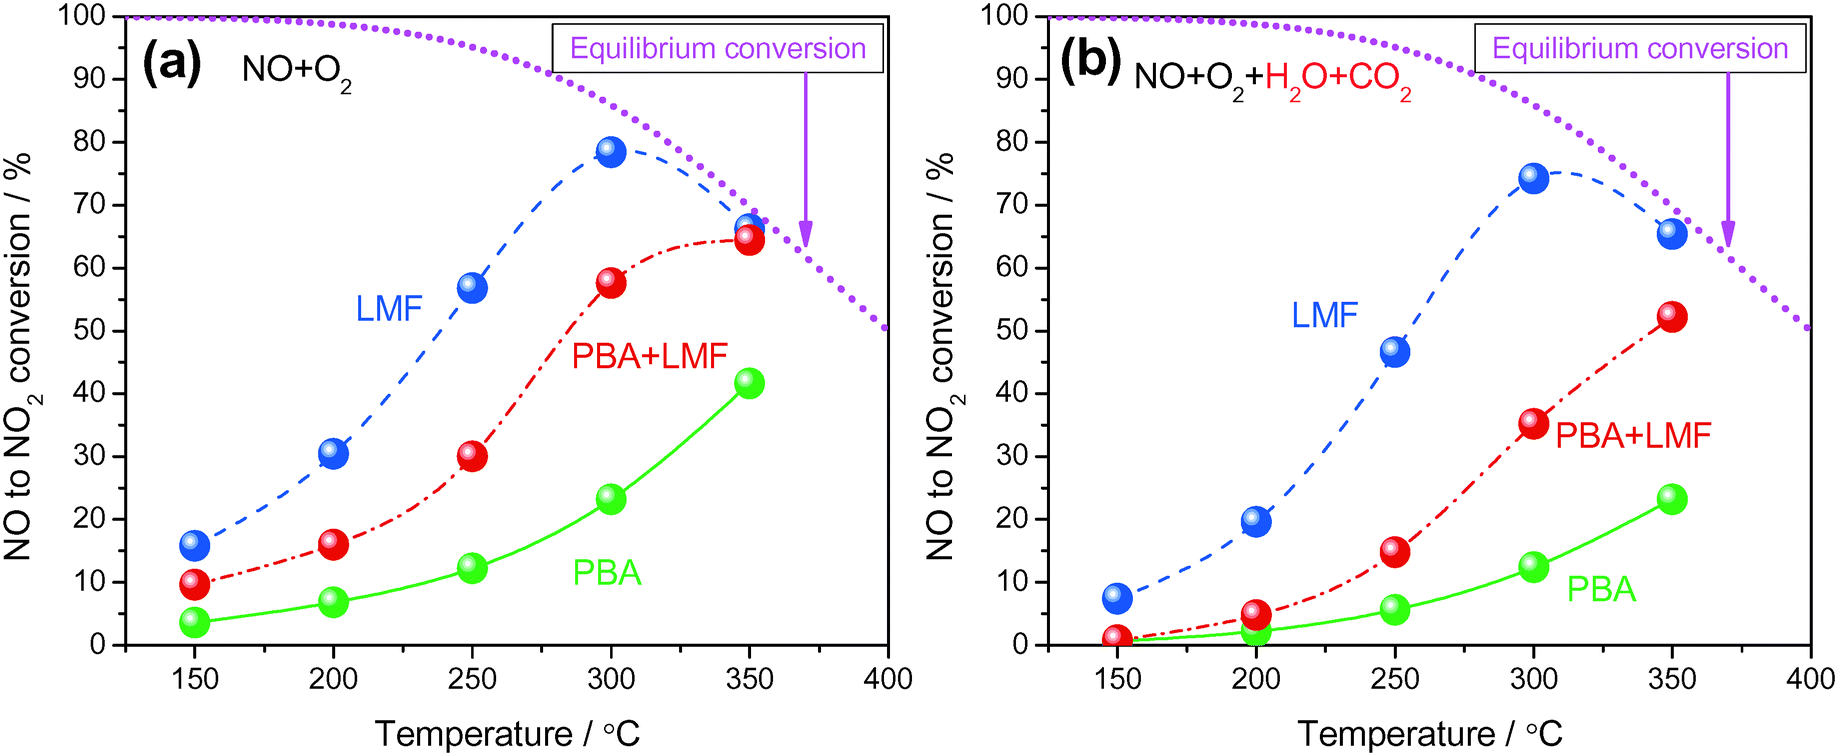 | ||
| Fig. 5 NO conversion to NO2 measured under lean conditions (500 ppm NO, 8% O2, with or without 2% CO2 and 2% H2O, Ar balance, WHSV = 14400 ml gcat−1 h−1): without H2O and CO2 (a) and with H2O and CO2 (b). | ||
Fig. 5(b) shows the conversion of NO to NO2 as a function of reaction temperature in the presence of H2O and CO2. Compared to the experiments performed using 500 ppm NO/8% O2/Ar as feed gas (Fig. 5(a)), the addition of H2O and CO2 decreased the NOC for all the samples. Notably, LMF is still the most active catalyst for NO oxidation, followed by the PBA+LMF and PBA catalysts.
3.3. NOx storage capacity
Fig. 6 shows the NOx storage capacities (NSCs) of the catalysts measured at different temperatures in a continuously flowing feed in both the absence and presence of H2O and CO2. In the absence of H2O and CO2 (Fig. 6(a)), PBA exhibited its highest NSC value at 350 °C. The LMF sample showed higher NSC compared to the PBA sample even at 150 °C, and the NSC showed little dependence on temperature. However, the NSC decreased when the temperature was raised to 350 °C, which can be explained by the decreased thermal stability of the stored nitrites at higher temperatures.5,16,17 Notably, much higher NSC values were obtained over the PBA+LMF sample, and compared with PBA, the enhancement of NSC on PBA+LMF was particularly evident at higher temperatures.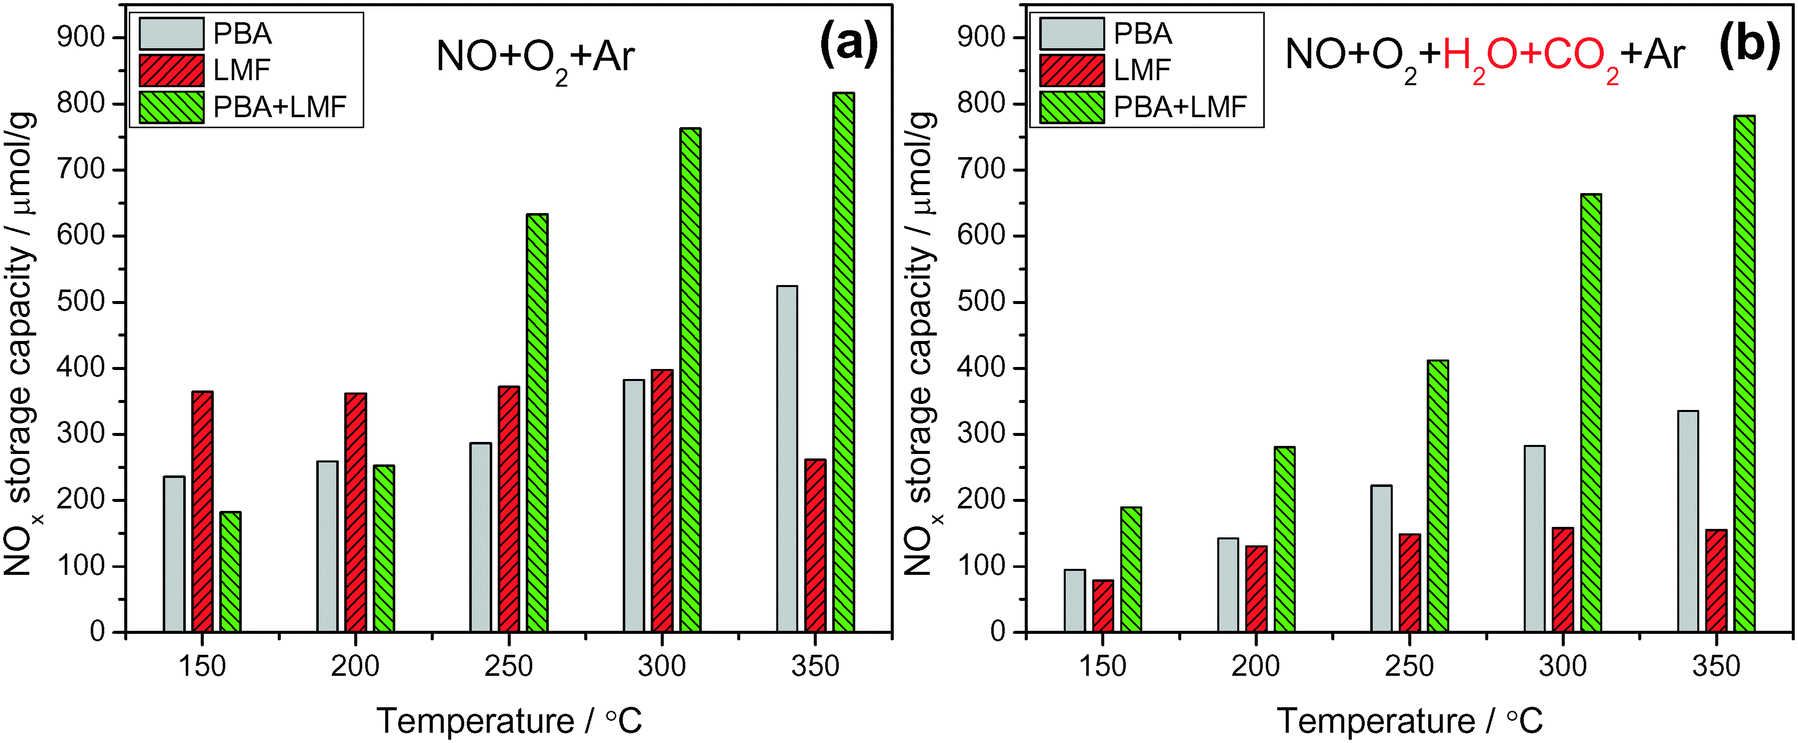 | ||
| Fig. 6 NOx storage capacity measured under lean conditions in the absence (a) and presence (b) of H2O and CO2 at different temperatures; 50 min storage time, WHSV = 14400 ml gcat−1 h−1. | ||
Compared to the experiments performed using only 500 ppm NO/8% O2/Ar as the feed gas (Fig. 6(a)), the addition of H2O and CO2 significantly decreased the NSC for the PBA and LMF samples (Fig. 6(b)), especially for the LMF sample. While the latter showed relatively high NSC in the absence of H2O and CO2 over a broad temperature range (150–300 °C, as shown in Fig. 6(a)), its NSC significantly decreased when H2O and CO2 were introduced into the feed gas. Notably, in the case of PBA+LMF, the presence of H2O and CO2 caused only a slight reduction in the NSC over the full temperature range studied, as shown in Fig. 6. Although both the LMF and PBA+LMF catalysts displayed relatively high NO oxidation activity compared to PBA (as noted previously), even in the presence of H2O and CO2 (Fig. 5), LMF showed the lowest NSC over the full temperature range. On this basis, it can be concluded that the poor NOx storage capacity of LMF in the presence of H2O and CO2 cannot be ascribed to its lower NO oxidation activity. Rather, other explanations must be considered, e.g., relatively weaker NOx adsorption (relative to the adsorption of H2O/CO2) on the LMF sample or the possibility that NOx storage may be accomplished via different mechanisms for the different catalysts.18–20 In the case of PBA-type catalysts, much work has been done to elucidate the mechanism of NOx storage.21–25 Specifically, two parallel pathways for NOx storage on Pt/Ba/Al have been proposed by Nova et al.:18,20,26 a “nitrite route”, in which O2 is activated by Pt sites and transferred to neighboring Ba sites, favoring the stepwise oxidation of NO to nitrite ad-species; nitrites are then progressively oxidized into nitrate species, which are the predominant species at catalyst saturation. In parallel with the formation of nitrite ad-species, oxidation of NO to NO2 can also occur on Pt sites; the NO2 thus formed can be stored on BaO in the form of nitrates, one NO molecule being released for every three molecules of NO2 consumed via reaction with BaO. It has been proposed that the “nitrite” pathway dominates over the disproportion route in the case of NO/O2 adsorption over PBA. In addition, from the comparison of the NSC data in the presence of H2O and CO2 for PBA, LMF and PBA+LMF, it is clear that the combination of PBA and LMF greatly enhanced the NSC at all temperatures, indicating a strong synergistic effect on NSC resulting from the physical mixing of PBA and LMF.
3.4. Adsorbed NOx species
In situ DRIFT spectra showing the evolution of surface NOx species in the different feed gases are shown in Fig. 7. After exposing the PBA catalyst to a NO/O2/Ar mixture for 50 min at 200 °C, two obvious bands at 1230 and 1325 cm−1 and a small band at 1548 cm−1 were observed (Fig. 7(a)). According to the literature, the band at 1230 cm−1 can be attributed to nitrite species on Ba,27,28 and the band at 1325 cm−1 can be assigned to nitrates on Ba.4 The small band centered at 1548 cm−1 can also be assigned to nitrates, although it is difficult to assign the location of these species (i.e., to BaO or γ-Al2O3) due to the overlap of bands in this region.29 Upon exposure of the LMF sample to the NO/O2/Ar mixture at 200 °C, a strong band at 1260 cm−1 and a weak band at 1552 cm−1 were observed. These bands can be assigned to nitrite species on La or Mn sites.16,30–32 The main surface species on PBA+LMF corresponded to nitrates (1315 and 1548 cm−1) at 200 °C. Notably, the nitrite band (1230 cm−1) associated with the PBA component of the PBA+LMF sample was very weak (Fig. 7(a)), which is likely a consequence of the stronger oxidation capacity of PBA+LMF compared to PBA. In addition, a shoulder peak could be observed in the spectrum of PBA+LMF at 1245 cm−1 which is assigned to monodentate nitrates associated with Al.29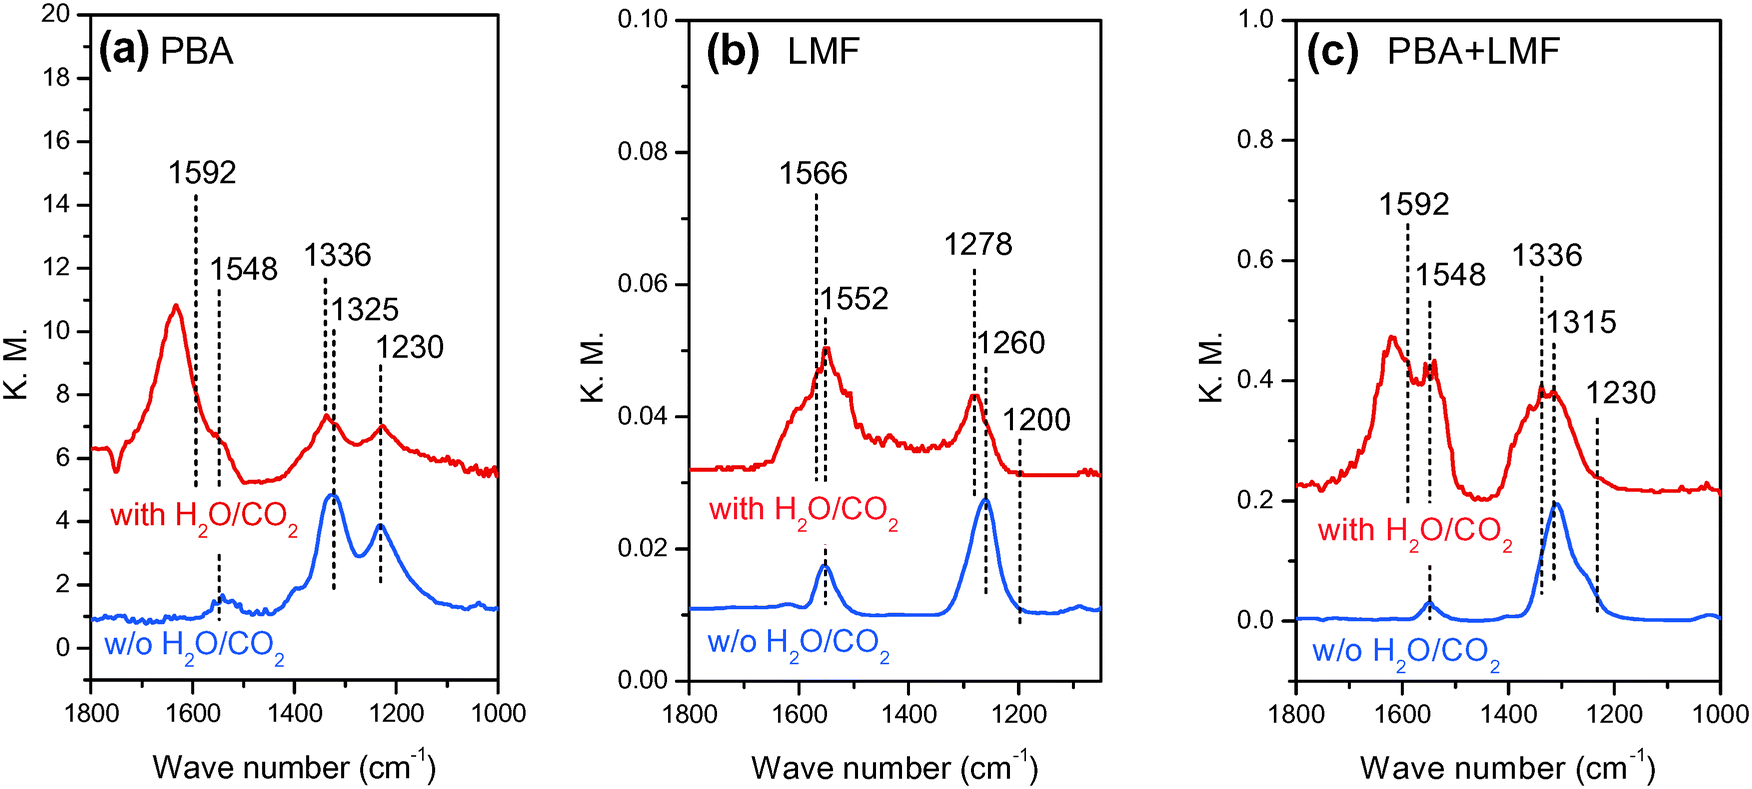 | ||
| Fig. 7 In situ DRIFT spectra of PBA (a), LMF (b) and PBA+LMF (c) catalysts after 50 min of NO adsorption at 200 °C. | ||
When H2O and CO2 were added to the feed gas (shown in Fig. 7(a)–(c)), the intensities of all of the above bands were significantly reduced, while new bands appeared at 1336 and 1592 cm−1 for PBA and PBA+LMF, and at 1278 and 1566 cm−1 for LMF. These new bands are assigned to carbonates on Ba,28 La or Mn.33 Besides the foregoing bands, a new band was observed at 1635 cm−1 for all samples that can be ascribed to adsorbed water δ(H–O–H).34,35 Notably, compared with LMF, the intensity of the δ(H–O–H) band was much higher for the PBA and PBA+LMF samples, especially for PBA.
3.5. Thermal stability of the stored NOx
The thermal stability of stored NOx was investigated by means of NOx-TPD experiments, and the results are shown in Fig. 8. In the absence of H2O and CO2 (Fig. 8(a)), two obvious NOx desorption peaks (m/z = 30) were observed at 307 and 514 °C for the PBA sample. Correlated with the DRIFT results, the former can be attributed to weakly adsorbed nitrite species, while the latter desorption event, which was accompanied by O2 (m/z = 32) generation, can be assigned to the decomposition of nitrate at Ba sites.5 In the case of LMF, a broad NOx desorption peak was observed from 250 to 500 °C with a maximum near 307 °C, indicating the poor thermal stability of the adsorbed NOx. Moreover, no oxygen release was observed. This is consistent with the DRIFTS results that the adsorbed NOx species are nitrite species on La or Mn sites. For the PBA+LMF sample, a very broad NOx desorption peak was observed, commencing at ca. 370 °C and ending at ca. 600 °C, with an additional small peak at 301 °C. The latter desorption event is associated with NOx release from γ-Al2O3, as indicated in the case of the PBA sample. Based on literature reports, it is reasonable to ascribe the broad peak to the decomposition of several types of adsorbed NOx species. Deconvolution of the TPD profile reveals the presence of a strong desorption peak at 467 °C (Fig. 8(a)), indicating that a large fraction of the stored NOx desorbed at a temperature lower than that observed for PBA (514 °C). | ||
| Fig. 8 NOx-TPD profiles after NOx adsorption in 500 ppm NO/8% O2/Ar (a) and 500 ppm NO/8% O2/2% CO2/2% H2O/Ar (b) for 50 min at 200 °C. | ||
Compared to the case when H2O and CO2 were absent (Fig. 8(a)), the intensity of the NOx desorption peaks significantly decreased after H2O and CO2 co-existed (Fig. 8(b)). This is mainly due to the inhibition of NOx adsorption, as demonstrated by the decreased NSC measured in the presence of H2O and CO2 (Fig. 6(b)). In addition, the high-temperature NOx desorption peak of PBA (Fig. 8(b)) shifted to an even higher temperature in the presence of H2O and CO2 (from 514 °C to 553 °C). According to Theis et al.,36 the presence of H2O enhances the spillover of NO2 from Pt sites to the NOx storage sites (Ba) during lean operation, possibly via the formation of nitric acid (HNO3) which then reacts with NOx storage sites to form the stored NOx species. Consequently, it can be speculated that the higher NOx mobility in the presence of H2O results in NOx storage at sites further away from Pt, which might explain the higher desorption temperature.3 For the LMF sample, the intensity of the NOx desorption peak at ca. 300 °C decreased compared with the case in the absence of H2O and CO2, implying the strong competitive adsorption between NOx and H2O/CO2 on the same sites, being a consequence of the significantly reduced NSC obtained in the presence of H2O and CO2 (as shown in Fig. 6). Over PBA+LMF, there was a broad and large NOx desorption peak, accompanied by O2 formation, centered at 486 °C. Compared with NOx desorption from PBA, NOx desorbed in a larger amount but at lower temperature from PBA+LMF, which is consistent with the enhanced NSC, especially at lower temperatures, observed for PBA+LMF (shown in Fig. 6).
3.6. Reduction behavior of the stored NOx
Reduction of stored NOx was investigated by means of H2-TPSR experiments. After NOx adsorption in 500 ppm NO/8% O2/Ar, two obvious H2 consumption peaks (m/z = 2) accompanied by N2 (m/z = 28) formation were observed at 92 and 207 °C for the PBA sample as shown in Fig. 9(a). This result suggests that surface nitrates/nitrites on Al and Ba sites reacted with H2 at 92 °C and 207 °C,5 respectively, with the simultaneous formation of N2. In the case of the LMF sample, the N2 formation peak was observed at 368 °C, which did not line up with the H2 consumption peak (410 °C). This discrepancy can be attributed to the reduction of surface or lattice oxygen on the catalyst, which evidently occurs at slightly higher temperature than NOx reduction.5 In addition, unlike PBA, significant NOx desorption was observed in the H2-TPSR process from 250 to 400 °C. Evidently, due to the higher NOx reduction temperature and the poor thermal stability of the NOx stored on LMF, a fraction of the NOx was released before H2 reduction could occur. According to the H2-TPSR results for PBA+LMF shown in Fig. 9(a), two H2 consumption maxima (m/z = 2) were observed at 100 and 180 °C. The peak at 100 °C can be attributed to the reduction of NOx weakly adsorbed on the γ-Al2O3 support as previously described, while the peak at 180 °C is assigned to the reduction of nitrate or nitrite on Ba sites. Notably, the reduction of adsorbed NOx on Ba occurred at a lower temperature on PBA+LMF than that on the PBA sample (the H2 consumption maxima were observed at 180 and 207 °C, respectively). Comparing the reduction behavior of the LMF, PBA and PBA+LMF catalysts, it is clear that reduction of stored NOx requires much higher temperatures over LMF than over the PBA and PBA+LMF catalysts. This explains the poor performance of LMF during lean–rich cycling experiments, in which NOx was released before H2 reduction. | ||
| Fig. 9 H2-TPSR profiles obtained under 2% H2/Ar after NOx adsorption in 500 ppm NO/8% O2/Ar (a) and 500 ppm NO/8% O2/2% CO2/2% H2O/Ar (b) gas stream for 50 min; NOx adsorption was performed at 300 °C. | ||
Reduction of stored NOx (H2-TPSR) was also investigated subsequent to the adsorption of NO in feed gas containing H2O and CO2, the results being shown in Fig. 9(b). For PBA, H2 consumption (m/z = 2) accompanied by N2 (m/z = 28) formation was observed at 221 °C. Compared with the experiments conducted in the absence of H2O and CO2 during NO adsorption (Fig. 9(a)), the low-temperature H2 consumption peak was not observed. As indicated above, this low-temperature peak can be ascribed to NOx stored on the Al2O3 support, which was inhibited in the presence of H2O.37 In the case of LMF, the majority of stored NOx was desorbed at ca. 300 °C, such that only a very weak N2 formation peak was observed. In this case, H2 consumption was mainly associated with the reduction of surface or lattice oxygen.5 In the case of PBA+LMF, compared to the experiments performed in the absence H2O and CO2 (Fig. 9(a)), the H2 consumption peak at lower temperature was not observed. In addition, the reduction of stored NOx was slightly inhibited (i.e., occurred at a higher temperature) compared with the results obtained in the absence of H2O and CO2. H2O is known to adsorb on Pt at low temperature,38 so it is reasonable to expect that this leads to the blockage of sites on the Pt surface for hydrogen adsorption, this being the rate determining step for noble metal-catalyzed hydrogen oxidation.39 Notably, NOx release from PBA and PBA+LMF was not observed during the H2-TPSR process. However, almost all of the stored NOx desorbed from LMF during H2-TPSR due to an imbalance in the rates of NOx release and NOx reduction. Given the absence of Pt, LMF shows poor activity for NOx reduction; hence, most of the NOx is released without being reduced.
3.7. NOx storage and reduction by catalysis only
NOx storage and reduction were investigated under cycling conditions using H2 as the reductant, the NOx conversion profiles being shown in Fig. 10. The cycle-averaged lean phase NOx storage efficiency and rich phase NOx release values are collected in Table 2. In the absence of H2O and CO2 (Fig. 10(a)), the NOx removal efficiency increased with increasing temperature and the highest conversion for the PBA catalyst was obtained at 350 °C, which is consistent with results reported in the literature.2 Compared with PBA, the LMF sample displayed much lower NOx removal efficiency at all temperatures, the poor catalytic performance of LMF during lean–rich cycling being attributed to the low activity for reduction of the stored NOx, as revealed by the much higher NRE values at low temperatures (≤250 °C) and the poor NOx storage capacities at higher temperatures due to the lack of strong basicity components such as Ba, K, etc. (shown in Table 2). In the case of PBA+LMF, considerably higher cycle-averaged NOx conversions were obtained at 150 °C to 350 °C as a result of its excellent NOx storage (higher NSE) and NOx reduction properties (lower NRE) over a broad temperature range (as shown in Fig. 6 and 9).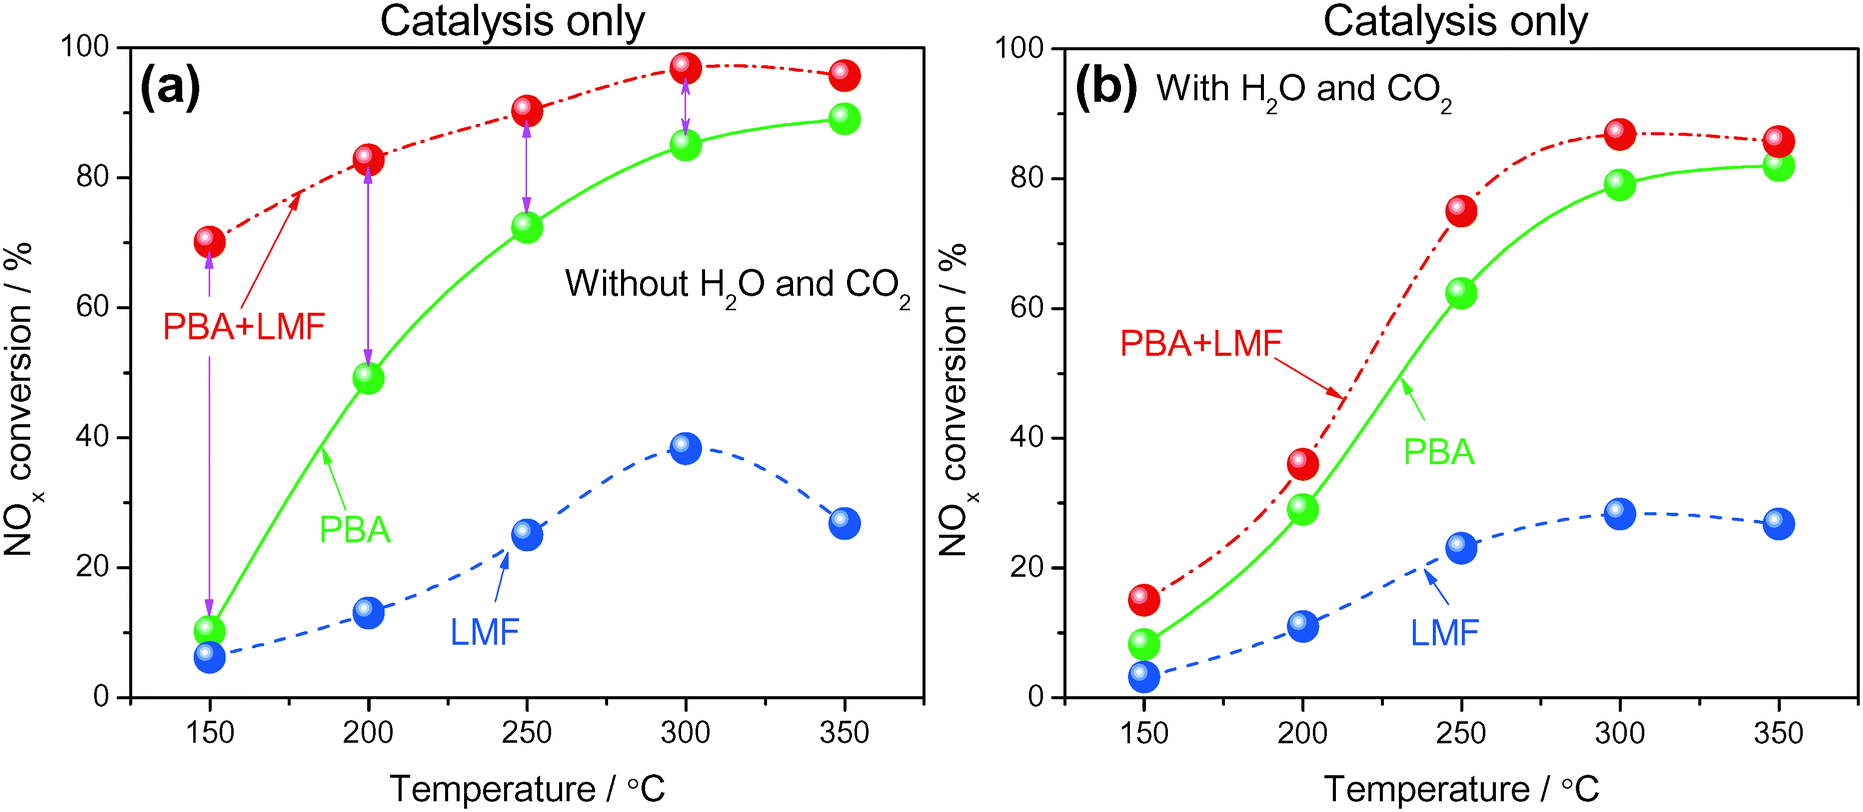 | ||
| Fig. 10 NOx conversion during lean/rich cycling in the absence (a) and presence (b) of H2O and CO2 at different temperatures; WHSV = 14400 ml gcat−1 h−1. | ||
| Catalyst | Temperature (°C) | NSC (10 min) (μmol g−1) | NOx release (μmol g−1) | NSE (%) | NREb (%) |
|---|---|---|---|---|---|
| a “w/o” means “without”, “w” means “with”. b (NOx released in rich purge/NOx stored in lean phase) × 100%. | |||||
| PBA (w/o H2O/CO2) | 150 | 24.9 | 19.5 | 46.6 | 36.4 |
| 200 | 34.4 | 8.04 | 64.1 | 15.0 | |
| 250 | 43.6 | 4.82 | 81.3 | 9.01 | |
| 300 | 47.3 | 1.77 | 88.3 | 3.31 | |
| 350 | 48.6 | 0.91 | 90.7 | 1.72 | |
| LMF (w/o H2O/CO2) | 150 | 28.52 | 25.19 | 94.6 | 47.1 |
| 200 | 29.91 | 22.94 | 95.3 | 42.8 | |
| 250 | 24.66 | 11.26 | 95 | 21.1 | |
| 300 | 21.23 | 0.70 | 90.7 | 1.32 | |
| 350 | 14.74 | 0.38 | 90.9 | 0.71 | |
| PBA+LMF (w/o H2O/CO2) | 150 | 42.02 | 4.45 | 78.4 | 8.37 |
| 200 | 45.99 | 1.66 | 85.8 | 3.15 | |
| 250 | 49.63 | 1.29 | 92.6 | 2.48 | |
| 300 | 53.22 | 1.34 | 99.3 | 2.56 | |
| 350 | 52.26 | 0.96 | 97.5 | 1.82 | |
| PBA (w/ H2O/CO2) | 150 | 6.11 | 1.72 | 11.4 | 3.21 |
| 200 | 19.19 | 3.64 | 35.8 | 6.83 | |
| 250 | 41.59 | 8.20 | 77.6 | 15.3 | |
| 300 | 44.65 | 2.30 | 83.3 | 4.34 | |
| 350 | 46.90 | 2.95 | 87.5 | 5.52 | |
| LMF (w/ H2O/CO2) | 150 | 3.00 | 1.29 | 5.61 | 2.43 |
| 200 | 8.15 | 2.25 | 15.2 | 4.21 | |
| 250 | 14.79 | 2.47 | 27.6 | 4.61 | |
| 300 | 17.96 | 2.79 | 33.5 | 5.23 | |
| 350 | 14.74 | 0.38 | 27.5 | 0.75 | |
| PBA+LMF (w/ H2O/CO2) | 150 | 11.04 | 3.00 | 20.6 | 5.67 |
| 200 | 24.23 | 4.93 | 45.2 | 9.26 | |
| 250 | 41.59 | 1.39 | 77.6 | 2.61 | |
| 300 | 50.12 | 3.59 | 93.5 | 6.74 | |
| 350 | 47.49 | 1.55 | 88.6 | 2.93 | |
When H2O and CO2 were added to the feed gas (Fig. 10(b)), each of the samples exhibited decreased NOx removal efficiency in comparison with the results reported in Fig. 10(a). Notably, the presence of H2O and CO2 in the feed decreased the NOx conversion of PBA+LMF greatly, especially at low temperatures. Analysis of the NSE and NRE data shown in Table 2 shows that the loss in activity should be due to its decrease in NOx storage capacity, as well as the enhanced NRE in the presence of H2O and CO2, especially at low temperatures (≤250 °C). However, as shown in Fig. 6, the presence of H2O and CO2 in the feed did not exhibit such a big negative effect on NOx storage capacities during steady measurement, which suggests that the catalyst mustn't be fully regenerated during the lean–rich cycles leading to the decreased NSC. Accordingly, the activity for reduction of the stored NOx must be improved.
3.8. Combination of non-thermal plasma and heterogeneous catalysis for NOx storage and reduction
Based on the promise of NTP-assisted catalysis, we opted to employ NTP in the rich phase to aid catalyst regeneration. Fig. 11(a) depicts the cycle-averaged NOx conversions as a function of reaction temperature, measured in the absence of H2O and CO2, from which it is evident that the NOx removal efficiency of PBA, LMF and PBA+LMF over the temperature range 150–350 °C was greatly enhanced compared with the performance obtained in the absence of the NTP in the rich phase (Fig. 10(a)). Most notable was the improvement in the cycle-averaged NOx conversion obtained over the LMF sample. According to our previous study, the reduction of stored NOx is the rate limiting step over LMF;5 clearly, by employing NTP in the rich phase to assist reduction of the stored NOx, the NOx conversion was greatly improved, especially at low temperature. Although the reduction activity was enhanced by NTP, the NOx removal efficiency of PBA below 300 °C was lower than those obtained over the LMF and PBA+LMF samples. This can be attributed to the poor NO oxidation capacity of PBA at low temperatures, resulting in its relatively low NOx storage capacity. In contrast, over the mixed PBA+LMF sample, higher NOx conversions (>95%) could be obtained over the whole temperature range from 150 to 350 °C.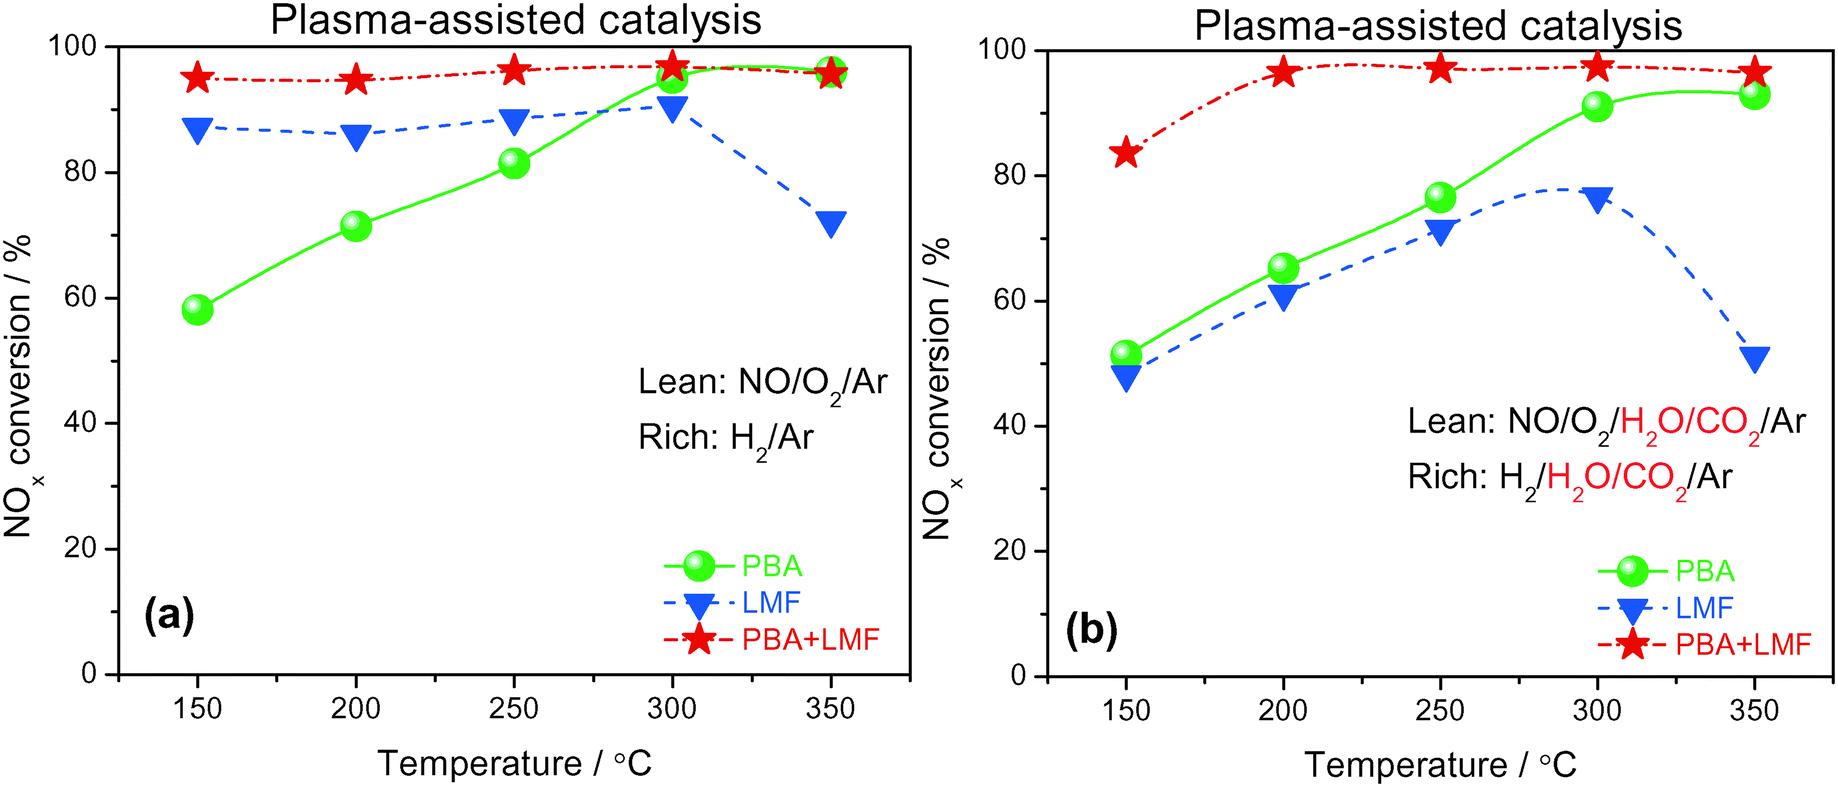 | ||
| Fig. 11 NOx conversion during lean/rich cycling at different temperatures (lean phase: 500 ppm NO, 8% O2, balance Ar, without (a) or with (b) 2% H2O and 2% CO2, duration: 10 min; rich phase: 1% H2, balance Ar, with or without 2% H2O and 2% CO2, discharge power: 1.8 W, duration: 2 min, WHSV = 14400 ml gcat−1 h−1). | ||
Plasma-assisted NOx storage and reduction experiments were also conducted over the PBA, LMF and PBA+LMF samples in the presence of H2O and CO2 (Fig. 11(b)). LMF exhibited decreased NOx removal efficiency at all temperatures, a consequence of the fact that the NOx storage capacity of LMF was significantly inhibited by the addition of H2O and CO2 as shown in Fig. 6. Notably, the presence of H2O and CO2 in the feed did not decrease the NOx conversion over PBA as much as that over LMF, although again the decrease in NOx conversion can be ascribed to the decreased NSC in the presence of H2O and CO2. Notably, addition of H2O and CO2 to the feed resulted in only a minor decrease in NOx removal efficiency for PBA+LMF during NTP-assisted NSR (Fig. 11(b)). NOx conversions were close to 99% at all temperatures from 200 to 350 °C, while a cycle-averaged conversion of 84% was obtained at 150 °C.
The cycle-averaged lean phase NOx storage efficiency and rich phase NOx release values are collected in Table 3. A rather low NOx release percentage was observed for PBA above 300 °C. The comparatively higher NOx release at 200 and 250 °C for PBA can be ascribed to an imbalance between the rates of nitrate decomposition and NOx reduction, i.e., the rate of NOx reduction was too low for the released NOx to be reduced. Higher temperatures of 300–350 °C therefore represent an optimum at which a balance is achieved between the rates of nitrate decomposition and NOx reduction. In the case of LMF, significant NOx release was observed above 200 °C, especially in the presence of H2O and CO2, due to the poor thermal stability of surface NOx species as previously verified in the NOx-TPD measurements (Fig. 8). In contrast, almost no NOx release was observed from PBA+LMF in the absence/presence of H2O and CO2. This result can be attributed to the high thermal stability of the NOx species formed (as shown in Fig. 8) and the excellent NOx reduction activity (as shown in Fig. 9), thereby maintaining a balance between the rates of nitrate decomposition and NOx reduction for PBA+LMF over the full operating temperature range, even in the presence of H2O and CO2.
| Catalyst | Temperature (°C) | NSC (10 min) (μmol g−1) | NOx release (μmol g−1) | NSE (%) | NREb (%) |
|---|---|---|---|---|---|
| a “w/o” means “without”, “w” means “with”. b (NOx released in rich purge/NOx stored in lean phase) × 100%. | |||||
| PBA (w/o H2O/CO2) | 150 | 31.2 | 0.08 | 58.2 | 0.13 |
| 200 | 38.4 | 1.96 | 71.7 | 5.1 | |
| 250 | 44.4 | 1.73 | 82.9 | 3.9 | |
| 300 | 51.2 | 0.2 | 95.6 | 0.21 | |
| 350 | 51.5 | 0.02 | 96.1 | 0.02 | |
| LMF (w/o H2O/CO2) | 150 | 50.7 | 0.82 | 94.6 | 1.61 |
| 200 | 51.1 | 1.83 | 95.3 | 3.58 | |
| 250 | 50.9 | 2.39 | 95 | 4.69 | |
| 300 | 48.6 | 4.56 | 90.7 | 9.38 | |
| 350 | 48.7 | 9.81 | 90.9 | 20.1 | |
| PBA+LMF (w/o H2O/CO2) | 150 | 51.1 | 0.26 | 95.4 | 0.51 |
| 200 | 50.8 | 0.37 | 94.8 | 0.73 | |
| 250 | 51.6 | 0.35 | 96.3 | 0.68 | |
| 300 | 51.9 | 0.24 | 96.9 | 0.46 | |
| 350 | 51.3 | 0.18 | 95.8 | 0.35 | |
| PBA (w/ H2O/CO2) | 150 | 27.5 | 0.98 | 51.3 | 3.56 |
| 200 | 34.9 | 2.15 | 65.2 | 6.16 | |
| 250 | 42 | 3.35 | 76.5 | 8.17 | |
| 300 | 49.8 | 0.2 | 91.2 | 0.41 | |
| 350 | 50.1 | 0.88 | 93.1 | 1.76 | |
| LMF (w/ H2O/CO2) | 150 | 28.5 | 2.64 | 53.1 | 9.27 |
| 200 | 34.3 | 1.56 | 64 | 4.55 | |
| 250 | 42.1 | 3.81 | 78.6 | 9.06 | |
| 300 | 48.6 | 7.54 | 90.8 | 15.5 | |
| 350 | 43.7 | 16.3 | 81.6 | 37.3 | |
| PBA+LMF (w/ H2O/CO2) | 150 | 44.8 | 0.15 | 84 | 0.035 |
| 200 | 51.7 | 0.05 | 96.5 | 0.009 | |
| 250 | 52 | 0.16 | 97.1 | 0.032 | |
| 300 | 52.2 | 0.23 | 97.4 | 0.043 | |
| 350 | 51.7 | 0.05 | 96.5 | 0.096 | |
4. Discussion
Hybrid plasma–catalyst systems have been proven to be very efficient in VOC oxidation, automobile catalysis, water purification, and reforming/hydrogen generation reactions.40–44 In general, two ways have been proposed for combining NTP with catalysts. In the first method, the NTP is placed upstream of the catalyst bed in order to activate the gas prior to contact with the surface of the catalyst; this is essentially a “two-stage” plasma-catalysis system. In the second way, the discharge occurs over the surface of the catalyst; this is a so-called “single-stage” plasma-catalysis system, with the goal of achieving higher efficiency compared with the two-stage configuration.45 However, no matter which kind of system is being used, the problem associated with the plasma-catalysis approach is the relatively high energy cost required to remove very low concentrations of pollutants. Therefore, an improved plasma process has been proposed by several groups.46–49 Our group has reported a “cyclic storage discharge” approach for VOC removal, where the low concentration of VOC is first enriched on an adsorbent, after which the NTP is briefly switched on for the desorption (decomposition) and/or oxidation of the adsorbed VOC.48 Since the plasma is only applied for a very short time compared with the operating time for VOC enrichment, the energy consumption is greatly reduced.Following on from these studies, we propose a non-thermal plasma-assisted NSR process, especially for low-temperature activity improvement. In the lean phase, a catalyst with high NSC is required to store NOx over a wide temperature range (150–350 °C). In the rich phase, H2-plasma is introduced to assist the catalyst regeneration. It is supposed that the DBD plasma, possessing an average electron energy of 1–5 eV, enhances the dissociation of H2 into H (the binding energy of H2 being ca. 4.4 eV), which should be the key step for H2 reduction in the rich phase. Actually, when the reaction rate is high enough at higher temperatures (>350 °C), there is no necessity for the assistance of NTP. In other words, NTP could be switched on only at low temperatures, at which H2-reduction was limited. As indicated by the results presented in this paper, NOx conversions of greater than 90% can be obtained over the mixed PBA+LMF sample over a wide temperature range (200–350 °C) in a H2-plasma-assisted NSR process (Fig. 11), even in the presence of H2O and CO2.
For optimal results when applying a H2-plasma in the rich phase, it is important that the NSR catalyst possesses high NOx storage capacity, especially in the low temperature region. Indeed, the LMF catalyst, which exhibited the highest NSC at low temperatures, gave generally higher NOx conversions than PBA in H2-plasma-assisted NSR.5 However, the co-existence of H2O and CO2 in the feed led to a considerable loss of NSC, thereby limiting its usefulness. By mechanically mixing PBA with LMF, a synergetic effect was obtained with respect to the NSC, which was manifested in the NOx conversion obtained during NSR cycling, especially during H2-plasma-enhanced NSR. To understand this synergetic effect, structure characterization was carried out, providing evidence of a re-construction that occurred upon calcination of the mixture. Specifically, a decrease in the BaCO3 crystal size was observed, suggesting that the BaCO3 phase may have undergone re-dispersion due to an interaction with LMF (possibly forming a BaLaMnO5.5 phase). Moreover, the blue band shift observed for CO adsorbed on Pt is indicative of charge transfer from Pt to LMF, suggesting a close interaction between the two phases. This morphology change was confirmed by HAADF-STEM combined with EDXS analysis. As is well known, the proximity of NO oxidation and NOx storage sites is crucial for NSR catalysts. As indicated in Fig. 5, LMF exhibited the highest NO oxidation ability (NO → NO2), in both the absence and presence of H2O and CO2. When it was mixed with PBA, which provided storage sites for NO2, the PBA+LMF mixture showed a synergetic effect on NSC, due to the proximity of the sites for NO oxidation and NOx storage. However, the PBA+LMF catalyst still exhibited poor activities at low temperatures in typical catalysis-only NSR cycling because of NOx release in the rich phase as indicated in Table 2. Consequently, given the high lean phase NSC and H2 plasma-assisted NOx reduction in the rich phase, high NOx conversions (>90%) could be obtained over the PBA+LMF sample over a wide temperature range (200–350 °C).
5. Conclusions
According to a comparative study of traditional Pt/Ba/Al2O3 (PBA), perovskite-type LMF and physically mixed PBA+LMF catalysts, the three catalysts exhibit strikingly different NOx storage capacities in the absence and presence of H2O and CO2. Notably, the combination of PBA and LMF prepared by mechanical mixing exhibited improved NSC compared to the other catalysts, even in the presence of H2O and CO2. This is attributed to the reconstruction of the mixture upon calcination, which provided sites for NO oxidation and storage which were in close proximity. Hence, by combining the high NOx storage capacity of PBA+LMF with non-thermal plasma-assisted activation of the reducing agent (H2), high NOx conversions were achieved over a broad temperature range.Acknowledgements
This work was supported by the National Natural Foundation of China (no. 21373037 and 21577013), the Fundamental Research Funds for the Central Universities (no. DUT12LK23, DUT13YQ107, DUT15TD49 and DUT16ZD224) and the China Postdoctoral Science Foundation of MOE (2014M560201). Z. S. Zhang is thankful to the Shandong Provincial Natural Science Foundation (no. ZR2016BB27). MC thanks the National Science Foundation and the U.S. Department of Energy (DOE) for financial support under award no. CBET-1258742. However, any opinions, findings, conclusions, or recommendations expressed herein are those of the authors and do not necessarily reflect the views of the DOE.References
- X. Y. Wang, Y. B. Yu and H. He, Appl. Catal., B, 2011, 104, 151–160 CrossRef CAS.
- C. Shi, Y. Ji, U. M. Graham, G. Jacobs, M. Crocker, Z. Zhang, Y. Wang and T. J. Toops, Appl. Catal., B, 2012, 119–120, 183–196 CrossRef CAS.
- Z.-S. Zhang, B.-B. Chen, X.-K. Wang, L. Xu, C. Au, C. Shi and M. Crocker, Appl. Catal., B, 2015, 165, 232–244 CrossRef CAS.
- X. Y. Wang, Y. B. Yu and H. He, Appl. Catal., B, 2010, 100, 19–30 CrossRef CAS.
- C. Shi, Z. S. Zhang, M. Crocker, L. Xu, C. Y. Wang, C. T. Au and A. M. Zhu, Catal. Today, 2013, 211, 96–103 CrossRef CAS.
- Y. J. Ren and M. P. Harold, ACS Catal., 2011, 1, 969–988 CrossRef CAS.
- Z.-S. Zhang, M. Crocker, B.-B. Chen, Z.-F. Bai, X.-K. Wang and C. Shi, Catal. Today, 2015, 256, 115–123 CrossRef CAS.
- T. Motohashi, M. Kimura, Y. Masubuchi, S. Kikkawa, J. George and R. Dronskowski, Chem. Mater., 2016, 28, 4409–4414 CrossRef CAS.
- C. Shi, Y. Wang, A. Zhu, B. Chen and C. Au, Catal. Commun., 2012, 28, 18–22 CrossRef CAS.
- L. Olsson and E. Fridell, J. Catal., 2002, 210, 340–353 CrossRef CAS.
- J. Y. Luo, M. Meng, Y. Q. Zha, Y. N. Xie, T. D. Hu, J. Zhang and T. Liu, Appl. Catal., B, 2008, 78, 38–52 CrossRef CAS.
- J. P. Dacquin, C. Lancelot, C. Dujardin, C. Cordier-Robert and P. Granger, J. Phys. Chem. C, 2011, 115, 1911–1921 CAS.
- B. T. Qiao, A. Q. Wang, X. F. Yang, L. F. Allard, Z. Jiang, Y. T. Cui, J. Y. Liu, J. Li and T. Zhang, Nat. Chem., 2011, 3, 634–641 CrossRef CAS PubMed.
- A. Bourane, O. Dulaurent, K. Chandes and D. Bianchi, Appl. Catal., A, 2001, 214, 193–202 CrossRef CAS.
- E. Ivanova, M. Mihaylov, F. Thibault-Starzyk, M. Daturi and K. Hadjiivanov, J. Mol. Catal. A: Chem., 2007, 274, 179–184 CrossRef CAS.
- B. Klingenberg and M. A. Vannice, Appl. Catal., B, 1999, 21, 19–33 CrossRef CAS.
- J. J. Yu, Z. Jiang, L. Zhu, Z. P. Hao and Z. P. Xu, J. Phys. Chem. B, 2006, 110, 4291–4300 CrossRef CAS PubMed.
- Z. M. Liu and S. I. Woo, Catal. Rev.: Sci. Eng., 2006, 48, 43–89 CAS.
- L. Castoldi, I. Nova, L. Lietti and P. Forzatti, Catal. Today, 2004, 96, 43–52 CrossRef CAS.
- I. Nova, L. Castoldi, L. Lietti, E. Tronconi, P. Forzatti, F. Prinetto and G. Ghiotti, J. Catal., 2004, 222, 377–388 CrossRef CAS.
- N. Rankovic, A. Nicolle and P. Da Costa, J. Phys. Chem. C, 2010, 114, 7102–7111 CAS.
- N. W. Cant, I. O. Y. Liu and M. J. Patterson, J. Catal., 2006, 243, 309–317 CrossRef CAS.
- S. S. Chaugule, A. Yezerets, N. W. Currier, F. H. Ribeiro and W. N. Delgass, Catal. Today, 2010, 151, 291–303 CrossRef CAS.
- U. Elizundia, R. Lopez-Fonseca, I. Landa, M. A. Gutierrez-Ortiz and J. R. Gonzalez-Velasco, Top. Catal., 2007, 42–43, 37–41 CrossRef.
- J. Dawody, L. Eurenius, H. Abdulhamid, M. Skoglundh, E. Olsson and E. Fridell, Appl. Catal., A, 2005, 296, 157–168 CrossRef CAS.
- L. Castoldi, I. Nova, L. Lietti and P. Forzatti, Catal. Today, 2004, 96, 43–52 CrossRef CAS.
- Y. Y. Ji, T. J. Toops, J. A. Pihl and M. Crocker, Appl. Catal., B, 2009, 91, 329–338 CrossRef CAS.
- C. Sedlmair, J. Catal., 2003, 214, 308–316 CrossRef CAS.
- L. Lietti, I. Nova and P. Forzatti, J. Catal., 2008, 257, 270–282 CrossRef CAS.
- T. J. Dines, C. H. Rochester and A. M. Ward, J. Chem. Soc., Faraday Trans., 1991, 87, 643–651 RSC.
- K. I. Hadjiivanov, Catal. Rev.: Sci. Eng., 2000, 42, 71–144 CAS.
- W. S. Kijlstra, D. S. Brands, E. K. Poels and A. Bliek, J. Catal., 1997, 171, 208–218 CrossRef CAS.
- H. Xian, X. Zhang, X. Li, H. Zou, M. Meng, Z. Zou, L. Guo and N. Tsubaki, Catal. Today, 2010, 158, 215–219 CrossRef CAS.
- B. B. Chen, C. A. Shi, M. Crocker, Y. Wang and A. M. Zhu, Appl. Catal., B, 2013, 132, 245–255 CrossRef.
- J. Szanyi, J. H. Kwak, R. J. Chimentao and C. H. F. Peden, J. Phys. Chem. C, 2007, 111, 2661–2669 CAS.
- J. Theis, H. W. Jen, R. McCabe, M. Sharma, V. Balakotaiah and M. P. Harold, Society of Automotive Engineers Technical Paper, 2006, 2006-01-1067 Search PubMed.
- W. S. Epling, L. E. Campbell, A. Yezerets, N. W. Currier and J. E. Parks, Catal. Rev.: Sci. Eng., 2004, 46, 163–245 Search PubMed.
- A. Scotti, I. Nova, E. Tronconi, L. Castoldi, L. Lietti and P. Forzatti, Ind. Eng. Chem. Res., 2004, 43, 4522–4534 CrossRef CAS.
- C. H. F. Peden, B. D. Kay and D. W. Goodman, Surf. Sci., 1986, 175, 215–225 CrossRef CAS.
- H. H. Kim, G. Prieto, K. Takashima, S. Katsura and A. Mizuno, J. Electrost., 2002, 55, 25–41 CrossRef CAS.
- A. Gomez-Ramirez, V. J. Rico, J. Cotrino, A. Gonzalez-Elipe and R. M. Lambert, ACS Catal., 2014, 4, 402–408 CrossRef CAS.
- H. H. Kim, K. Takashima, S. Katsura and A. Mizuno, J. Phys. D: Appl. Phys., 2001, 34, 604–613 CrossRef CAS.
- S. S. Kim, H. Lee, J. W. Choi, B. K. Na and H. K. Song, Catal. Commun., 2007, 8, 1438–1442 CrossRef CAS.
- Y. S. Mok, C. M. Nam, M. H. Cho and I. S. Nam, IEEE Trans. Plasma Sci., 2002, 30, 408–416 CrossRef CAS.
- H. L. Chen, H. M. Lee, S. H. Chen, Y. Chao and M. B. Chang, Appl. Catal., B, 2008, 85, 1–9 CrossRef CAS.
- Q. Yu, H. Wang, T. Liu, L. Xiao, X. Jiang and X. Zheng, Environ. Sci. Technol., 2012, 46, 2337–2344 CrossRef CAS PubMed.
- H. Wang, X. Li, P. Chen, M. Chen and X. Zheng, Chem. Commun., 2013, 49, 9353–9355 RSC.
- D. Z. Zhao, X. S. Li, C. Shi, H. Y. Fan and A. M. Zhu, Chem. Eng. Sci., 2011, 66, 3922–3929 CrossRef CAS.
- H. Y. Fan, C. Shi, X. S. Li, D. Z. Zhao, Y. Xu and A. M. Zhu, J. Phys. D: Appl. Phys., 2009, 42 Search PubMed.
| This journal is © The Royal Society of Chemistry 2017 |